Public Appointments Data Report 2020/21 (HTML)
Published 21 October 2021

© Crown copyright 2021
This publication is licensed under the terms of the Open Government Licence v3.0 except where otherwise stated. To view this licence, visit nationalarchives.gov.uk/doc/open-government-licence/version/3 or write to the Information Policy Team, The National Archives, Kew, London TW9 4DU, or email: psi@nationalarchives.gov.uk.
Where we have identified any third party copyright information you will need to obtain permission from the copyright holders concerned.
This publication is available at https://www.gov.uk/government/publications/public-appointments-data-report-202021/public-appointments-data-report-202021-html
1. Introduction
The data in this report cover public appointments made by United Kingdom Government Ministers to bodies and offices listed in the Schedule to the Public Appointments Order in Council. These appointments are regulated by the Commissioner for Public Appointments and are therefore referred to as regulated roles. The report includes data collected during the appointments process over the period 1 April 2020 to 31 March 2021, as well as data on existing appointees at 31 March 2021.
The Commissioner for Public Appointments also publishes data collected on appointments and reappointments in his annual report. The Commissioner’s report includes appointments made by Ministers in the Welsh Government as well as UK Government Ministers, a reflection of the Commissioner’s remit. For this reason, the data on in-year appointments in this report differ from that in the Commissioner’s report.
2. Response rates and sample sizes
The primary data in this report are based on information collected from departments by the Cabinet Office[footnote 1]. This is done manually and, whilst every effort is taken to quality assure the data, errors and omissions can occur. The Cabinet Office is working on the introduction of a single online application portal for public appointments alongside an improved website to provide greater functionality and features which will assist in data collection and support public appointees to undertake their roles.
Some of the data is presented alongside other official statistics and data published by third party sources (see section 10).
It is important to note that:
-
headcount values relating to diversity characteristics based on fewer than five responses are not shown in this report to protect individuals’ confidentiality and because the numbers are too small to draw reliable conclusions. However these figures are included in totals. Where 0% is specified, it indicates a nil response;
-
the response rate varies between diversity characteristics (see table 2.1). The response rate includes those who chose any option including those who chose ‘prefer not to say’. The response rate does not include those who did not provide any information for that particular characteristic;
-
percentage breakdowns for diversity only include responses that provided known information about a given characteristic and do not include those who chose ‘prefer not to say’. This means, for example, the total ethnic background sample excludes those who did not provide this data or who chose the ‘prefer not to say’ option;
-
values in this report are rounded to the nearest whole number which may result in apparent discrepancies in bar graphs.
In January 2020, the diversity monitoring form for public appointments was updated to include a two stage question on disability, in line with the Office for National Statistics (ONS) harmonisation standards for disability. Standardising the language in the form was also another of the commitments set out in the 2019 Public Appointments Diversity Action Plan, and will allow comparison with other published statistics in future years. However, as with any question change, there will be a period during which data is captured using a mix of approaches. Section 6 on disability therefore shows the data gathered using the previous single stage question and the two stage question separately.
The response rate for disability was calculated using the number of people who were given the opportunity to answer each particular question as the denominator.
2.1 Response rates for gender[footnote 2] and ethnicity, including respondents who selected ‘prefer not to say’
|
|
Serving appointees | Reappointments made in 20/21 | New appointments made in 20/21 | Total - new and reappointments made in 20/21 |
|---|---|---|---|---|
| Gender | 84% | 67% | 81% | 73% |
| Ethnicity | 73% | 66% | 81% | 73% |
| Disability (single stage question) for those who were asked this question | 71% | 21% | 73% | 44% |
| Disability (two stage question) for those who were asked this question | 65% | 94% | 96% | 95% |
3. Total number of appointees
The data show that, on 31 March 2021, there were 4,637 public appointees in regulated roles who were appointed by UK Government Ministers. Of these, 53% (2460) were in roles where the appointments were made directly by UK Government Ministers and 47% (2177) were in bodies where the appointing authority has been delegated by Ministers.
Delegated roles include Ministry of Justice appointments made to Advisory Committees on Justices of the Peace, Independent Monitoring Boards of any prison or young offender institutions, including national chair and Prisoner Escort and Custody Services lay observers; and Department of Health and Social Care appointments made to NHS Trusts. The responsibility for these appointments was delegated by Ministers because of the volume and local nature of these roles, but Ministers remain accountable for them.
Chart 3.1 illustrates the spread of appointees between departments.
3.1 Total number of public appointees on 31st March 2021
| Department | Non-delegated Appointments Chairs and Members on 31st March 2021 | Delegated Appointments Chairs and Members on 31st March 2021 |
|---|---|---|
| Attorney General's Office | 1 | 0 |
| Scotland Office | 3 | 0 |
| Export Credits Guarantee Department (UK Export Finance) | 7 | 0 |
| Northern Ireland Office | 30 | 0 |
| HM Treasury | 39 | 0 |
| Foreign, Commonwealth and Development Office | 44 | 0 |
| Ministry of Housing, Communities and Local Government | 61 | 0 |
| Cabinet Office | 63 | 0 |
| Department for Work and Pensions | 75 | 0 |
| Department for Transport | 86 | 0 |
| Home Office | 124 | 0 |
| Department for Education | 131 | 0 |
| Department for Business, Energy & Industrial Strategy | 213 | 0 |
| Department for the Environment, Food and Rural Affairs | 213 | 0 |
| Ministry of Defence | 300 | 0 |
| Department for Digital, Culture, Media and Sport | 378 | 0 |
| Department of Health and Social Care | 169 | 453 |
| Ministry of Justice | 524 | 1,724 |
Appointments made in 2020/21
1,439 public appointments were made between 1 April 2020 and 31 March 2021. Of these, 40% (576) were to roles where the appointments were made directly by UK Government Ministers and 60% (863) were made to bodies where the appointing authority has been delegated by ministers.
The new appointments made in 2020/21 consisted of 666 (46%) new appointments and 773 (54%) reappointments. Reappointments are up from 42% in 2019/20. Figure 3.2 illustrates the spread of appointments made between departments. Where the appointments were made by Ministers, 164 of these were reappointments, and 412 were new appointments. For appointments to chair roles made by Ministers, 15 were reappointments and 61 were new appointments.
3.2 Public appointments made by department in 2020/21
| Department | Total - new appointments 2020 / 2021 | Total - reappointments 2020 / 2021 | Total 2020 / 2021 |
|---|---|---|---|
| All Departments | 412 | 164 | 576 |
| Attorney General's Office | 1 | 0 | 1 |
| Export Credits Guarantee Department (UK Export Finance) | 0 | 0 | 0 |
| Scotland Office | 1 | 0 | 1 |
| HM Treasury | 1 | 1 | 2 |
| Department for Work and Pensions | 4 | 1 | 5 |
| Foreign, Commonwealth and Development Office | 5 | 0 | 5 |
| Cabinet Office | 13 | 0 | 13 |
| Northern Ireland Office | 13 | 0 | 13 |
| Ministry of Housing, Communities and Local Government | 7 | 9 | 16 |
| Department of Business, Energy and Industrial Strategy | 17 | 6 | 23 |
| Department for Transport | 7 | 18 | 25 |
| Department for Education | 17 | 12 | 29 |
| Home Office | 20 | 15 | 35 |
| Department for the Environment, Food and Rural Affairs | 47 | 24 | 71 |
| Department for Digital, Culture, Media and Sport | 40 | 42 | 82 |
| Ministry of Defence | 144 | 7 | 151 |
| Department of Health and Social Care - non-delegated | 55 | 19 | 74 |
| Department of Health and Social Care - delegated | 38 | 77 | 115 |
| Department of Health and Social Care | 55 | 19 | 74 |
| Ministry of Justice - non-delegated | 20 | 10 | 30 |
| Ministry of Justice - delegated | 216 | 532 | 748 |
| Ministry of Justice | 20 | 10 | 30 |
4. Gender Analysis
Public appointees as at 31 March 2021
46% (1,794) of serving public appointees were women, compared to 44% in March 2020. Figure 4.1 shows the percentage of female public appointees over recent years with comparisons to other sectors of the employment market.
4.1 Percentage of female public appointees compared to other sectors 2017-2021
| Metric | 2017 | 2018 | 2019 | 2020 | 2021 |
|---|---|---|---|---|---|
| Public appointees | 43% | 43% | 44% | 44% | 46% |
| FTSE 100 board members | 28% | 30% | 32% | 36% | 36% |
| Economically active population | 47% | 47% | 47% | 48% | 48% |
| Senior Civil Service | 42% | 43% | 45% | 47% | Data not available |
Public appointees by department
The percentage of female public appointees varies by department as illustrated in figure 4.2.
4.2 Percentage of female appointees by department 2019-2021
| Department for the Graph | 2019 | 2020 | 2021 |
|---|---|---|---|
| All departments | 44% | 44% | 46% |
| Attorney General's Office * | |||
| Cabinet Office | 36% | 42% | 49% |
| Department for Business, Energy & Industrial Strategy | 35% | 36% | 39% |
| Department for Digital, Culture, Media and Sport | 43% | 46% | 44% |
| Department for Education | 45% | 46% | 49% |
| Department for the Environment, Food and Rural Affairs | 33% | 33% | 36% |
| Department for Transport | 27% | 29% | 33% |
| Department for Work and Pensions | 36% | 35% | 36% |
| Department of Health and Social Care - all appointments | 39% | 41% | 43% |
| Department of Health and Social Care - non-delegated | 39% | 38% | 39% |
| Department of Health and Social Care - delegated | 39% | 42% | 44% |
| Export Credits Guarantee Department (UK Export Finance) * | |||
| Foreign, Commonwealth and Development Office | 41% | ||
| HM Treasury | 35% | 53% | 56% |
| Home Office | 41% | 45% | 43% |
| Ministry of Defence | 23% | 24% | 22% |
| Ministry of Housing, Communities and Local Government | 41% | 41% | 39% |
| Ministry of Justice - all appointments | 54% | 54% | 55% |
| Ministry of Justice - non-delegated | 60% | 55% | 60% |
| Ministry of Justice - delegated | 51% | 53% | 53% |
| Northern Ireland Office | 50% | 61% | 57% |
| Scotland Office * | |||
- values relating to fewer than 5 responses have been removed
Proportion of public appointees: Chairs and members
Overall, the proportion of women board members is 48% compared to 46% in 2020 and 45% in 2019. The proportion of Chair or Chair equivalent roles filled by women is 33% compared to 29% in 2020 and 28% in 2019 (figure 4.3).
4.3 Percentage of female board members and chairs 2019-2021
| Metric | 2019 | 2020 | 2021 |
|---|---|---|---|
| Board Members | 45% | 46% | 48% |
| Chairs | 28% | 29% | 33% |
| All appointees | 44% | 44% | 46% |
Proportion of public appointees: Delegated and non-delegated roles
In posts where the responsibility for appointment has been delegated by Ministers, 51% of appointments were held by women compared to 49% in 2020. Whilst for those where the appointments are made directly by Ministers, 43% were held by women compared to 41% in 2020 (figure 4.4).
4.4 Percentage of female appointees in roles where ministers have delegated responsibility for appointments, 2019, 2020 and 2021
| Department / Group | 2021 | 2019 | 2020 |
|---|---|---|---|
| All non-delegated appointees | 43% | 42% | 41% |
| All delegated appointeees | 51% | 47% | 49% |
| Department of health and Social Care - delegated | 44% | 51% | 42% |
| Ministry of Justice - Delegated | 53% | 39% | 53% |
Appointments made during 2020/21
The proportion of new appointments and reappointments made by UK Government Ministers in 2020/21 to women was 44% compared to 52% in 2019/20 and 43% in 2018/19. The breakdown by departments is shown in figure 4.5.
For new appointments and reappointments where the appointing responsibility has been delegated by Ministers, 53% of appointments in 2020/21 were made to women, the same as in 2019/20. In 2018/19, it was 46%. Whilst for appointments made directly by Ministers, 36% were to women compared to 50% in 2019/20.
4.5 Percentage of female appointments made in 2020/21 by departments
| Department | Percentage new and reappointments made to females 2020/21 | Percentage of reappointments made to females 2020/21 | Percentage of new appointments made to females 2020/21 |
|---|---|---|---|
| All Departments | 44% | 48% | 41% |
| Attorney General's Office * | |||
| Export Credits Guarantee Department (UK Export Finance) * | |||
| Scotland Office * | |||
| HM Treasury * | |||
| Department for Work and Pensions * | |||
| Foreign, Commonwealth and Development Office * | |||
| Cabinet Office * | |||
| Ministry of Housing, Communities and Local Government * | |||
| Northern Ireland Office | 46% | 0 | 46% |
| Department of Business, Energy and Industrial Strategy | 41% | 67% | 36% |
| Department for Transport | 52% | 50% | 57% |
| Department for Education | 41% | 33% | 47% |
| Home Office | 40% | 30% | 45% |
| Department for the Environment, Food and Rural Affairs | 46% | 42% | 49% |
| Department for Digital, Culture, Media and Sport | 39% | 43% | 35% |
| Ministry of Defence | 20% | 0% | 21% |
| Department of Health and Social Care - non-delegated | 40% | 33% | 42% |
| Department of Health and Social Care - delegated | 42% | 42% | 43% |
| Department of Health and Social Care | 41% | 40% | 42% |
| Ministry of Justice - non-delegated | 41% | 44% | 40% |
| Ministry of Justice - delegated | 56% | 54% | 61% |
| Ministry of Justice | 55% | 54% | 57% |
- values relating to fewer than 5 responses have been removed
5. Ethnic background analysis
Public appointees as at 31 March 2021
11% of public appointees were from an ethnic minority background compared to 9% (278) in 2019/20 and 2018/19, (figure 5.1). This includes individuals from all groups other than white ethnic minority groups (Indian, Pakistani, Bangladeshi, Chinese, African, Caribbean, other and mixed ethnic groups).
5.1 Public appointees from an ethnic minority background compared to other sectors
| Metric | 2017 | 2018 | 2019 | 2020 | 2021 |
|---|---|---|---|---|---|
| Public Appointees | 10% | 10% | 9% | 9% | 11% |
| Economically active population | 13% | 12% | 13% | 13% | 13% |
| Senior Civil Service | 5% | 6% | 6% | 7% | Data not available |
Public appointees by department
Chart 5.2 shows the percentage of appointees from an ethnic minority background by department.
5.2 Percentage of appointees from ethnic minority backgrounds by department at 31 March 2019, 2020 and 2021
| Department | Percentage Ethnic Minority (does not include prefer not to say or data not held) 2021 | Percentage Ethnic Minority (does not include prefer not to say or data not held) 2020 | Percentage Ethnic Minority (does not include prefer not to say or data not held) 2019 |
|---|---|---|---|
| All Departments | 11% | 9% | 9% |
| Ministry of Justice | 9% | 9% | 8% |
| Ministry of Justice - delegated | 7% | 8% | 6% |
| Ministry of Justice - non-delegated | 16% | 14% | 11% |
| Department of Health and Social Care | 16% | 14% | 15% |
| Department of Health and Social Care - delegated | 17% | 14% | 13% |
| Department of Health and Social Care - non-delegated | 14% | 12% | 20% |
| Department for Digital, Culture, Media and Sport | 15% | 10% | 13% |
| Department for Education | 21% | 15% | 13% |
| Ministry of Defence | 4% | 3% | |
| Department for Business, Energy & Industrial Strategy | 6% | 3% | 6% |
| Home Office | 8% | 9% | 11% |
| Cabinet Office | 11% | 4% | |
| Department for Work and Pensions | 8% | 5% | 9% |
| Foreign, Commonwealth and Development Office | 19% | ||
| Department for the Environment, Food and Rural Affairs | 2% | 3% | |
| Department for Transport | 6% | 4% | |
| HM Treasury * | 11% | ||
| Ministry of Housing, Communities and Local Government * | 7% | ||
| Export Credits Guarantee Department (UK Export Finance) * | 0% | ||
| Northern Ireland Office * | 3% | ||
| Attorney General's Office * | 0% | ||
| Scotland Office * | 0% |
- values relating to fewer than 5 responses have been removed
Proportion of public appointees: Chairs and members
The proportion of appointee members from an ethnic minority background is 11% compared to 9% at 31 March 2020 and 10% at 31 March 2019. The proportion of appointees from an ethnic minority background in Chair or Chair equivalent roles is 8% compared to 4% at 31 March 2020 and 5% at 31 March 2019.
5.3 Percentage of board members and chairs from ethnic minority backgrounds 2019-2021
| Metric | 2021 | 2020 | 2019 |
|---|---|---|---|
| All Appointees | 11% | 9% | 9% |
| Chairs | 8% | 4% | 5% |
| Board Members | 11% | 9% | 10% |
Proportion of public appointees: Delegated and non-delegated roles
For posts where the responsibility for appointment has been delegated by Ministers, 10% of appointees were from an ethnic minority background compares to 10% of appointees in post on 31 March 2020 and 9% in post on 31 March 2019. For those where the appointments are made directly by Ministers, 11% are from an ethnic minority background compared to 9% in post on the 31 March 2020 and 10% in post on 31 March 2019.
5.4 Percentage of appointees from ethnic minority backgrounds in roles where ministers have delegated responsibility for appointments 2019-2021
| Metric | 2021 | 2020 | 2019 |
|---|---|---|---|
| Department of health and Social Care delegated appointees | 17% | 14% | 13% |
| Ministry of Justice delegated appointees | 7% | 8% | 6% |
| All delegated appointees | 10% | 10% | 9% |
| All non-delegated appointees | 11% | 9% | 10% |
Appointments made during 2020/21
The proportion of new appointments and reappointments made by UK Government Ministers in 2020/21 to people from an ethnic minority background was 10% compared to 16% in 2019/20 and 13% in 2018/19. The breakdown by department is shown in figure 5.5.
5.5 Percentage of appointments made to candidates from an ethnic minority background in 2020/21 by department
| Department | Percentage of new and reappointments made to candidates from an ethnic minority background 2020/21 | Percentage of reappointments made to candidates from an ethnic minority background 2020/21 | Percentage of new appointments made to candidates from an ethnic minority background 2020/21 |
|---|---|---|---|
| All Departments | 10% | 8% | 12% |
| Attorney General's Office * | |||
| Export Credits Guarantee Department (UK Export Finance) * | |||
| Scotland Office * | |||
| HM Treasury * | |||
| Department for Work and Pensions * | |||
| Foreign, Commonwealth and Development Office * | |||
| Northern Ireland Office * | |||
| Cabinet Office * | |||
| Ministry of Housing, Communities and Local Government * | |||
| Department of Business, Energy and Industrial Strategy * | |||
| Department for Transport * | |||
| Department for Education * | |||
| Home Office * | |||
| Department for the Environment, Food and Rural Affairs * | |||
| Department for Digital, Culture, Media and Sport | 20% | 13% | 28% |
| Ministry of Defence * | |||
| Department of Health and Social Care - non-delegated | 20% | 28% | 17% |
| Department of Health and Social Care - delegated | 20% | 12% | 37% |
| Department of Health and Social Care | 20% | 15% | 25% |
| Ministry of Justice - non-delegated * | |||
| Ministry of Justice - delegated | 8% | 6% | 12% |
| Ministry of Justice | 8% | 6% | 12% |
- values relating to fewer than 5 responses have been removed.
For posts where the appointing responsibility has been delegated by Ministers, 11% of appointments were made to candidates from an ethnic minority background in 2020/21 compared to 17% in 2019/20 and 14% in 2018/19. For those where the appointments are made directly by Ministers, 10% were made to candidates from an ethnic minority background compared to 15% in 2019/20 and 11% in 2018/19.
6. Disability analysis
Public appointees as at 31 March 2021
8% of public appointees at 31 March 2021 reported having a disability using the single stage question compared to 10% on the 31 March 2020. 8% of public appointments as at 31 March 2021 reported having one or more physical or mental health conditions or illnesses lasting or expecting to last 12 months or more using the two stage question compared to 7% as at 31st March 2020.
6.1 Percentage of public appointees with a disability
| Metric | 31st March 2021 | 31st March 2020 |
|---|---|---|
| Single stage question reported having a disability | 8% | 10% |
| Two stage question reported having a disability | 8% | 7% |
| Non-specific question format | 6% |
Proportion of public appointees: Chairs and members
For those who answered the single stage question, the proportion of Chairs who reported having a disability was 6% compared to 7% as at 31 March 2020 and the proportion of members who reported having a disability was 8% compared to 11% as at 31 March 2020. For those who answered the two stage question, the proportion of members who reported having a disability was 9% compared to 7% as at 31st March 2020, the proportion of Chairs answering the question is too low to report. As shown in figure 6.2.
6.2 Percentage of board members and chairs with a disability reported using each question, 2021
| Metric | Chairs who identified as disabled using the single stage question | Chairs who identified as disabled using the two stage question * | Members who identified as disabled using the single stage question | Members who identified as disabled using the two stage question |
|---|---|---|---|---|
| 31st March 2021 | 6% | 8% | 9% | |
| 31st March 2020 | 7% | 11% | 7% |
- values relating to fewer than 5 responses have been removed.
Proportion of public appointees: Delegated and non-delegated roles
The percentage of current appointees who reported having a disability using the single stage question in roles where appointments were made directly by Ministers was 8% compared to 9% as of 31 March 2020. For posts where the appointing authority has been delegated by Ministers, the proportion of appointees who reported having a disability using the single stage question was also 8% compared to 12% as of 31 March 2020.
The percentage of current appointees who reported having a disability using the two stage question in roles where appointments were made directly by Ministers was 8% compared to 7% as of 31 March 2020. For posts where the appointing authority has been delegated by Ministers the percentage of current appointees who reported having a disability using the two stage question was 15%.
6.3 Percentage of appointees with a disability in roles where ministers have delegated responsibility for appointments reported using each question, 2021
| Metric | Percentage chair and members who are disabled single stage question no prefer not to say | Percentage Chairs and Members who are disabled two stage question no prefer not to say |
|---|---|---|
| Delegated | 8% | 15% |
| Non-delegated. | 8% | 8% |
| Grand Total | 8% | 8% |
Appointments made during 2020/21
The proportion of new appointments and reappointments made by Ministers in 2020/21 to people who reported having a disability using the single stage question was 13% compared to 4% in 2019/20. For roles where the appointing authority has been delegated by Ministers, the proportion of new appointments and reappointments made to people reporting having a disability using the single stage question was 9% as in 2019/20. The proportion of new appointments and reappointments made by Ministers in 2020/21 to people who reported having a disability using the two stage question was 5%. For delegated roles, no data was provided using the two stage question.
7. Analysis of other factors
Regional distribution
The regions with the highest proportion of serving public appointees are London and the South East. These figures reflect where appointees currently live, rather than their place of origin. 39% of all public appointees declared their primary residence as being in one of these two regions. This compares with 43% on 31 March 2020. Figure 7.1 illustrates the regional distribution of serving public appointees alongside the economically active population.
7.1 Regional distribution of current appointees at 31 March 2021 compared to ONS Economically Active Population. Note - The economically active population is the term used by the Office for National Statistics to describe the population who are working, have sought work in the last four weeks and/or are available to start work in the next two weeks.
| Regions | All appointments at 31st March 2021 | 2021 non-delegated roles | 2021 delegated roles | Office for National Statistics Percentage Economically Active |
|---|---|---|---|---|
| London | 22% | 25% | 19% | 15% |
| South East | 17% | 20% | 15% | 14% |
| West Midlands | 9% | 5% | 12% | 9% |
| South West | 9% | 9% | 8% | 8% |
| East Midlands | 7% | 6% | 9% | 7% |
| North West | 9% | 7% | 11% | 11% |
| Yorkshire and Humberside | 8% | 7% | 9% | 8% |
| East | 8% | 6% | 9% | 9% |
| North East | 4% | 3% | 4% | 4% |
| Wales | 3% | 3% | 3% | 5% |
| Northern Ireland | 2% | 3% | 0% | 3% |
| Scotland | 3% | 5% | 1% | 8% |
7.2 Regional distribution of current appointees at 31 March 2021 and 2020 – by department
| Department | Percentage incumbents from England - London and South East | Percentage incumbents from England - Other Regions | Percentage incumbents from Scotland, Wales and Northern Ireland | |||
|---|---|---|---|---|---|---|
| 2021 | 2020 | 2021 | 2020 | 2021 | 2020 | |
| Attorney General's Office | * | * | * | * | * | * |
| Cabinet Office | 63% | 59% | 31% | 29% | * | 12% |
| Department for Business, Energy and Industrial Strategy | 50% | 47% | 38% | 38% | 12% | 13% |
| Department for Digital, Culture, Media and Sport | 63% | 67% | 29% | 24% | 7% | 7% |
| Department for Education | 51% | 52% | 43% | 43% | 6% | 5% |
| Department for the Environment, Food and Rural Affairs | 36% | 39% | 60% | 56% | 4% | 5% |
| Department for Transport | 46% | 46% | 25% | 29% | 29% | 25% |
| Department for Work and Pensions | 55% | 52% | 35% | 35% | 9% | 13% |
| Department of Health and Social Care | 39% | 40% | 58% | 58% | 3% | 2% |
| Export Credits Guarantee Department (UK Export Finance) | * | * | * | * | * | * |
| Foreign, Commonwealth & Development Office | 43% | 82% | 43% | * | * | * |
| HM Treasury | 65% | 67% | 32% | 33% | * | 0% |
| Home Office | 47% | 50% | 37% | 35% | 17% | 15% |
| Ministry of Defence | 24% | 25% | 52% | 50% | 24% | 25% |
| Ministry of Housing, Communities and Local Government | 61% | 58% | 36% | 40% | * | * |
| Ministry of Justice | 33% | 35% | 61% | 59% | 6% | 6% |
| Northern Ireland Office | * | 0% | * | 0% | * | * |
| Scotland Office | * | No data | * | No data | * | No data |
| Grand Total | 39% | 43% | 52% | 49% | 8% | 8% |
| ONS Economically Active | 29% | 29% | 56% | 56% | 16% | 15% |
- values relating to fewer than 5 responses have been removed
7.3 Regional distribution of appointments made in 2020/21 compared to ONS Economically Active Population
| Region | 2020/21 New and Reappointments | 2019/20 New and Reappointments | ONS Economically Active Population |
|---|---|---|---|
| North East | 5% | 4% | 4% |
| North West | 10% | 12% | 11% |
| Yorkshire and Humberside | 8% | 9% | 8% |
| East Midlands | 8% | 6% | 7% |
| West Midlands | 7% | 11% | 9% |
| East | 8% | 9% | 9% |
| London | 18% | 16% | 15% |
| South East | 18% | 19% | 14% |
| South West | 7% | 8% | 8% |
| Wales | 4% | 3% | 5% |
| Scotland | 4% | 1% | 8% |
| Northern Ireland | 2% | 2% | 3% |
| Other Residence * | 0% | 0% |
- values relating to fewer than 5 responses have been removed.
Career background - appointments made in 2020/21
66% of individuals who were appointed or reappointed in 2020/21 provided information on their career background compared to 71% in 2019/20. Of these, 5% mostly worked in the civil service, 31% mostly worked in the private sector, 6% mostly worked in the third sector, 36% mostly worked in the wider public sector, 20% worked in a mix of sectors and 2% worked in another type of sector.
7.4 Percentage of new and reappointments made in 2020/21 by career background
| Metric | Mostly Civil Service | Mostly Private Sector | Mostly Third Sector | Mostly wider Public Sector | Mixed | Other Principal Employment |
|---|---|---|---|---|---|---|
| Pecentage New and Reappointments made in 2020/21 | 5% | 31% | 6% | 36% | 20% | 2% |
Age – current public appointees
70% of serving appointees are aged 55 years and over (figure 7.5) compared to 73% in 2019/20 and 2018/19.
7.5 Snapshot of current chairs and members (appointees) by age
| Year | 16 to 24 | 25 to 34 | 35 to 44 | 45 to 54 | 55 to 64 | 65 to 74 | 75 to 84 | 85+ |
|---|---|---|---|---|---|---|---|---|
| 31st March 2021 | 1% | 3% | 7% | 19% | 38% | 28% | 4% | |
| 31st March 2020 | 0.3% | 1% | 6% | 20% | 42% | 28% | 3% | |
| 31st March 2019 | 1% | 2% | 7% | 18% | 38% | 31% | 4% |
Age – appointments made in 2020/21
83% of all appointments in 2020/21 went to candidates aged 55 years and over (figure 7.6). This compares with 61% in 2019/20 and 60% in 2018/19.
7.6 Age distribution of new and reappointments made during 2019/20
| Year | 16-24 | 25-34 | 35-44 | 45-54 | 55-64 | 65-74 | 75-84 | 85+ |
|---|---|---|---|---|---|---|---|---|
| 2020 2021 | 3% | 5% | 9% | 48% | 32% | 3% |
Sexual Orientation – current public appointees
68% of serving appointees provided information on their sexual orientation compared to 57% of appointees in post as of 31 March 2020. Of these, 95% are heterosexual and 4% are lesbian, gay, bisexual or ‘other’ (LGBO). This compares to 95% are heterosexual and 5% are lesbian, gay, bisexual or ‘other’ (LGBO) as of 31 March 2020. As shown in figure 7.7.
7.7 Sexual orientation of current appointees as at 31 March 2021
| Metric | 31st March 2021 | 31st March 2020 | 31st March 2019 |
|---|---|---|---|
| Heterosexual | 95% | 95% | 96% |
| Lesbian, gay, bisexual or other | 4% | 5% | 4% |
NB: Percentages may not add up to 100% due to rounding
Sexual Orientation – appointments made in 2020/21
65% of individuals who were appointed or reappointed in 2020/21 provided information on their sexual orientation compared to 70% in 2019/20. Of these 95% are heterosexual and 5% are lesbian, gay, bisexual or ‘other’, as in 2019/20 (figure 7.8).
7.8 Percentage of new and reappointments made in 2020/21 by sexual orientation
| Metric | 2020/21 | 2019/20 | 2018/19 |
|---|---|---|---|
| Hetrosexual | 95% | 95% | 94% |
| Lesbian, gay, bisexual or other | 5% | 5% | 6% |
Religion - current public appointees
64% of serving appointees provided information on their religion compared to 42% as of 31 March 2020. Of these, 0% are Buddhist, 56% are Christian, 1% are Hindu, 3% are Jewish, 2% are Muslim, 1% are Sikh, 2% are another religion and 35% have no religion. Compared to 2% are Buddhist, 75% are Christian, 2% are Hindu, 4% are Jewish, 2% are Muslim, 1% are Sikh, 2% are another religion and 12% have no religion as of 31 March 2020.
7.9 Religion of current appointees as at 31 March 2021
| Metric | 31st March 2021 | 31st March 2020 |
|---|---|---|
| Chair and Member Who Are: Atheist / No Religion | 35% | 12% |
| Chair and Member Who Are: Other Religion | 2% | 2% |
| Chair and Member Who Are: Sikh | 1% | 1% |
| Chair and Member Who Are: Muslim | 2% | 2% |
| Chair and Member Who Are: Jewish | 3% | 4% |
| Chair and Member Who Are: Hindu | 1% | 2% |
| Chair and Member Who Are: Christian | 56% | 75% |
| Chair and Member Who Are: Buddhist | 0.2% | 2% |
Religion - appointments made in 2020/21
65% of individuals who were appointed or reappointed in 2020/21 provided information on their religion compared to 70% in 2019/20. Of these, 0% are Buddhist, 58% are Christian, 2% are Hindu, 1% are Jewish, 2% are Muslim, 1% are Sikh, 1% are another religion and 35% have no religion. Compared to 0% are Buddhist, 55% are Christian, 1% are Hindu, 2% are Jewish, 3% are Muslim, 1% are Sikh, 2% are another religion and 36% have no religion in 2019/20.
7.10 Percentage of new and reappointments made in 2020/21 by religion
| Metric | Buddhist * | Christian | Hindu | Jewish | Muslim | Sikh | Other Religion | Atheist / No Religion |
|---|---|---|---|---|---|---|---|---|
| Pecentage | 58% | 2% | 1% | 2% | 1% | 1% | 35% |
- values relating to fewer than 5 responses have been removed.
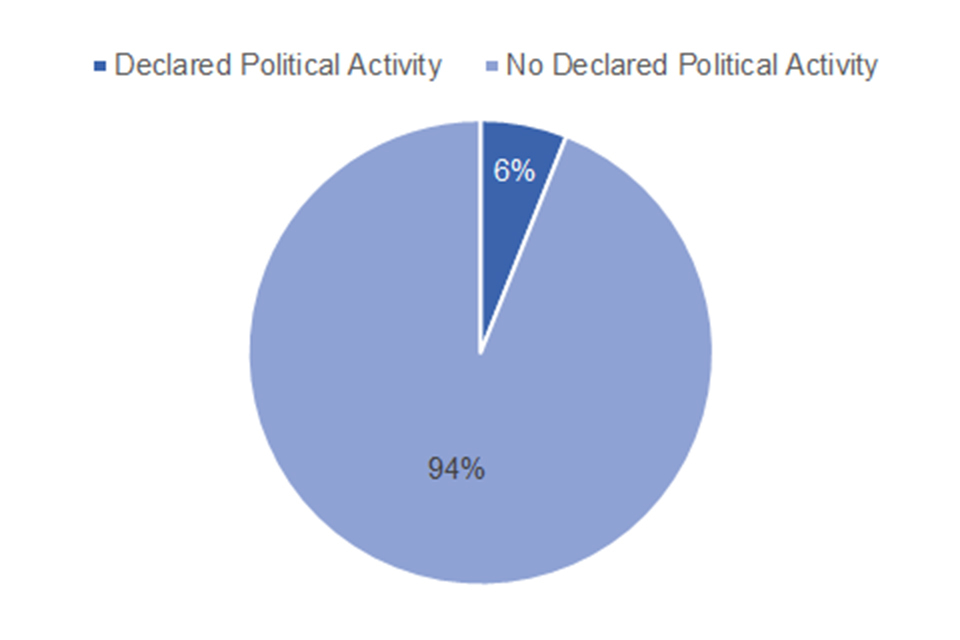
Political activity
71% of individuals who were appointed or reappointed in 2020/21 provided this data compared to 74% in 2019/20. Of these, 6% (61) stated that they had taken part in significant political activity in the past five years, the same as in 2019/20.
Significant political activity is defined as being employed by a political party, holding significant office in a party, standing as a candidate for a party in an election, having publicly spoken on behalf of a political party or having made significant donations or loans to a party. Significant loans and donations are those of a size which are reported to the Electoral Commission, in line with a central party’s reporting threshold.
Of the 6% who responded positively to this question, 52% stated that this was on behalf of the Conservative party and 23% on behalf of the Labour party. Compared to 38% and 39% respectively in 2019/20. Please note that an individual can be politically active for more than one party.
7.11 Proportion by political party of the 6% of people appointed who declared some significant political activity. NB: An individual can be politically active for more than one party.
| Conservative | Green * | Labour | Liberal Democrats | Plaid Cymru | Scottish National Party | Democratic Unionist Party | Sinn Fein * | Social Democratic and Labour Party | Any other parties * |
|---|---|---|---|---|---|---|---|---|---|
| 52% | 23% | 15% | 0% | 0% | 0% | 0% |
- values relating to fewer than 5 responses have been removed.
8. Progression through the recruitment stages
In this report we are including, for the first time, a breakdown of the success rates of different groups of applicants at different stages of the recruitment process. In this analysis, we can only include campaigns where data has been provided at all stages (221 campaigns out of 254), so the figures here may not be consistent with those in other parts of this report.
8.1 Success rates of different groups through the recruitment stages
| Applied | Applied to shortlisted | Shortlisted to found appointable | Found appointable to appointed | Applied to appointed | |
|---|---|---|---|---|---|
| Female | 35% | 24% | 58% | 59% | 8% |
| Male | 64% | 18% | 57% | 64% | 7% |
| Ethnic minority | 21% | 14% | 52% | 53% | 4% |
| White | 79% | 22% | 59% | 61% | 8% |
| Disabled (single stage question) | 8% | 26% | 59% | 90% | 14% |
| Not disabled (single stage question) | 92% | 22% | 67% | 63% | 9% |
| Disabled (two stage question) | 5% | 13% | 60% | 42% | 3% |
| Not disabled (two stage question) | 95% | 14% | 55% | 45% | 3% |
9. Sources
Cabinet Office SCS database, Cabinet Office - The official headline figures used for monitoring diversity of the Senior Civil Service is sourced from the Cabinet Office diversity and inclusion dashboard that collects comprehensive information on those individuals that make up the Senior Civil Service. Data for the period covered in this report were not available at time of publication.
Hampton-Alexander Review provides benchmark data on women on FTSE100 Boards. January 2021 highlights are available here: https://ftsewomenleaders.com/
UK Labour Market statistics, ONS - Data for the economically active populations (aged 16-64) are taken from ONS Labour Markets Statistics published September 2021. Data on employment and employee types can be found here. Labour Market Status by ethnic group can be found here. Regional labour market data are here. Data used in this report are March-May 2021.
-
Data for the Department of International Development and the Foreign and Commonwealth Office are shown as the Foreign, Commonwealth and Development Office as the two bodies merged on 2 September 2020. ↩
-
This terminology is being revised as part of the move to a new online service for public appointments. The language used throughout this report is consistent with that used at the time of data collection. ↩