Public Appointments Data Report 2018/19
Published 22 July 2020

© Crown copyright 2020
This publication is licensed under the terms of the Open Government Licence v3.0 except where otherwise stated. To view this licence, visit nationalarchives.gov.uk/doc/open-government-licence/version/3 or write to the Information Policy Team, The National Archives, Kew, London TW9 4DU, or email: psi@nationalarchives.gov.uk.
Where we have identified any third party copyright information you will need to obtain permission from the copyright holders concerned.
This publication is available at https://www.gov.uk/government/publications/public-appointments-data-report-201819/public-appointments-data-report-201819
1. Introduction
Each year, the Government typically makes over 1,000 public appointments to the boards of some 550 public bodies. These organisations collectively spend over £200 billion a year and range across all aspects of public life, from reducing fuel poverty to building our motorways. Public bodies deliver vital services and enrich our culture and communities through organisations such as National Health Service Trusts, British Museum and the Big Lottery Fund.
Public appointees provide direction and leadership to these public bodies, holding senior staff to account and providing expert, independent advice. There is no standard definition of a public appointment but typically the appointment will be for a chair or non-executive director on a board of a public body or for a member of an advisory committee.
Public appointees therefore have an impact on every area of society. This is why it is important that they are drawn from all parts of the society that they serve. To help achieve this goal the Government published a refreshed public appointments diversity action plan (DAP) in June 2019. The actions within this plan will enable the Government to better understand the issues, improve the diversity data we hold for public appointees and pinpoint effective approaches to increasing diversity across the board. The plan also restated the Government’s ambitions that, by 2022, 50% of appointees should be women and 14% of appointments made should be to those from ethnic minority backgrounds. The plan will be kept under review to incorporate the learning as the actions are implemented.
The data in this report cover public appointments made by United Kingdom Government Ministers to bodies and offices listed in the Public Appointments Order in Council (pdf, 549 KB). These appointments are regulated by the Commissioner for Public Appointments and are therefore referred to as regulated roles. This year, for the first time, the report includes data collected during the appointments process as well as data on existing appointees.
The Commissioner for Public Appointments also publishes data collected on appointments and reappointments in his annual report. The Commissioner’s report includes appointments made by Ministers in the Welsh Government as well as UK Government Ministers, a reflection of the Commissioner’s remit. For this reason, the data on in-year appointments in this report differ from that in the Commissioner’s report.
2. Response rates and sample sizes
The primary data in this report are based on information collected from departments by the Cabinet Office. Some of this is presented alongside other official statistics and data published by third party sources (see section 8).
It is important to note that:
- values relating to diversity characteristics based on fewer than five responses are not shown in this report to protect individuals’ confidentiality and because the numbers are too small to draw reliable conclusions. However these figures are included in totals;
- the response rate varies between diversity characteristics (see table 2.1). The response rate includes those who chose an option including those who chose ‘prefer not to say’. The response rate does not include those who did not provide any information for that particular characteristic;
- percentage breakdowns for diversity only include responses that provided information about a given characteristic, e.g. the total gender sample excludes those who did not provide this data or who chose the ‘prefer not to say’ option.
2.1 Response rates for gender, ethnicity and disability, including respondents who selected ‘prefer not to say’
| Serving appointees | Reappointments made in 18/19 | New appointments made in 18/19 | Total - new and reappointments made in 18/19 | |
|---|---|---|---|---|
| Gender | 72% | 63% | 85% | 74% |
| Ethnicity | 71% | 62% | 85% | 74% |
| Disability | 69% | 62% | 84% | 73% |
3. Total number of appointees
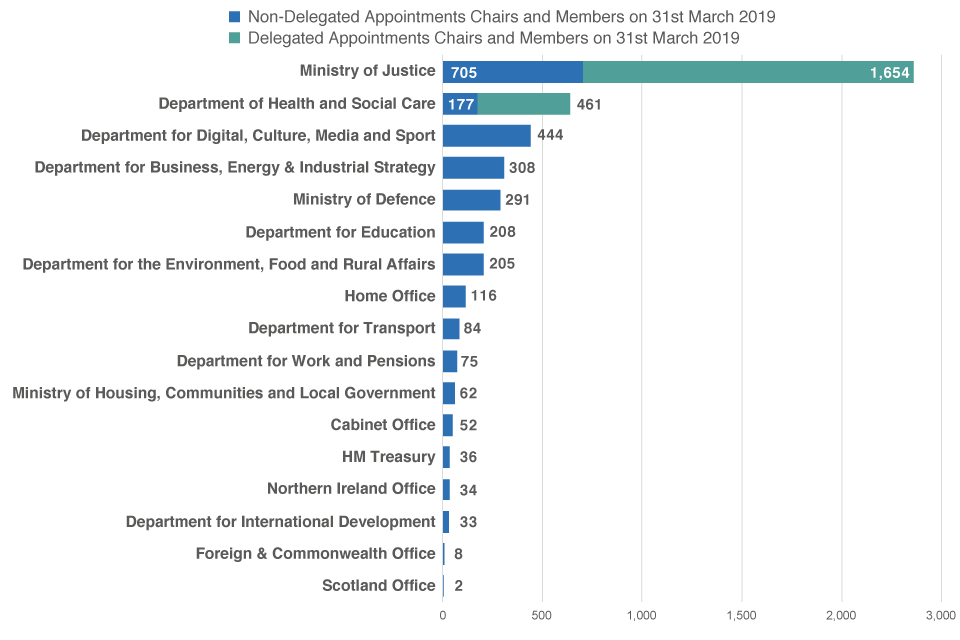
The data show that, on 31 March 2019, there were 4,955 public appointees in regulated roles who were appointed by UK Government Ministers. Of these, 57% (2,840) were in roles where the appointments were made directly by UK Government Ministers and 43% (2,115) were made to bodies where the appointing authority has been delegated by Ministers.
Delegated roles include Ministry of Justice appointments made to Advisory Committees on Justices of the Peace, Independent Monitoring Boards of any prison or young offender institutions, including national chair and Prisoner Escort and Custody Services lay observers; and DHSC roles made to NHS Trust appointments. The responsibility for these appointments was delegated by Ministers because of the volume and local nature of these roles, but Ministers remain accountable for them.
Figure 3.1 illustrates the spread of existing appointees between departments.
3.1 Total number of public appointments on 31st March 2019
3.2 Appointments made in 2018/19
1,698 public appointments were made between 1 April 2018 and 31 March 2019. These consisted of 896 (53%) new appointments and 802 (47%) reappointments. Figure 3.2 illustrates the spread of appointments made between departments.
3.3 Public appointments made by department in 2018/19
| Department | Total | Total – reappointments | Total – new appointments |
|---|---|---|---|
| Ministry of Justice – non-delegated | 176 | 103 | 73 |
| Ministry of Justice – delegated | 745 | 372 | 373 |
| Department of Health and Social Care – non-delegated | 70 | 31 | 39 |
| Department of Health and Social Care – delegated | 232 | 162 | 70 |
| Department for Digital, Culture, Media and Sport | 137 | 46 | 91 |
| Department for Business, Energy & Industrial Strategy | 77 | 33 | 44 |
| Ministry of Defence | 94 | 27 | 67 |
| Department for Education | 38 | 0 | 38 |
| Department for the Environment, Food and Rural Affairs | 37 | 11 | 26 |
| Home Office | 15 | 0 | 15 |
| Department for Transport | 8 | 1 | 7 |
| Department for Work and Pensions | 22 | 4 | 18 |
| Ministry of Housing, Communities and Local Government | 21 | 5 | 16 |
| Cabinet Office | 6 | 0 | 6 |
| HM Treasury | 11 | 6 | 5 |
| Northern Ireland Office | 2 | 1 | 1 |
| Department for International Development | 4 | 0 | 4 |
| Foreign & Commonwealth Office | 3 | 0 | 3 |
| Scotland Office | 0 | 0 | 0 |
4. Gender analysis
4.1 Public appointees as at 31 March 2019
44% (1,543) of serving public appointees were women. In 2018, the figure was 43%. Figure 4.1 shows the percentage of female public appointees over the last few years with comparisons to other sectors of the employment market.
4.2 Percentage of female public appointees compared to other sectors 2017-1019
| Sector | 2017 | 2018 | 2019 |
|---|---|---|---|
| Public appointees | 43% | 43% | 44% |
| FTSE 100 board members | 28% | 30% | 32% |
| FTSE 100 NEDS | 33% | 37% | 39% |
| Economically active population [footnote 1] | 47% | 47% | 47% |
| Senior Civil Service | 42% | 43% | 45% |
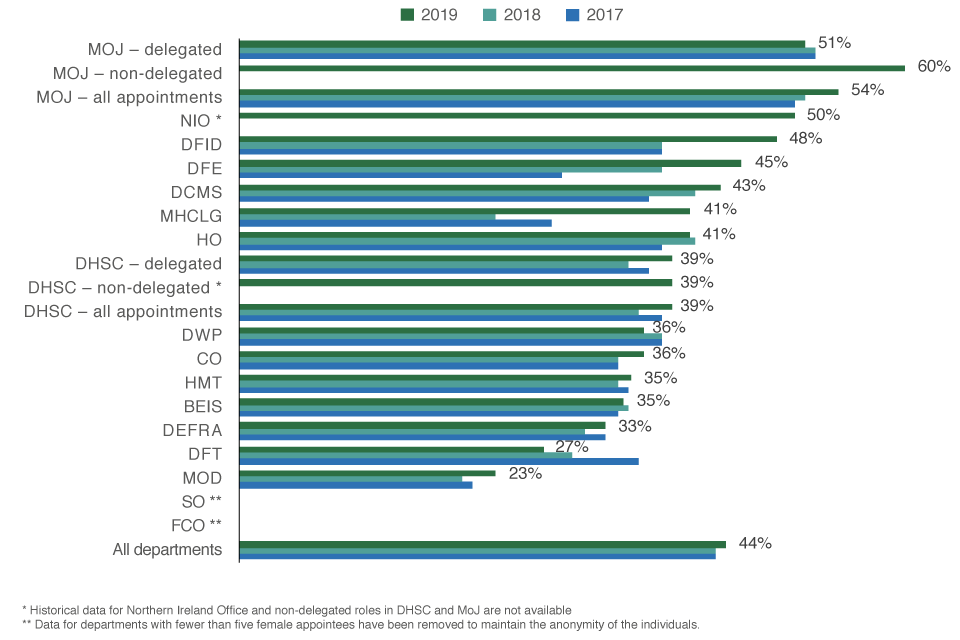
4.3 Public appointees by department
The percentage of female public appointees varies by department as illustrated in figure 4.2.
4.4 Percentage of female appointees by department 2017-2019
4.5 Proportion of public appointees: Chairs and members
Overall, the proportion of women Board members is 45% compared to 44% in 2018. The proportion of Chair or Chair equivalent roles filled by women has reduced by 3 percentage points since 2018, to 28% (figure 4.3).
4.6 Percentage of female board members and chairs 2017-2019
| Appointees | 2017 | 2018 | 2019 |
|---|---|---|---|
| All appointees | 43% | 43% | 44% |
| Chairs | 30% | 31% | 28% |
| Board Members | 44% | 44% | 45% |
4.7 Proportion of public appointees: Delegated and non-delegated roles
In posts where the responsibility for appointment has been delegated by Ministers, 47% of appointees are women, whilst for those where the appointments are made directly by Ministers 42% are held by women (figure 4.4).
4.8 Percentage of female appointees in roles where ministers have delegated responsibility for appointments, 2019
| DHSC delegated appointees | 39% |
| MOJ delegated appointees | 51% |
| All delegated appointees | 47% |
| All non-delegated appointees | 42% |
4.9 Appointments made during 2018/19
For regulated appointments, the proportion of new appointments and reappointments made by UK Government Ministers in 2018/19 to women was 43%. The breakdown by departments is shown in figure 4.5.
4.10 Percentage of female appointments made in 2018/19 by departments
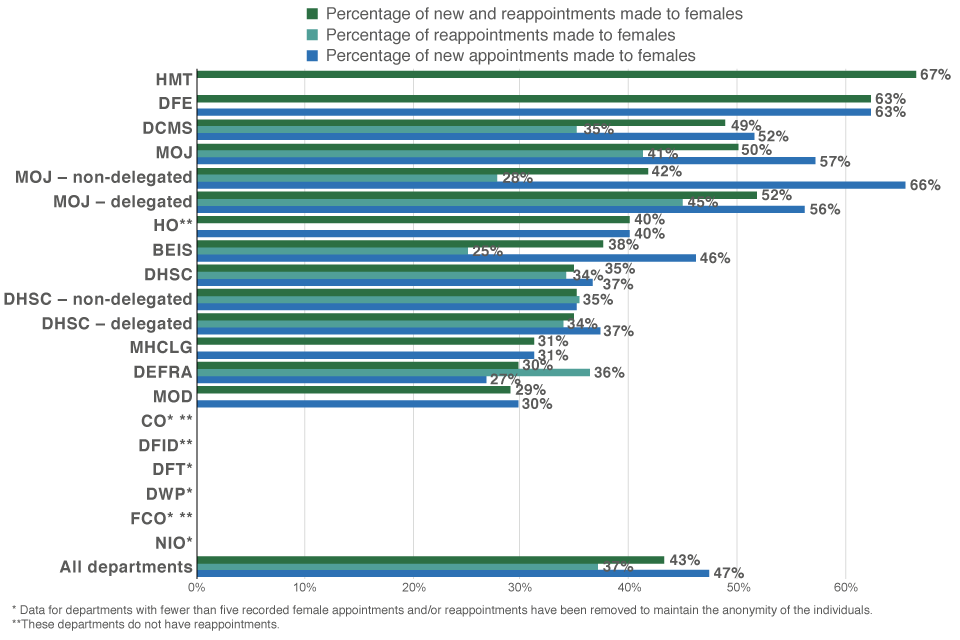
For new and reappointments where the appointing responsibility has been delegated by Ministers, 46% of appointments in 2018/19 were made to women. For those where the appointments are made directly by Ministers, 39% were made to women.
No comparable data is available for previous years.
5. Ethnic background analysis
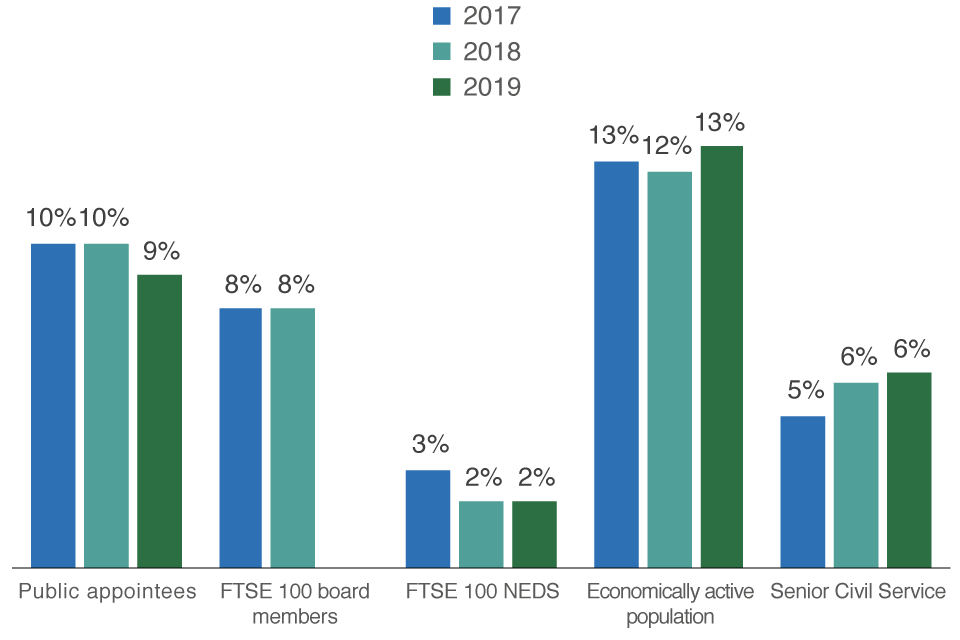
5.1 Public appointees as at 31 March 2019
Nine percent (315) of public appointees were from an ethnic minority background, a one percentage point drop from the previous year (figure 5.1). This includes individuals from all groups other than White ethnic minority groups (Indian, Pakistani, Bangladeshi, Chinese, African, Caribbean, Arab and mixed ethnic groups).
5.2 Public appointees from an ethnic minority background compared to other sectors
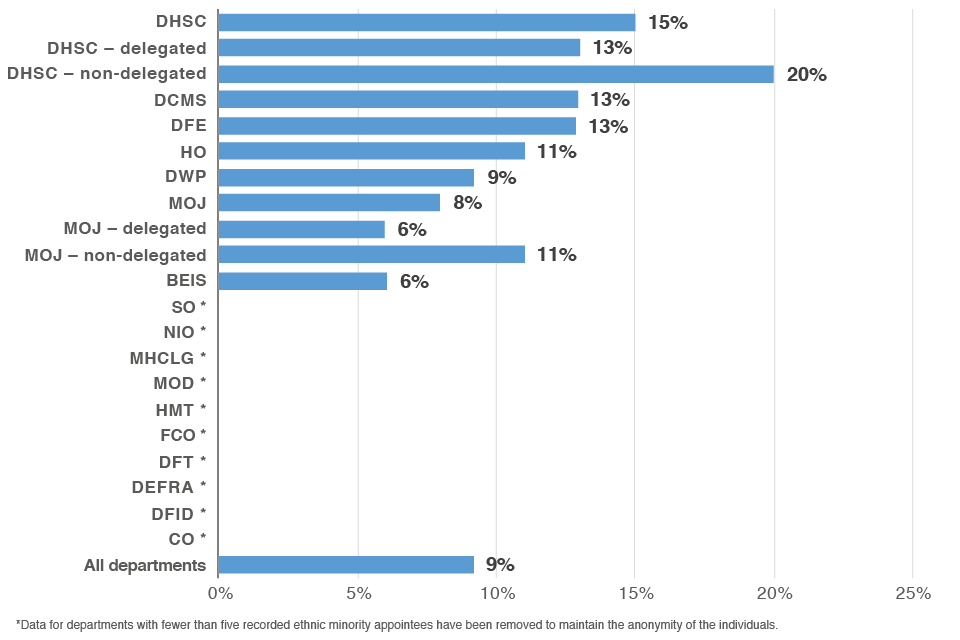
5.3 Public appointees by department
There is considerable variability in the percentage of public appointees that have an ethnic minority background (figure 5.2).
5.4 Percentage of appointees from ethnic minority backgrounds by department, 2019
5.5 Proportion of public appointees: Chairs and members
The proportion of appointees from an ethnic minority background in Chair or Chair equivalent roles is 5%. This is an increase of two percentage points on the previous year, as shown in figure 5.3.
5.6 Percentage of board members and chairs from ethnic minority backgrounds 2017-2019
| Appointees | 2017 | 2018 | 2019 |
|---|---|---|---|
| All appointees | 10% | 10% | 9% |
| Chairs | 4% | 3% | 5% |
| Board Members | 10% | 11% | 10% |
5.7 Proportion of public appointees: Delegated and non-delegated roles
For posts where the responsibility for appointment has been delegated by Ministers, 9% of current appointees are from a minority ethnic background. For those where the appointments are made directly by Ministers, 10% are from an ethnic minority background (figure 5.4).
5.8 Percentage of appointees from ethnic minority backgrounds in roles where ministers have delegated responsibility for appointments, 2019
| DHSC delegated appointees | 13% |
| MOJ delegated appointees | 6% |
| All delegated appointees | 9% |
| All non-delegated appointees | 10% |
5.9 Appointments made during 2018/19
For regulated appointments, the proportion of new appointments and reappointments made by UK Government Ministers in 2018/19 to people from an ethnic minority background was 13%. The breakdown by department is shown in figure 5.5.
5.10 Percentage of appointments made to candidates from ethnic minority background in 2018/19 by department
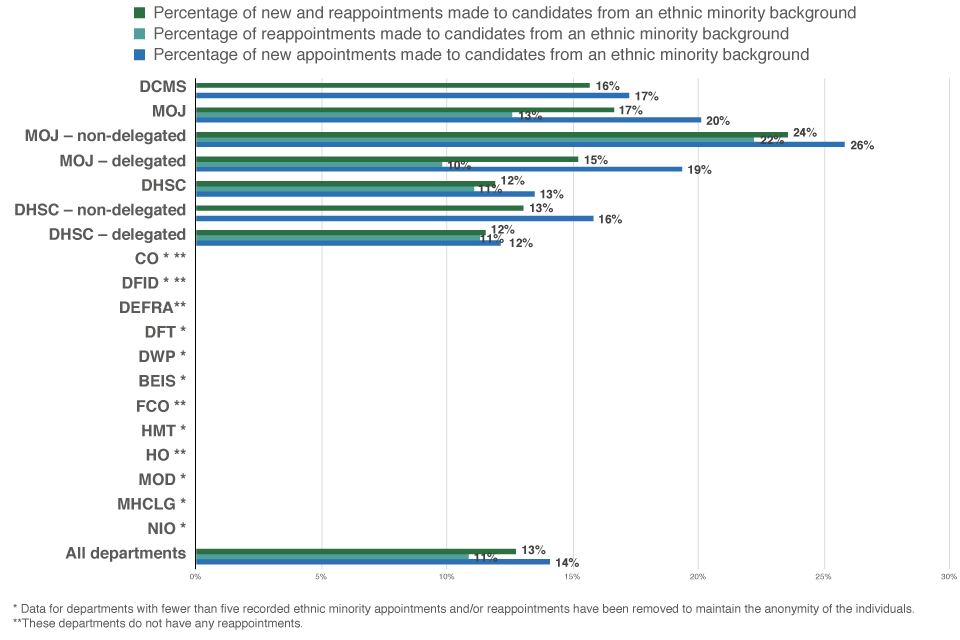
For posts where the appointing responsibility had been delegated by Ministers, 14% of appointments were made to candidates from an ethnic minority background in 2018/19. For those where the appointments are made directly by Ministers, 11% were made to candidates from an ethnic minority background.
No comparable data is available for previous years.
6. Disability analysis
6.1 Public appointees as at 31 March 2019
Eleven percent (379) of public appointees at 31 March 2019 reported having a disability. This is an increase of six percentage points from the previous year, as shown in figure 6.1.
6.2 Percentage of public appointees with a disability compared to other sectors
| Sector | 2017 | 2018 | 2019 |
|---|---|---|---|
| Public appointees | 5% | 5% | 11% |
| Economically active population | 12% | 13% | 14% |
| Senior Civil Service | 3% | 4% | 5% |
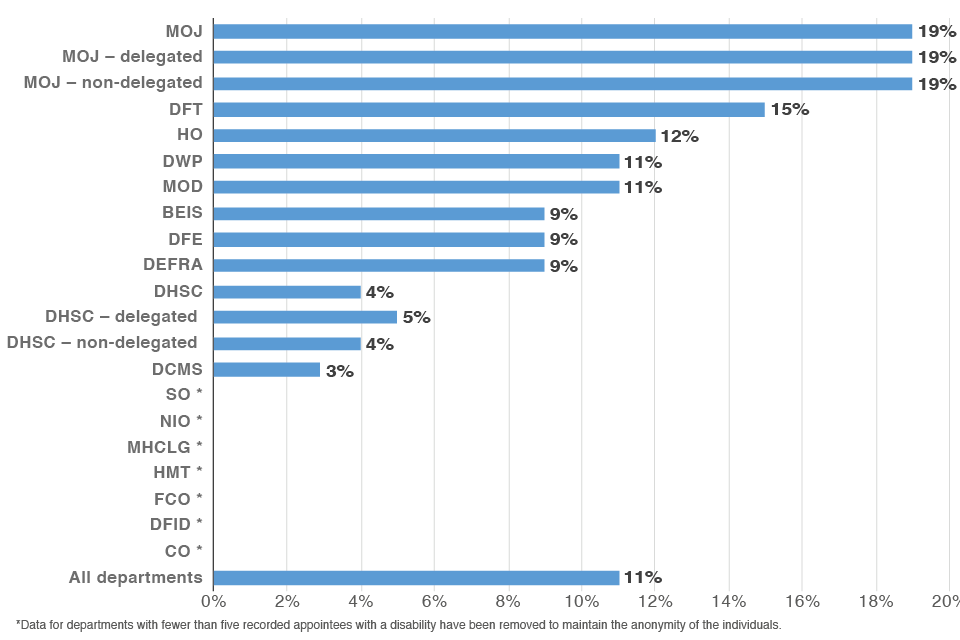
6.3 Public appointees by department
The percentage of appointees with a disability varies by department (figure 6.2).
6.4 Percentage of appointees with a disability by department, 2019
6.5 Proportion of public appointees: Chairs and members
The proportion of Chairs with a disability increased from 5% to 9%. The proportion of members with a disability increased by 5% to 12% in 2019, as shown in figure 6.3.
6.6 Percentage of board members and chairs with a disability 2017-2019
| Appointees | 2017 | 2018 | 2019 |
|---|---|---|---|
| All appointees | 5% | 5% | 11% |
| Chairs | 5% | 5% | 9% |
| Board Members | 5% | 5% | 12% |
6.7 Proportion of public appointees: Delegated and non-delegated roles
The percentage of current appointees with a disability in roles where appointments were made directly by Ministers is 10%. For posts where the appointing authority has been delegated by Ministers, the proportion of appointees with a disability is 14% (figure 6.4).
6.8 Percentage of appointees with a disability in roles where ministers have delegated responsibility for appointments, 2019
| DHSC delegated appointees | 5% |
| MOJ delegated appointees | 19% |
| All delegated appointees | 14% |
| All non-delegated appointees | 10% |
6.9 Appointments made during 2018/19
For regulated appointments, the proportion of new appointments and reappointments made by UK Government Ministers in 2018/19 to people with a disability was 6%. The breakdown by department is shown in figure 6.5. Departments with fewer than five appointments made to people declaring a disability have been excluded.
6.10 Percentage of appointments made to people with a disability in 2018/19 by department
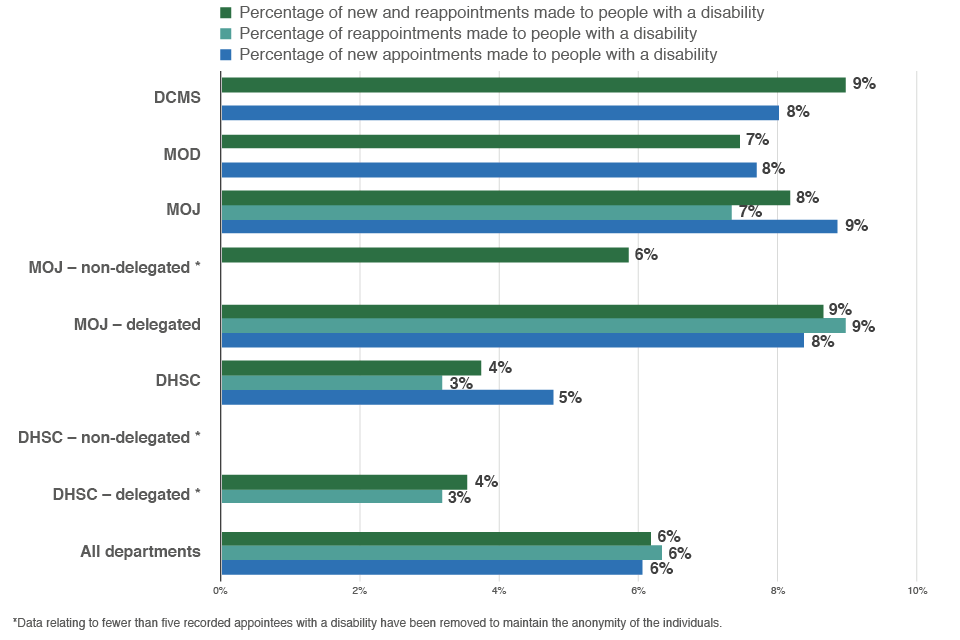
For posts where the responsibility for appointment has been delegated by Ministers, 7% of all appointments were made to candidates with a disability, whilst for those where the appointments are made directly by Ministers, 5% were made to candidates with a disability.
No comparable data is available for previous years.
7. Analysis of other factors
7.1 Age – current public appointees
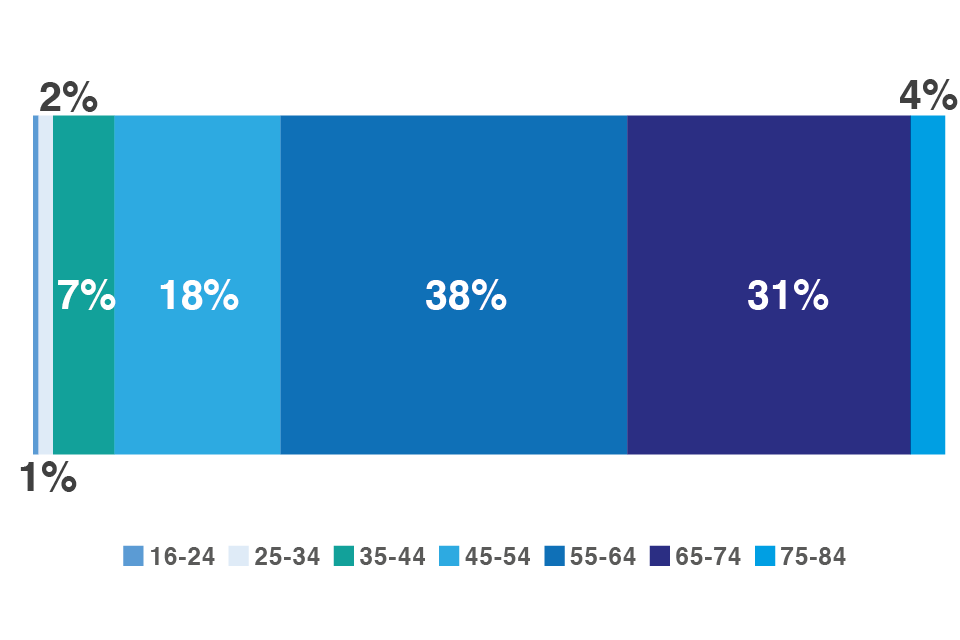
The age profile of public appointees is weighted towards the older end of the spectrum. Almost three quarters (73%) of serving appointees are aged 55 years and over (figure 7.1).
7.2 Snapshot of current chairs and members (appointees) by age
7.3 Age – appointments made in 2018/19
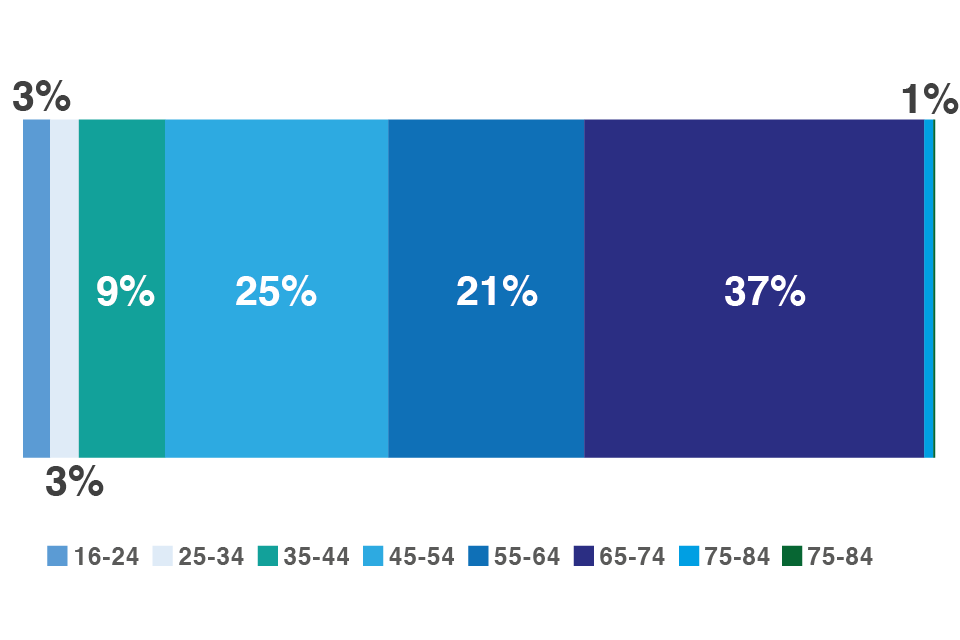
60% of all appointments in 18/19 went to candidates aged 55 years and over (figure 7.2).
7.4 Age distribution of new and reappointments made during 2018/19
7.5 Sexual Orientation – current public appointees
54% of serving appointees provided information on their sexual orientation. Of these, 96% are heterosexual and 4% are lesbian, gay, bisexual or ‘other’ (LGBO), as shown in figure 7.3.
7.6 Sexual orientation of current appointees as at 31 March 2019
| Heterosexual public appointees | 95.7% |
| LGBO public appointees | 4.3% |
| LGBO senior civil servants | 5.5% |
7.7 Sexual Orientation – appointments made in 2018/19
69% of individuals who were appointed or reappointed in 18/19 provided this data. Of these 94% are heterosexual and 6% are lesbian, gay, bisexual or ‘other’ (figure 7.4).
7.8 Percentage of new and reappointments made in 2018/19 by sexual orientation
| Heterosexual | 94% |
| LGBO | 6% |
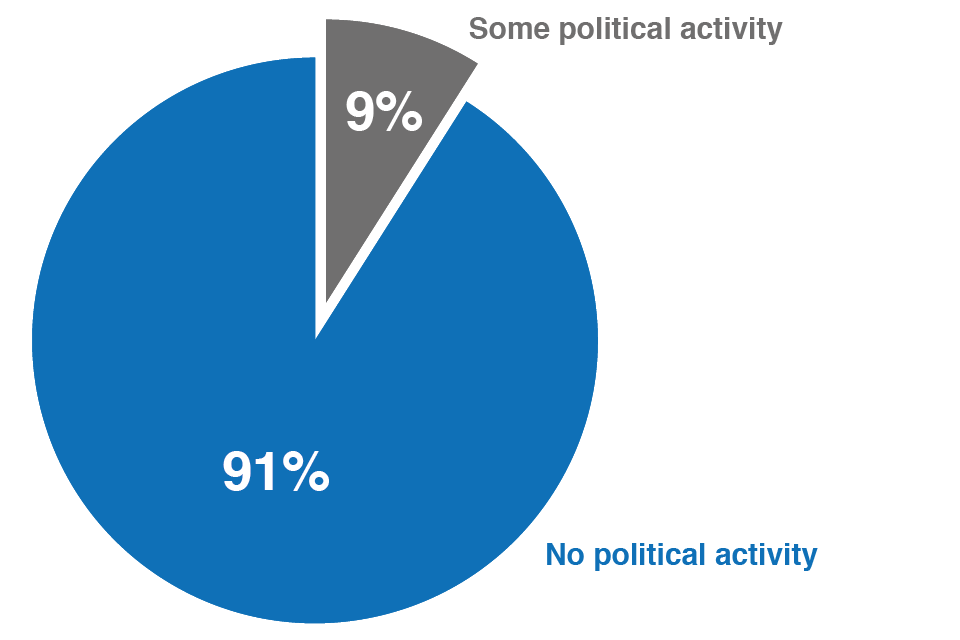
7.9 Political activity
69% of individuals who were appointed or reappointed in 18/19 provided this data. Of these, 9% (100) stated that they had taken part in significant political activity in the past five years.
Significant political activity is defined as being employed by a political party, holding significant office in a party, standing as a candidate for a party in an election, having publicly spoken on behalf of a political party or having made significant donations or loans to a party. Significant loans and donations are those of a size which are reported to the Electoral Commission, in line with a central party’s reporting threshold.
Of the 9% who responded positively to this question, 36% stated that this was on behalf of the Conservative party and 46% on behalf of the Labour party* (see figure 7.5).
7.10 Proportion by political party of the 9% of people appointed who declared some significant political activity[footnote 2]
| Labour | 46% |
| Conservative | 36% |
| Liberal Democrat | 12% |
| Green | 5% |
| Plaid Cymru | 1% |
| Scottish National Party | 0% |
7.11 Regional distribution
The regions with the highest proportion of serving public appointees are London and the South East. 37% of all public appointees declared their primary residence as being in one of these two regions. Figure 7.6 illustrates the regional distribution of serving public appointees alongside the economically active population.
7.12 Regional distribution of current appointees at 31 March 2019 compared to ONS Economically Active Population
| Residence | ONS Percentage Economically Active | Appointees to non-delegated roles | Appointees to delegated roles | All appointees |
|---|---|---|---|---|
| Who have another residence | 0% | 0% | 0% | 0% |
| Scotland | 8% | 4% | 0% | 2% |
| Northern Ireland | 3% | 5% | 0% | 2% |
| Wales | 4% | 4% | 3% | 3% |
| North East | 4% | 4% | 4% | 4% |
| East | 9% | 5% | 8% | 7% |
| Yorkshire and Humberside | 8% | 7% | 7% | 7% |
| North West | 11% | 6% | 10% | 8% |
| East Midlands | 7% | 7% | 10% | 9% |
| South West | 8% | 9% | 11% | 10% |
| West Midlands | 9% | 7% | 14% | 10% |
| South East | 14% | 21% | 17% | 18% |
| London | 15% | 22% | 16% | 19% |
27% of appointments made in 2018/19 were filled by individuals based in London or the South East (see figure 7.7).
7.13 Regional distribution of appointments made in 2018/19 compared to ONS Economically Active Population
| Residence | ONS Percentage Economically Active | Percentage non-delegated appointments | Percentage delegated appointments | Percentage all appointments |
|---|---|---|---|---|
| Who have another residence | 0% | 1% | 0% | 0% |
| Scotland | 8% | 5% | 0% | 2% |
| Northern Ireland | 3% | 6% | 0% | 2% |
| North East | 4% | 2% | 2% | 2% |
| Wales | 4% | 5% | 4% | 4% |
| Yorkshire and Humberside | 8% | 6% | 8% | 8% |
| North West | 11% | 8% | 9% | 8% |
| East Midlands | 7% | 6% | 11% | 10% |
| East | 9% | 5% | 13% | 11% |
| London | 15% | 16% | 9% | 11% |
| West Midlands | 9% | 5% | 15% | 12% |
| South West | 8% | 9% | 16% | 14% |
| South East | 14% | 27% | 12% | 16% |
8. Sources
8.1 Cabinet Office SCS database, Cabinet Office
The official headline figures used for monitoring diversity of the Senior Civil Service is sourced from the Cabinet Office diversity and inclusion dashboard that collects comprehensive information on those individuals that make up the Senior Civil Service. Data used in this report is March 2019 and can be accessed here.
8.2 Green Park Leadership 10,000 (2019)
Provides benchmark data on ethnic minorities non-executive directors on FTSE 100 Boards. Data refer to the 2019 report published December 2019.
8.3 Hampton-Alexander Review, 2019 Report
Provides benchmark data on women on FTSE100 Boards. Data refer to the 2019 report published November 2019.
8.4 The Parker Review, 2017
Provides benchmark data on ethnic minority Directors on FTSE 100 Boards. Report can be accessed here (pdf, 1,273 KB).
8.5 UK Labour Market statistics, ONS
Latest data refer to June 2019, published August 2019. (Working population (economically active aged 16-64) by ethnicity and disability). Data for the economically active populations are taken from ONS Labour Markets Statistics and can be found here.
-
The economically active population is the term used by the Office for National Statistics to describe the population who are working, have sought work in the last four weeks and/or are available to start work in the next two weeks. ↩
-
An individual can be politically active for more than one party. ↩