Release notes, 10 June 2014
Updated 17 August 2023
Applies to England

© Crown copyright 2023
This publication is licensed under the terms of the Open Government Licence v3.0 except where otherwise stated. To view this licence, visit nationalarchives.gov.uk/doc/open-government-licence/version/3 or write to the Information Policy Team, The National Archives, Kew, London TW9 4DU, or email: psi@nationalarchives.gov.uk.
Where we have identified any third party copyright information you will need to obtain permission from the copyright holders concerned.
This publication is available at https://www.gov.uk/government/statistics/private-rental-market-statistics-england-only/release-notes-10-june-2014
Private rental market statistics (England onlyl)
Summary
This release provides statistics on the rents paid for private properties in England (private rental market). The release presents the mean (average), median, lower quartile, and upper quartile gross monthly rent paid (ignoring any adjustment for services not eligible for housing benefit), for a number of bedroom/room categories (see Methodology section) for each Local Authority (LA) in England for the 12 months to the end of March 2014.
The data are taken from an administrative system and the samples used are not statistical and their composition may change. This means that comparisons over time should not be made as changes may be due to differences in the sample rather than true changes in the rental market. Further details can be found in the methodology section.
Key findings
1) The median rent recorded between 1 April 2013 and 31 March 2014 in England was £595. The highest regional median rent was in London, £1300, and the lowest was in the North East, £450. (Note: changes across regions may be influenced by differences in the sample composition rather than true differences in the rents).
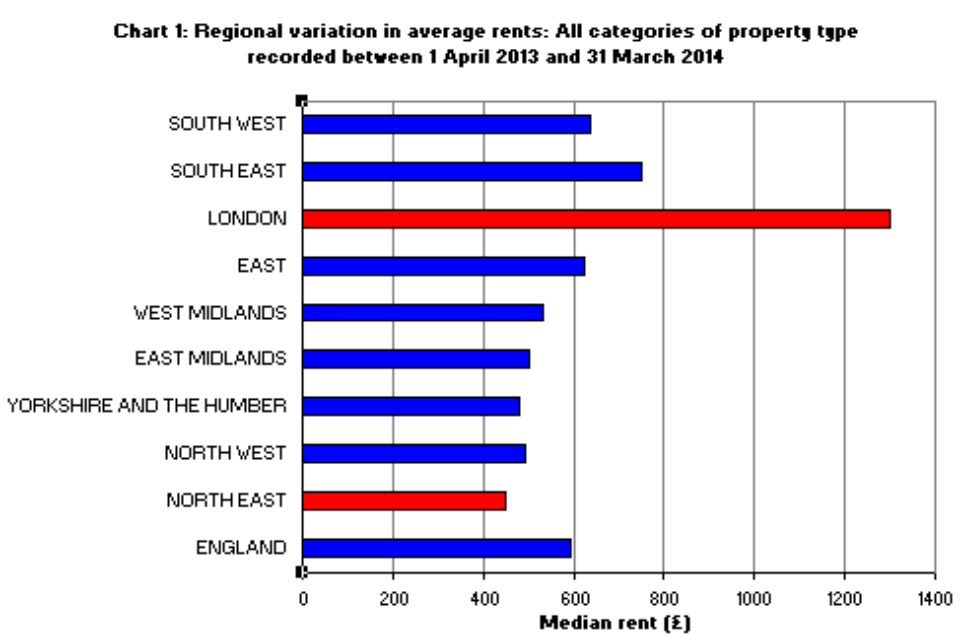
Image of a graph that represents the regional variation in average rents
Chart 1: Regional variation in average rents: All categories of property type recorded between 1 April 2013 and 31 March 2014
2) The average rent recorded between 1 April 2013 and 31 March 2014 was highest in London across all property types compared with other regions in England. London followed by South East, South West and the East see the most variation in rental values across all property types. London sees the biggest increase in rental price between room and 1 room at £631 (116%) while East Midlands sees the smallest change £91 (28%). For 2 to 3 rooms London again sees the biggest change £401 (27%) while Yorkshire and the Humber sees the smallest £74 (15%). (Note: changes across regions may be influenced by differences in the sample composition rather than true differences in the rents).
Methodology
Private rental data entered into the lettings administrative information database were extracted for the twelve months to the end of March 2014. Cases where there was evidence of a transaction (i.e. rent has been paid) were retained while those with limited or no evidence of a transaction were removed.
The data were broken down by Local Authority and by bedroom/room category (see details below) and statistics were calculated on the gross monthly rents (ignoring any adjustment for services not eligible for housing benefit) for each of these groups.
Definitions of the bedroom/room categories used are provided below:
Room – non self-contained single room with shared facilities. Includes bedsits, single rooms in a house or flat shared with other tenants, and single rooms rented from a resident landlord.
Studio – self-contained single roomed property with own kitchen and bath/shower/WC facilities.
One bedroom – self-contained properties with one bedrooms including houses, bungalows, flats and maisonettes.
Two bedrooms – self-contained properties with two bedrooms including houses, bungalows, flats and maisonettes.
Three bedrooms – self-contained properties with three bedrooms including houses, bungalows, flats and maisonettes.
Four or more bedrooms – self-contained properties with four or more bedrooms including houses, bungalows, flats and maisonettes.
Since March 2013 the ONS has published a new price index – CPIH – which is broadly the Consumer Prices Index (CPI) with an additional component for ‘Owner Occupiers’ Housing’ (OOH). The OOH component is measured using the rental equivalence approach of using changes in the price on properties that are privately rented as a proxy for the economic costs faced by owner occupiers of equivalent properties.
From June 2013, the ONS also began publication of an Index of Private Housing Rental Prices (IPHRP) that measures the change in price of renting residential property from private landlords. The index is published as a series of price indices covering Great Britain, its constituent countries and the English regions. The production of this index was made possible due to developments of the housing components of the consumer price indices explained above, and although the same data sources are used by both, the methodology of the IPHRP has been developed in order to produce a regional series.
Both the CPIH (and IPHRP) produced for the ONS and the PRM bi-annual publication use VOA data held on the lettings database, however the methodological treatment is different across the three sets of statistics (although less so between the CPIH and IPHRP) and hence the potential for comparison is limited. The price indices data the VOA provides to ONS (known as ‘elementary aggregates’) undergo a complex process to ensure there is a matched sample of comparable properties during the year, consistent with the CPI methodology, whereas the PRM is designed to provide a ‘snap shot’ of the rental market with no attempt made to reflect the changing composition of the underlying data.
The ONS convert the elementary aggregates into a single weighted average index component by applying weights that reflect the composition of the UK owner occupiers’ housing ‘market’ (and the rental market in respect to the IPHRP), in terms of regional weighting and the distribution of different property characteristics (eg number of bedrooms). This weighting process of ‘mix-adjustment’ is also not applied in the PRM publication.
The PRM publication provides average rents and the CPIH provides indices based on the same data source, however the indices should not be applied to the average rents because of the differences in the methodology. These differences can be summarised as follows:
Differences in the production of PRM publication statistics and price indices:-
- Sample size – Despite using the same data PRM is around 1/5 (100,000 records) larger than CPIH/IPHRP data. This is because the VOA publication uses all of the data available in the sample while the CPIH and IPHRP produce a matched sample.
- Sample composition – PRM statistics are based on an unmatched dataset containing all records collected over a 12 month period, CPIH (and IPHRP) use a matched sample containing genuine updates to a property’s rental value over an 18 month period. Where there is no genuine update a substitute rent is sought and where a match is found a replacement is made.
- Property mix – the VOA PRM publication does not necessarily reflects the composition of the owner-occupiers’ housing ‘market’ (or in the case of the IPHRP the private rental market) in regional distribution or in distribution of property characteristics (e.g. the weight given to London in the VOA publication is not necessarily equal to London’s true weight as reflected in London’s OOH weight).
- Treatment of Outliers – for the PRM new, unusually high or low, rents are identified and investigated. If they are deemed to be genuine rents they are included in the statistics. In CPIH (and IPHRP), during the replacement process, if a new rental property is required it will only be made if the new properties rental value is within a certain tolerance of the initial properties rental value.
All of these factors combine to make the PRM publication statistics more volatile with a greater tendency to change over time.
The data used to produce this publication come from a sample. The sample size varies across publications and also within publications, where there is variation across regions. This can be seen in Chart 2 where the largest regional sample, South West, is more than three times the size of the smallest sample, North East.
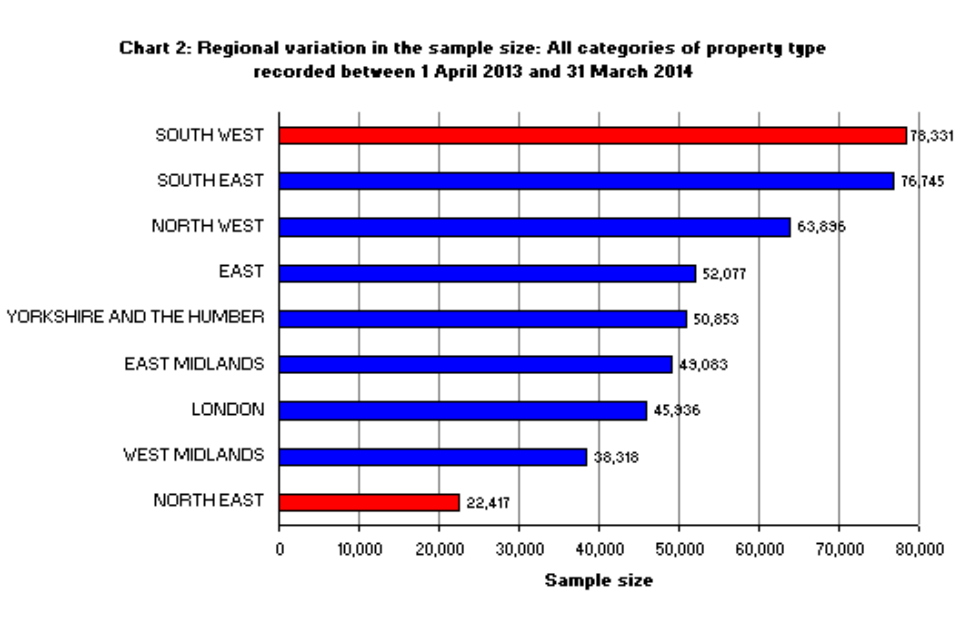
Image of a graph that represents the regional variation in average rents
Chart 2: Regional variation in the sample size: All categories of property type recorded between 1 April 2013 and 31 March 2014
Data quality
The statistics presented in this release represent the data as recorded in VOA administrative systems. They include all relevant data available and have not been adjusted to produce statistics which are representative of the private rental property market mix in England. The underlying data set to these statistics is not drawn from a statistical sample and does not consist of tracked properties. This means that the statistics presented in this release should be considered as indicative only and do not represent accurate measures of the population. Additionally, the composition of the sample varies over time and therefore care should be taken when drawing comparisons between the statistics reported in this release and those for different time periods due to those variations.
Further to the limitations stated above, the distribution of private rents for each local authority and bedroom/room category in England tends to exhibit a strong positive skew (i.e. a small number of very large monthly rents and large numbers of small rents).
In order to mitigate some of the effects of the problems stated above and to avoid disclosure of personal information, a judgement has been made to suppress statistics derived from samples containing fewer than 10 records. Rent values have been rounded to the nearest pound. Around 550 cases (0.01%) were removed from the data set as there was insufficient information to assign them to a suitable bedroom/room category.
Background notes
This release is for information only and should not be confused with Local Housing Allowance (LHA) rates published on DirectGov. While these statistics are derived from the same data source as LHA rates and Local Reference Rents (LRR) they are based on different categories and geographies.
Unlike the LHA rates, this publication reports on the total monthly rent paid (i.e. ignoring any adjustment for services not eligible for housing benefit) and in most cases the Broad Rental Market Area (BRMA) does not match the geography of the Local Authority (LA) area.
There has been no new data collection for this release. All data are captured during the course of Rent Officers’ statutory responsibilities to administer functions related to Housing Benefit (Local Housing Allowance and Local Reference Rent schemes) on behalf of the Department for Work and Pensions (DWP).
The Rent Officer determinations are made using evidence of rents paid in the private rented sector. In order to meet this responsibility, landlords and letting agents provide VOA Rent Officers with data pertaining to the properties they let. This information is captured electronically in the VOA’s lettings information database. Checks are carried out at the point of entry to ensure that any Housing Benefit funded tenancies are excluded from this database.
All the lettings information is provided on a goodwill basis. These statistics would not be possible without the continued co-operation of landlords and letting agents.
Uses made of the data
This publication is being released as part of a general drive towards making VOA’s data more accessible. It is hoped that the data will be of benefit to a broad user group, including: officials involved in housing policy, practitioners in the sector, researchers, tenants and other individuals with an interest in the private rental sector.
Your feedback on this publication would be welcomed and will help inform future releases. Please send any comments to statistics@voa.gsi.gov.uk.
Glossary of terms
The most relevant terms for this release are explained below.
Mean – a measure of central tendency often referred to as the average. Given a series of values the arithmetic mean is calculated by summing all these values together and dividing by the count of these values.
Median – when a series of numbers are arranged by order of magnitude the median represents the middle value. Where there is an even number of values the median is the mean of the two values closest to value in the centre of that distribution.
**Lower quartile **– when a series of values are arranged by order of magnitude the lower quartile (or 25th percentile) is the value below (above) which 25 (75) per cent of the values lie.
**Upper quartile **– when a series of values are arranged by order of magnitude the upper quartile (or 75th percentile) is the value below (above) which 75 (25) per cent of the values lie.
Skewness – this is a measure of the symmetry of a distribution. For symmetric distributions, the skewness is zero. If a distribution has a long right tail and the mean is larger than the median, then the distribution would be described as positively skewed; and vice versa for negatively skewed distributions.
Lettings Information Database – the database that holds lettings information collected as part of the VOA’s responsibility to administer the rent officer functions related to Housing Benefit (Local Housing Allowance and Local Reference Rents) on behalf of the Department for Work and Pensions (DWP).
Local Reference Rents (LRR) – the Local Reference Rent is the mid-point between what in the Rent Officer’s opinion are the highest and lowest non-exceptional rents in a given Broad Rental Market Area (BRMA).
Local Housing Allowance (LHA) – the Local Housing Allowance (LHA) system provides a way of working out Housing Benefit (HB) for claimants who rent from a private landlord. Local authorities use LHA rates based on the size of household and the area in which a person lives to work out the amount of rent which can be met with HB.
Broad Rental Market Area (BRMA) – a Broad Rental Market Area for Local Housing Allowance purposes is an area within which a person (or in the context of Local Reference Rents, a tenant of the dwelling) could reasonably be expected to live having regard to facilities and services, taking account of the distance of travel to and from those facilities and services. The BRMA contains residential premises of a variety of types to ensure representativeness of the rents that a landlord might reasonably be expected to obtain in that area.
Rent Officer (RO) – a statutory officer responsible for ensuring that the lettings information collected is representative of the full range of market rents for similar properties on which a rent determination is made and to record the information that they have used on VOA’s lettings information database.
Self-contained – where all the rooms (including kitchen, bathroom and toilet) in a household’s accommodation are behind a single door which only that household can use.
Area code – a unique identifier for administrative geographies as specified by the Office for National Statistics (ONS).
Billing authority – a local authority empowered to set and non-domestic rates on behalf of itself and other local authorities in its area. In England, shires, metropolitan districts, the Council of the Isles of Scilly, unitary authorities, London boroughs and the City of London are billing authorities.
Billing authority code – a unique identifier for billing authorities.
Region – a geographical unit formerly referred to as Government Office Region (GOR); since 1 April 2011 the term “region” has been substituted for “GOR”. The GOR framework is the primary classification for regional statistics and comprises nine regions of England, which combine with the devolved administrations collectively spanned the United Kingdom. This release comprises England regions plus Wales.
Further information
The responsible statistician for this release is Sarah Sawyer who can be contacted by email at statistics@voa.gsi.gov.uk.
Further information on the area codes used in this release please refer to the ONS’s website.
CSV Metadata
The following table provides the variable names and descriptions appearing on the CSV files included in this release.
| Variable | Variable Description |
|---|---|
| BA_CODE | Unique identifier for billing authorities |
| AREA_CODE | Unique identifier for administrative geographies as specified by the Office for National Statistics (ONS) |
| AREA | Administrative area name |
| REGION | The name of the region |
| CNT | Count of rents |
| AVG | Average |
| LQ | Lower quartile |
| MED | Median |
| UQ | Upper quartile |
The table below details the variables present in each CSV file (denoted by ‘X’).
| Variable / Table | 1.1 | 1.2 | 1.3 | 1.4 | 1.5 | 1.6 | 1.7 | 2.1 | 2.2 | 2.3 | 2.4 | 2.5 | 2.6 | 2.7 |
|---|---|---|---|---|---|---|---|---|---|---|---|---|---|---|
| BA_CODE | X | X | X | X | X | X | X | |||||||
| AREA_CODE | X | X | X | X | X | X | X | X | X | X | X | X | X | X |
| AREA | X | X | X | X | X | X | X | |||||||
| REGION | X | X | X | X | X | X | X | |||||||
| CNT | X | X | X | X | X | X | X | X | X | X | X | X | X | X |
| AVG | X | X | X | X | X | X | X | X | X | X | X | X | X | X |
| LQ | X | X | X | X | X | X | X | X | X | X | X | X | X | X |
| MED | X | X | X | X | X | X | X | X | X | X | X | X | X | X |
| UQ | X | X | X | X | X | X | X | X | X | X | X | X | X | X |