Potential trajectories for COVID-19 in the next 6 months, 29 October 2020
Updated 26 October 2021

© Crown copyright 2021
This publication is licensed under the terms of the Open Government Licence v3.0 except where otherwise stated. To view this licence, visit nationalarchives.gov.uk/doc/open-government-licence/version/3 or write to the Information Policy Team, The National Archives, Kew, London TW9 4DU, or email: psi@nationalarchives.gov.uk.
Where we have identified any third party copyright information you will need to obtain permission from the copyright holders concerned.
This publication is available at https://www.gov.uk/government/publications/potential-trajectories-for-covid-19-in-the-next-6-months-29-october-2020/potential-trajectories-for-covid-19-in-the-next-6-months-29-october-2020
Potential trajectories for COVID-19 in the next 6 months
The dynamics of the current “second wave” of COVID-19 transmission have important differences from the first wave. Until interventions were introduced in mid-March, the reproduction number, R, of the virus was close to 3 and the epidemic was doubling every 3 to 4 days. Lockdown abruptly reduced contact rates between people in different households, causing R to fall to approximately 0.6.
Now we are seeing epidemic growth again across the UK, but at a much lower rate - characterised by R=1.2 to 1.5 and doubling times in the 2 to 3 week range. The lower reproduction number reflects the ongoing large impact of controls. Population contact rates remain at about half of pre-lockdown levels, as measured by the CoMix contact survey. Infection rates are growing because a 50% reduction is insufficient to control the spread of this virus. With a basic reproduction number of 3, controls need to reduce infectious contacts by two thirds.
As the additional control measures announced recently take effect, we hope that R may be pulled down further - perhaps to 1.1 or lower. With R at such low levels, even limited accumulation of population immunity will start reducing the average susceptibility of the population, slowing transmission. When R is 1.1, only 9% of the remaining susceptible (such as not previously infected) population need to be infected for R to fall to 1, solely as a result of the natural dynamics of the epidemic. At this point, in some sense, population immunity has caused the epidemic to plateau. However, this is very different from a classic “herd-immunity” scenario, where an epidemic has run through a population with limited impact of control measures:
- The decline in infection rates seen after cases plateau will be slow, driven by gradual accumulation of population immunity - potentially leading to a long, relatively flat plateau of relatively high incidence unless measures are further intensified to drive incidence down.
- There will be very limited room to relax interventions, since the absolute level of population immunity reached will likely still be low. In the example where interventions cause R to be reduced to 1.1 and population immunity then gradually reduces R to 1, changes in effective contacts will be responsible for over 90% of control and immunity for less than 10%. Relaxing measures will therefore easily cause R to exceed 1 once more.
- This relaxation following peaking of infection rates could be due to spontaneous behaviour change or government-induced. In either case it could result in a prolonged period of high incidence, with associated pressures on health services and deaths.
Trends seen in a number of US states in recent months (for example Florida, see below) are suggestive of this type of dynamics.
Daily reported COVID-19 deaths in Florida, USA (© New York Times) with lockdown period indicated
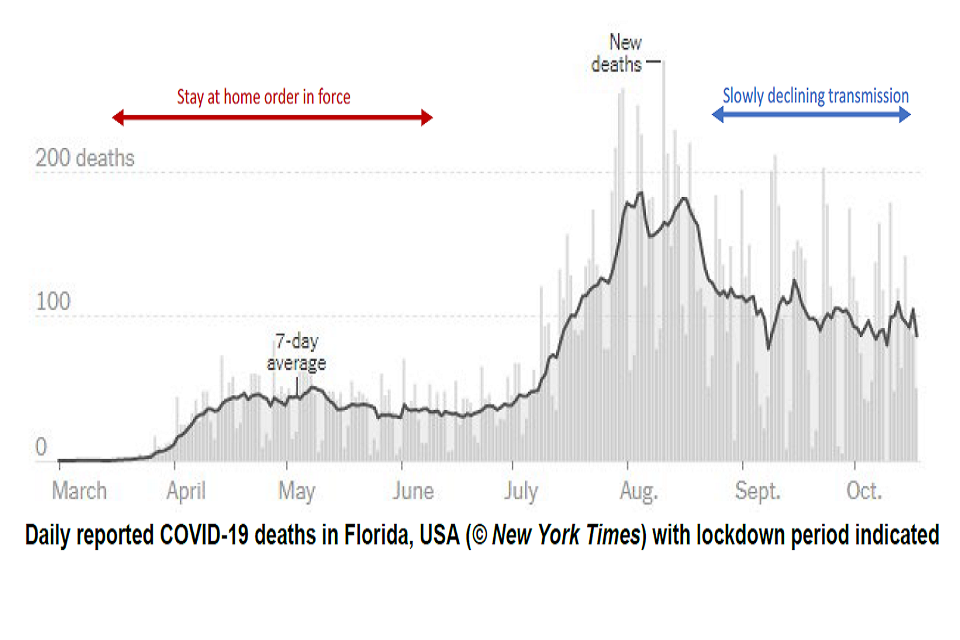
The graph shows cases remaining flat at around 40 deaths a day until the stay at home order was ended in July, where there is a large spike in cases and new deaths, with the 7 day average just under 200 deaths a day.