Police workforce, England and Wales: 31 March 2015
Published 16 July 2015
Applies to England and Wales

© Crown copyright 2015
This publication is licensed under the terms of the Open Government Licence v3.0 except where otherwise stated. To view this licence, visit nationalarchives.gov.uk/doc/open-government-licence/version/3 or write to the Information Policy Team, The National Archives, Kew, London TW9 4DU, or email: psi@nationalarchives.gov.uk.
Where we have identified any third party copyright information you will need to obtain permission from the copyright holders concerned.
This publication is available at https://www.gov.uk/government/statistics/police-workforce-england-and-wales-31-march-2015/police-workforce-england-and-wales-31-march-2015
1. Introduction
This release contains statistics on the numbers of police officers, police staff, police community support officers (PCSOs), designated officers, traffic wardens and special constables in post on 31 March 2015 in the 43 police forces of England and Wales and the British Transport Police.
The workforce figures in this release are all provided on a full-time equivalent (FTE) basis unless indicated otherwise. FTE figures are a count of police workers that takes account of part-time working practices. For example, a full-time employee is counted as 1.0 and a part-time employee who works 70% of normal hours is counted as 0.7. It accounts for contracted hours, rather than actual hours worked that might include overtime. Some figures on a headcount basis are available in the supplementary data tables.
See the ‘User Guide to Police Workforce Statistics’ for further information, including a glossary, conventions used and other background information. The user guide includes additional information on data quality and interpreting the figures, potential uses of the data and other data sources.
The data in this release can be found in the ‘Police Workforce, England and Wales, 31 March 2015’ tables.
2. Key facts
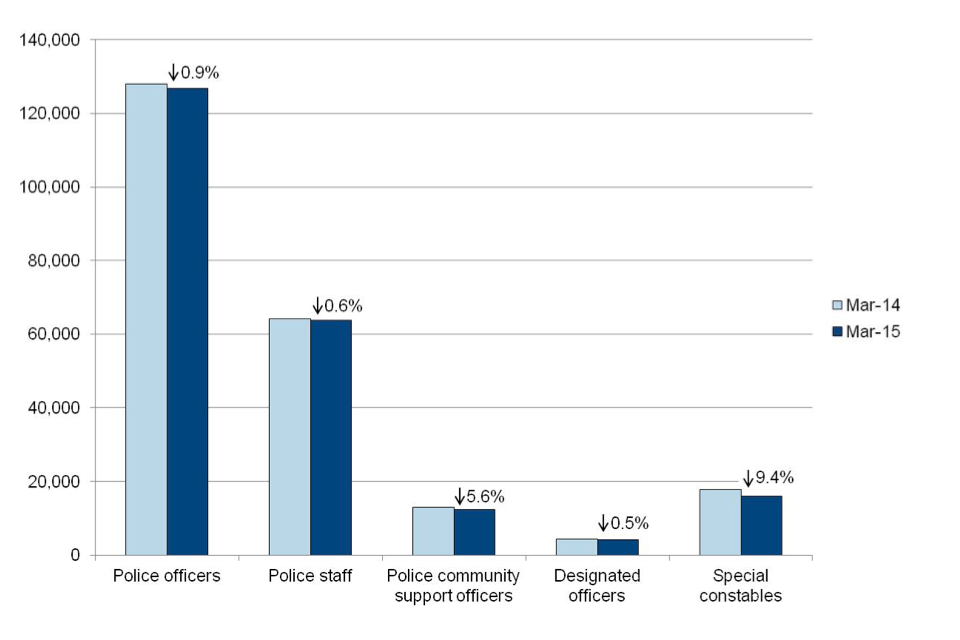
The numbers of all worker types have fallen between 31 March 2014 and 31 March 2015 (figure 1).
Figure 1: Police workforce, by type of police worker and special constables, as at 31 March 2014 and 2015, England and Wales1, 2
Not provided.
Chart notes
1. Based on full-time equivalent figures for the 43 forces of England and Wales only. Figures for special constables are headcount.
2. This chart excludes traffic wardens due to the very small numbers, which reflects the dominant role of local authorities in parking control.
Source: Home Office, Police workforce, table 3.
Minority ethnic police officers made up 5.5% of all officers on 31 March 2015, while female officers made up just over a quarter (28.2%) of the total. Both of these were increases on the previous year, and continued a long term upward trend.
The number of frontline officers has fallen in the last year, continuing a long term downward trend since 31 March 2010. However, the proportion of frontline officers has increased over the same period, and now stands at 91.6 per cent.
3. Police workforce
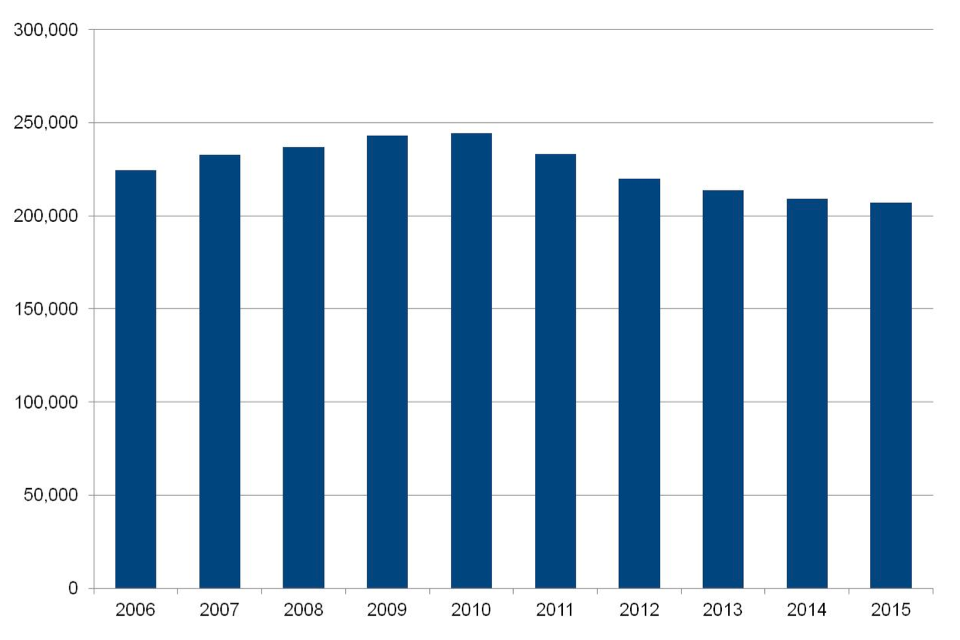
There were 207,140 police workers in the 43 police forces on 31 March 2015 (Table A), a decrease of 2,222 or 1.1% compared with a year earlier. Of these police workers, 95.6% were available for duty (this excludes long-term absentees).
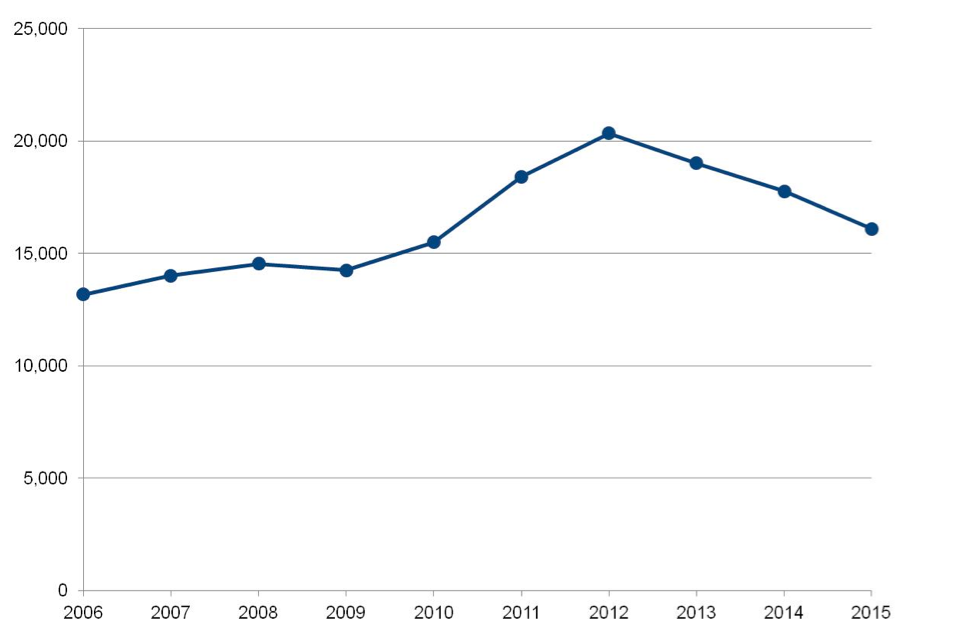
Figure 2 shows police worker numbers generally increased between March 2006 and March 2010 but have decreased since.
Figure 2: Police workforce, as at 31 March 2006 to 2015, England and Wales1, 2
Not provided.
Chart notes
1. Based on full-time equivalent figures for the 43 forces of England and Wales only.
2. These figures include police officers, police staff, police community support officers, designated officers and traffic wardens. They exclude special constables.
Source: Home Office, Police workforce, table 3.
In addition to the 207,140 police workers, there were 16,101 special constables (headcount) in the 43 police forces on 31 March 2015. Special constables do not have contracted working hours so their numbers are provided on a headcount rather than a FTE basis (Table 13).
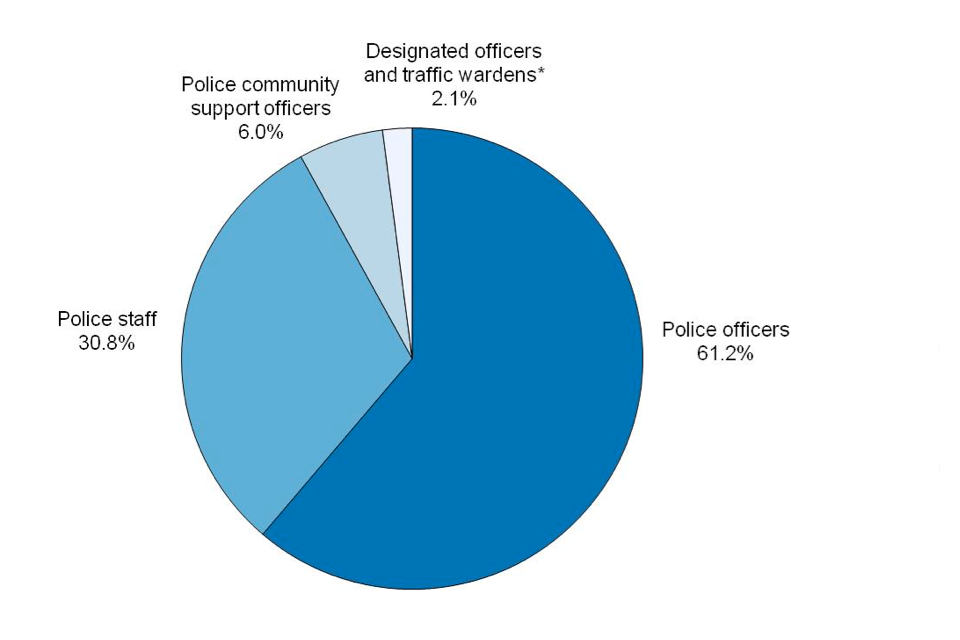
Figure 3 shows that police officers made up the largest proportion of police workers at just under two thirds. There was little change in the composition of the police workforce between 31 March 2014 and 31 March 2015. Since 2010, there have been some small changes to the composition of the police workforce, with the proportion of police officers and designated officers generally increasing, and the proportion of police staff and police community support officers generally decreasing.
Figure 3: Police workforce, by type of police worker, as at 31 March 2015, England and Wales1, 2
Not provided.
Chart notes
1. Based on full-time equivalent figures for the 43 forces of England and Wales only.
2. Due to rounding, these percentages do not add up to 100.
*Designated officers and traffic wardens account for 2.1% and 0.01% of the total police workforce respectively. The very small number of traffic wardens reflects the dominant role of local authorities in parking control.
Source: Home Office, Police workforce, table 3.
Table A: Police workforce, as at 31 March 2015, England and Wales1
| Rank | All staff (FTE) | Staff available for duty (FTE) |
|---|---|---|
| Chief officers2 | 201 | 200 |
| Chief superintendents | 337 | 332 |
| Superintendents | 820 | 808 |
| Chief inspectors | 1,657 | 1,625 |
| Inspectors | 5,701 | 5,548 |
| Sergeants | 19,148 | 18,511 |
| Constables | 98,954 | 94,053 |
| Total police ranks | 126,818 | 121,078 |
| Police staff3 | 63,719 | 61,073 |
| Police community support officers | 12,331 | 11,719 |
| Designated officers4 | 4,254 | 4,122 |
| Traffic wardens | 18 | 17 |
| Total police workforce | 207,140 | 198,009 |
| Special constabulary5 | 16,101 | - |
Table notes
1. Relates to the 43 forces of England and Wales only.
2. Includes Assistant Chief Constables, Deputy Chief Constables and Chief Constables, and their equivalents in the Metropolitan Police and City of London Police. These police officers were previously referred to as Association of Chief Police Officer (ACPO) ranks; however on 1 April 2015 ACPO was replaced by the National Police Chiefs’ Council (NPCC).
3. Excludes police community support officers, designated officers and traffic wardens.
4. Excludes police community support officers.
5. Headcount only.
Source: Home Office, Police workforce, data tables.
4. Police officers
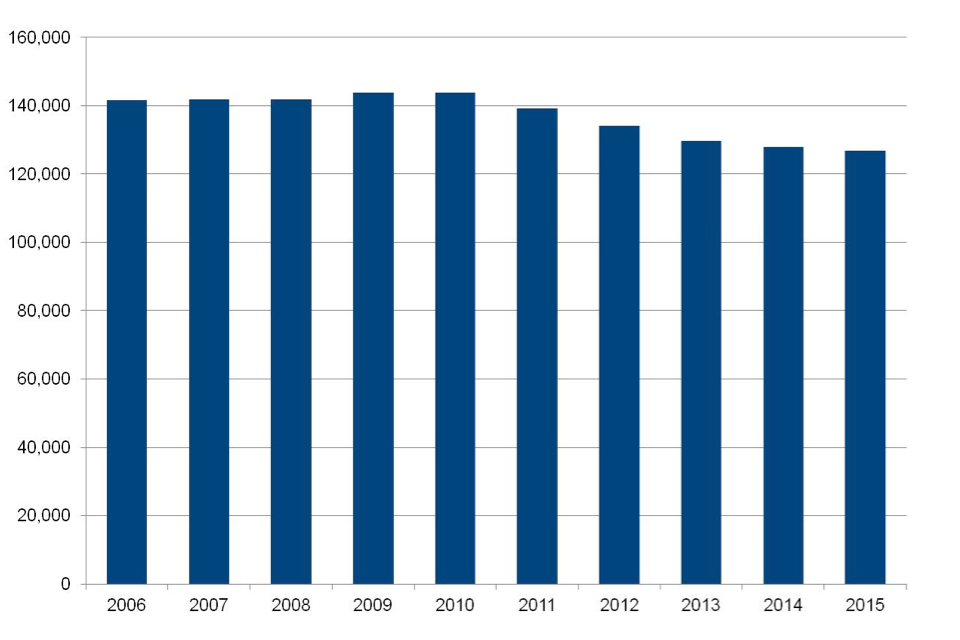
There were 126,818 police officers in the 43 police forces on the 31 March 2015. In addition, the British Transport Police employed 2,877 police officers and 292 police officers were seconded to central services (Table 1).
The number of police officers in the 43 forces decreased by 1,091 or 0.9% compared with a year earlier, the sixth consecutive annual fall, and the lowest number since March 2002 (Table 3 and Supplementary Table 5).
Figures 4 and 5 show that police officer numbers have generally seen a small increase between March 2006 and March 2010, but have decreased since. Large decreases were recorded between March 2010 and March 2013, but the decreases have slowed in the most recent 2 years.
Figure 4: Police officers, as at 31 March 2006 to 2015, England and Wales1
Not provided.
Chart notes
1. Based on full-time equivalent figures for the 43 forces of England and Wales only.
Source: Home Office, Police workforce, table 3.
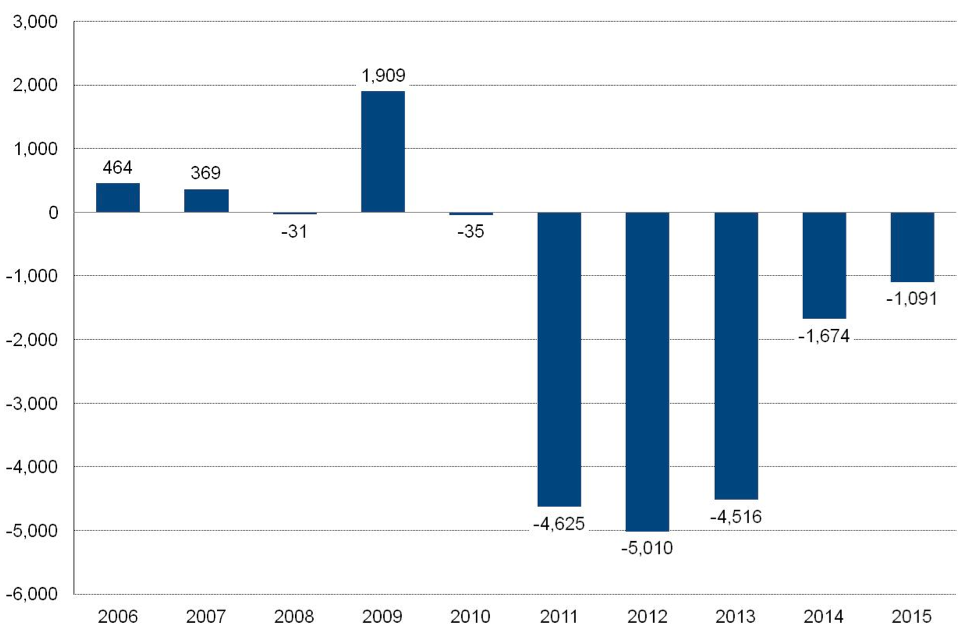
Figure 5: Change in the number of police officers, as at 31 March 2006 to 2015, compared with the previous 12 months, England and Wales1
Not provided.
Chart notes
1. Based on full-time equivalent figures for the 43 forces of England and Wales only.
Source: Home Office, Police workforce, table 3.
Officer numbers rose in 13 forces (Figure 3 and Table 9) over the last twelve months. Of these forces, Bedfordshire (54 officers or 5.3%) had the largest increase in percentage terms, whilst the Metropolitan Police had the largest numerical increase (946 officers or 3.1%).
Officer numbers decreased in the remaining 30 forces. Durham (-119 officers or -9.3%) fell the most in percentage terms, whilst Greater Manchester (-294 officers or -4.2%) experienced the largest numerical decrease (Figure 3 and Table 9).
The Metropolitan Police had the most officers, accounting for 25.1% of all officers across the 43 forces on 31 March 2015. The 8 metropolitan forces (City of London, Greater Manchester, Merseyside, Metropolitan Police, Northumbria, South Yorkshire, West Midlands and West Yorkshire) comprised 48.2%of all officers (Table 9).
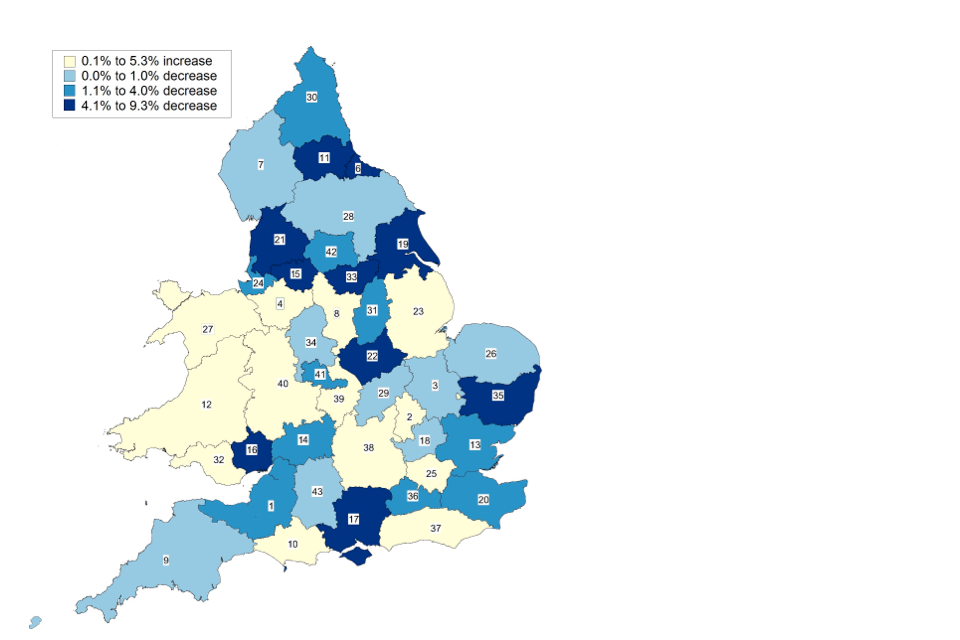
Figure 6: Police officers, percentage change between March 2014 and March 2015, England and Wales
Not provided.
| 1. Avon and Somerset | 12. Dyfed-Powys | 23. Lincolnshire | 34. Staffordshire |
| 2. Bedfordshire | 13. Essex | 24. Merseyside | 35. Suffolk |
| 3. Cambridgeshire | 14. Gloucestershire | 25. Metropolitan Police and City of London | 36. Surrey |
| 4. Cheshire | 15. Greater Manchester | 26. Norfolk | 37. Sussex |
| 5. City of London (see 25) | 16. Gwent | 27. North Wales | 38. Thames Valley |
| 6. Cleveland | 17. Hampshire | 28. North Yorkshire | 39. Warwickshire |
| 7. Cumbria | 18. Hertfordshire | 29. Northamptonshire | 40. West Mercia |
| 8. Derbyshire | 19. Humberside | 30. Northumbria | 41. West Midlands |
| 9. Devon and Cornwall | 20. Kent | 31. Nottinghamshire | 42. West Yorkshire |
| 10. Dorset | 21. Lancashire | 32. South Wales | 43. Wiltshire |
| 11. Durham | 22. Leicestershire | 33. South Yorkshire |
Map notes
Source: Home Office, Police workforce, table 9.
4.1 Gender
There were 35,738 female police officers in the 43 police forces on 31 March 2015, an increase of 85 (0.2%) compared with a year earlier.
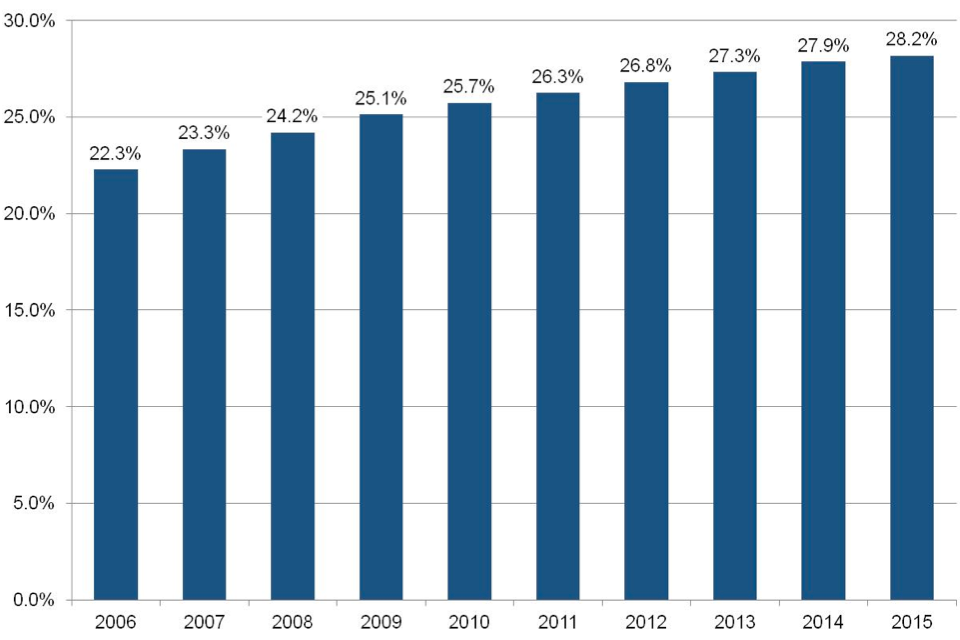
Figure 7 shows how the proportion of female police officers in the 43 forces has increased in recent years from 22.3% in 2006 to 28.2% in 2015.
Figure 7: Proportion of police officers who are female, as at 31 March 2006 to 2015, England and Wales1
Not provided.
Chart notes
1. Based on full-time equivalent figures for the 43 forces of England and Wales only.
Source: Home Office, Police workforce, table 1.
Of the 43 forces, Cumbria had the largest proportion of female officers (35.4%), followed by Surrey (33.2%) and Wiltshire (32.9%) (Table 1). City of London had the lowest proportion of female officers (22.5%), followed by Cleveland (24.1%) and Leicestershire (25.5%) (Table 1).
The proportion of those in senior ranks (i.e. chief inspector and above) who were women was 21.4% (up by 1.9 percentage points since March 2014), compared with 30.2% of women at constable rank (up by 0.1 percentage point since March 2014) (Table 2).
4.2 Ethnicity
There were 6,979 Minority Ethnic police officers in the 43 forces on 31 March 2015, an increase of 265 or 3.9% compared with a year earlier (Table 8).
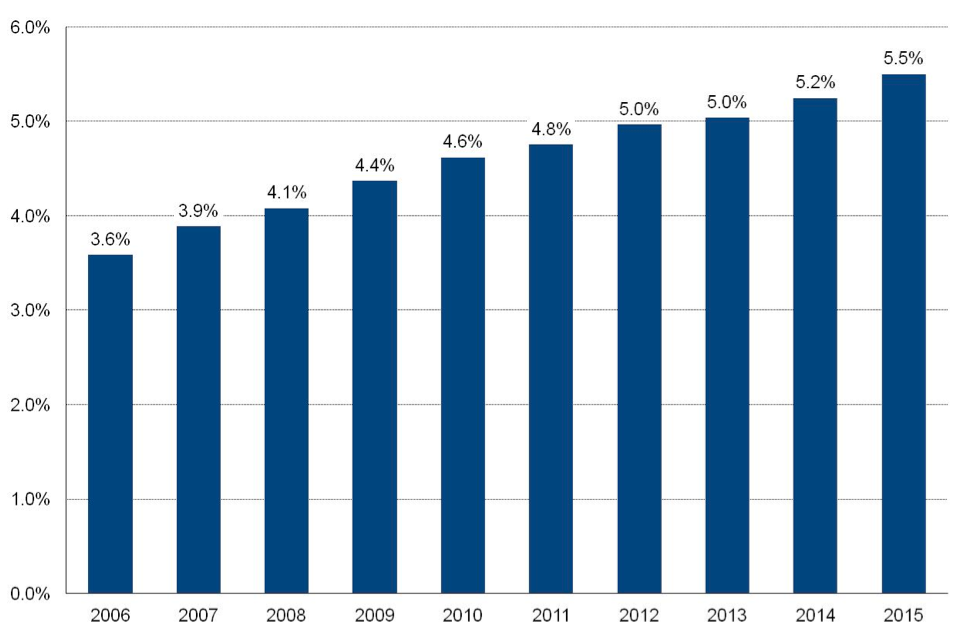
Figure 8 shows how the proportion of Minority Ethnic police officers has increased in recent years from 3.6% in 2006 to 5.5% in 2015.
Figure 8: Proportion of police officers who are Minority Ethnic, as at 31 March 2006 to 2015, England and Wales1
Not provided.
Chart notes
1. Based on full-time equivalent figures for the 43 forces of England and Wales only.
Source: Home Office, Police workforce, table 7.
Of the 43 forces, the Metropolitan Police had the largest proportion of Minority Ethnic officers (11.7%), followed by West Midlands (8.6%) and Leicestershire (7.2%) (Table 7). Cheshire had the lowest proportion of Minority Ethnic officers (0.6%), followed by Dyfed-Powys (0.7%) and North Wales (0.8%) (Table 7).
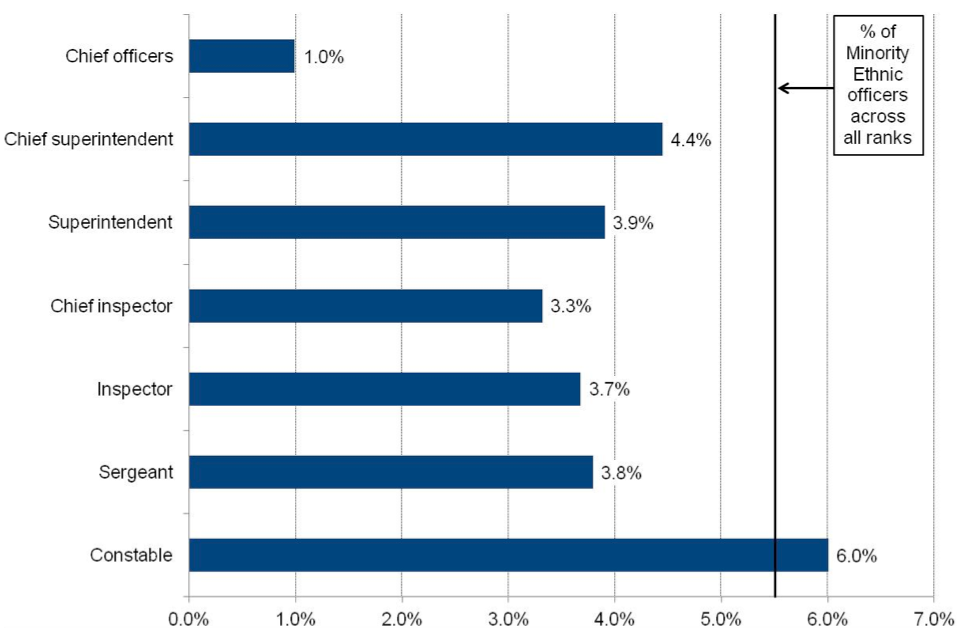
Figure 9 shows that senior ranks (i.e. chief inspector or above) had a lower proportion of Minority Ethnic officers compared to constables across the 43 police forces. For example, 3.4% of chief inspectors or above were Minority Ethnic, compared with 6.0% at constable rank.
Figure 9: Proportion of police officers who are Minority Ethnic, by rank1, as at 31 March 2015, England and Wales2
Not provided.
Chart notes
1. ‘Chief Officers’ includes Assistant Chief Constables, Deputy Chief Constables and Chief Constables, and their equivalents in the Metropolitan Police and City of London Police. These police officers were previously referred to as Association of Chief Police Officer (ACPO) ranks; however on 1 April 2015 ACPO was replaced by the National Police Chiefs’ Council (NPCC).
2. Based on full-time equivalent figures for the 43 forces of England and Wales only.
Source: Home Office, Police workforce, tables 4 and 7.
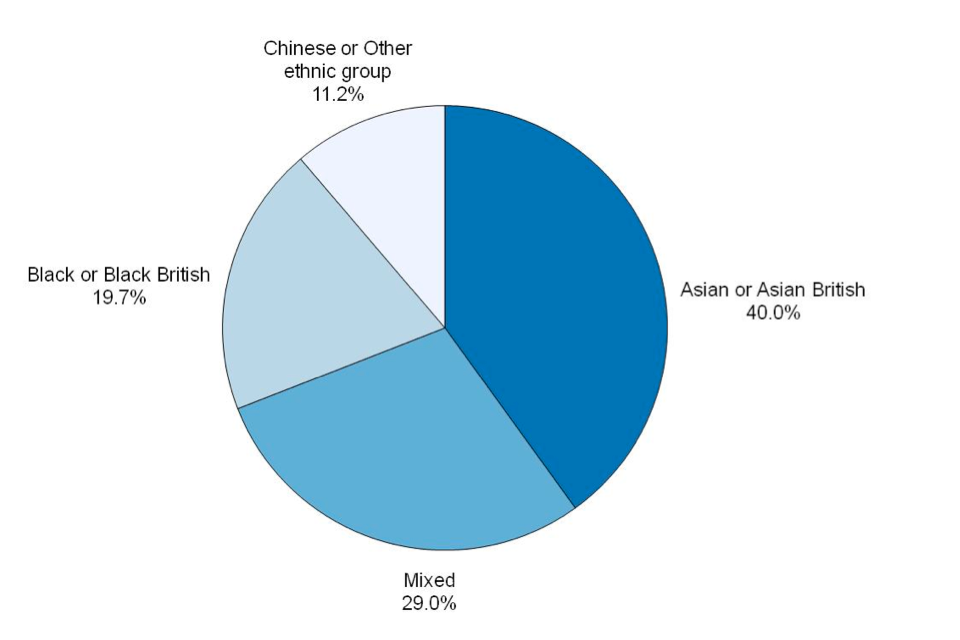
Figure 10 shows that, of those Minority Ethnic officers in the 43 police forces who indicated their ethnicity, 40.0% classified themselves as Asian or Asian British, 29.0% as Mixed, 19.7% as Black or Black British and 11.2% as Chinese or Other ethnic group.
Figure 10: Minority Ethnic officers, by ethnic group, as at 31 March 2015, England and Wales1, 2
Not provided.
Chart notes
1. Based on full-time equivalent figures for the 43 forces of England and Wales only.
2. Due to rounding, these percentages do not add up to 100.
Source: Home Office, Police workforce, table 8.
4.3 Frontline
Tables B and C show the number and proportion of police officers employed in operational frontline, operational support and business support roles as at 31 March in each year 2010 to 2015, respectively. These figures are calculated using the police officer functions data in supplementary table 1 and HM Inspectorate of Constabulary’s (HMIC’s) definition of each type of role.
Table B: Number of full-time equivalent police officers employed in operational frontline, operational support and business support roles, as at 31 March 2010 to 31 March 2015, England and Wales1, 2, 3
| 31 Mar 10 | 31 Mar 11 | 31 Mar 12 | 31 Mar 13 | 31 Mar 14 | 31 Mar 15 | |
|---|---|---|---|---|---|---|
| Operational frontline | 125,799 | 122,076 | 118,482 | 115,280 | 113,595 | 113,134 |
| Operational support | 10,862 | 10,743 | 9,922 | 8,773 | 8,004 | 7,279 |
| Business support | 4,880 | 4,205 | 3,572 | 3,264 | 2,877 | 3,125 |
Table notes
1. Relates to the 43 forces of England and Wales only.
2. These figures have been calculated using HM Inspectorate of Constabulary’s (HMIC’s) frontline policing model. This model excludes officers recorded under the ‘other’ function classification. The ‘other’ function classification includes police officers on maternity/paternity leave, career break, full time education or on suspension; and those on long-term leave (sickness, compassionate, special or unpaid). Further details on the frontline policing model can be found in HMIC’s ‘Policing in Austerity: Meeting the Challenge’ report.
3. Figures for 31 March 2010 to 2014 have previously been published by HMIC. The statistics presented here may differ slightly, as they will include any revisions to the data.
Source: Home Office, Police workforce, data tables.
Table C: Proportion of full-time equivalent police officers employed in operational frontline, operational support and business support roles, as at 31 March 2010 to 31 March 2015, England and Wales1, 2, 3
| 31 Mar 10 | 31 Mar 11 | 31 Mar 12 | 31 Mar 13 | 31 Mar 14 | 31 Mar 15 | |
| Operational frontline | 88.9% | 89.1% | 89.8% | 90.5% | 91.3% | 91.6% |
| Operational support | 7.7% | 7.8% | 7.5% | 6.9% | 6.4% | 5.9% |
| Business support | 3.4% | 3.1% | 2.7% | 2.6% | 2.3% | 2.5% |
Table notes
1. Relates to the 43 forces of England and Wales only.
2. These figures have been calculated using HM Inspectorate of Constabulary’s (HMIC’s) frontline policing model. This model excludes officers recorded under the ‘other’ function classification. The ‘other’ function classification includes police officers on maternity/paternity leave, career break, full time education or on suspension; and those on long-term leave (sickness, compassionate, special or unpaid). Further details on the frontline policing model can be found in HMIC’s ‘Policing in Austerity: Meeting the Challenge’ report.
3. Figures for 31 March 2010 to 2014 have previously been published by HMIC. The statistics presented here may differ slightly, as they will include any revisions to the data.
Source: Home Office, Police workforce, data tables.
On 31 March 2015, 113,134 or 91.6% of police officers were employed in operational frontline roles. Whilst the number of police officers in operational frontlines has been decreasing since 2010, the proportion of officers in frontline roles has been steadily rising.
4.4 Joiners
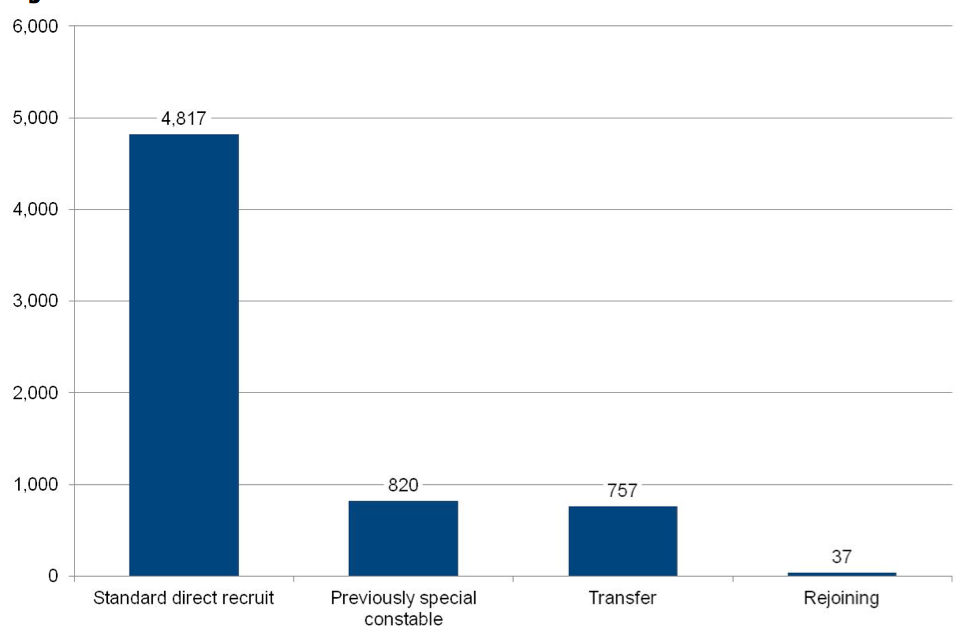
In the 12 months to 31 March 2015, 6,432 police officers joined the 43 police forces, accounting for 5.1% of officers, a rise of 0.7 percentage points compared with the previous year (Table 5a). Transfers between these forces comprised 11.8% of joiners (Table 5b and figure 11).
Figure 10 shows that the majority of police officer joiners between 1 April 2014 and 31 March 2015 were standard direct recruits (4,817 or 74.9%), meaning they were not transfers, re-joiners or were not previously special constables. The method through which police officers joined the police has changed over the last few years, with proportionally more officers being standard direct recruits and fewer officers who were previously special constables.
Figure 11: Police officer joiners, by joiner type, 1 April 2014 to 31 March 2015, England and Wales1
Not provided.
Chart notes
1. Based on full-time equivalent figures for the 43 forces of England and Wales only.
Source: Home Office, Police workforce, table 5b.
Of the joining officers, 30.8% were female, 8.8% were Minority Ethnic, and 98.1% of all joiners were constables. The 1.9% of joiners who came in at other ranks includes transfers, officers who had left and since re-joined and officers who have joined through the College of Policing’s Direct Entry Programme (Table 5a).
Bedfordshire had the most joiners in percentage terms (11.5% of officers in that force) in the year to 31 March 2015, followed by Dorset (10.1%) and Warwickshire (9.8%) (Table 5a). Gwent (0.1%), Suffolk (0.3%) and Durham (0.7%) had the fewest joiners in percentage terms.
4.5 Leavers
In the 12 months to 31 March 2015, 6,988 police officers left the 43 police forces (Table 6), representing a wastage rate (number of police officers leaving as a proportion of officers in post) of 5.5%, 0.1 percentage point higher than the previous year. Transfers between these forces accounted for 10.2% of leavers. Of the leaving officers, 22.2% were female and 4.1% were Minority Ethnic.
North Wales had the lowest wastage rate for the year (4.2%), followed by West Midlands (4.3%) and the Metropolitan Police (4.3%). Durham had the highest wastage rate (10.6%), followed by Northamptonshire (8.2%) and Kent (8.2%).
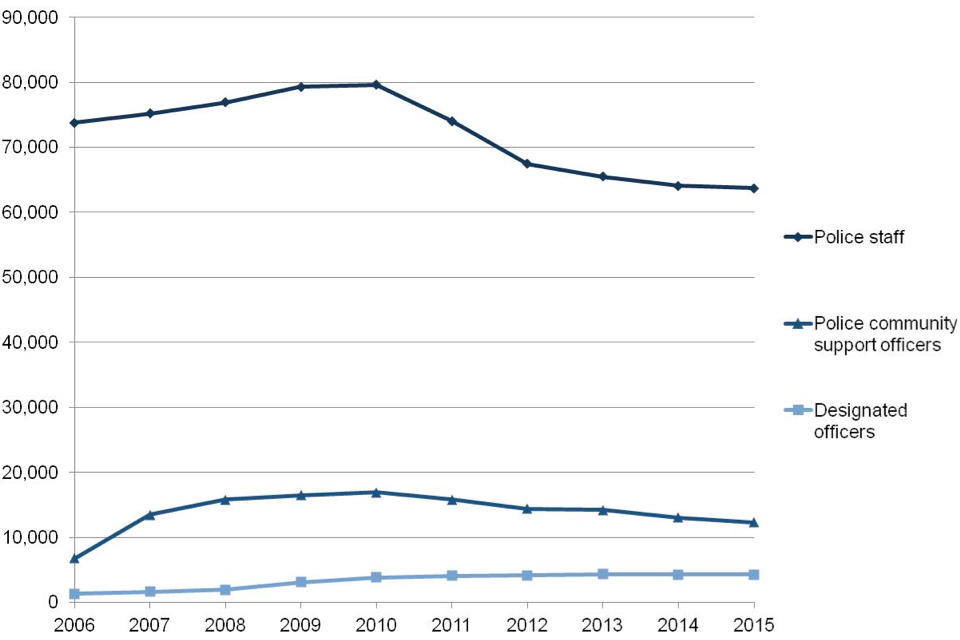
5. Other police workers
Figure 12 shows the trends in the number of other police worker types over the last 10 years. Police staff and police community support officer (PCSO) numbers generally increased between March 2006 and March 2010 but have decreased since. Designated officer numbers increased between March 2006 and March 2013 and have remained relatively stable over the last 2 years.
Figure 12: Police staff, police community support officers and designated officers, as at 31 March 2006 to 2015, England and Wales1, 2
Not provided.
Chart notes
1. Based on full-time equivalent figures for the 43 forces of England and Wales only.
2. This chart excludes traffic wardens due to the very small numbers, which reflects the dominant role of local authorities in parking control.
Source: Home Office, Police workforce, table 3.
The number of police staff, PCSOs and designated officers has fallen between 31 March 2014 and 2015, with the largest fall seen for PCSOs (5.6% or 735 PCSOs).
There were 18 traffic wardens in the 43 police forces on 31 March 2015, an increase of 2 compared with a year earlier (Table 3). The very small number of traffic wardens reflects the dominant role of local authorities in parking control.
The Metropolitan Police accounted for the largest proportion of police staff (16.6%), PCSOs (14.5%) and designated officers (16.9%) across all 43 forces as at 31 March 2015.
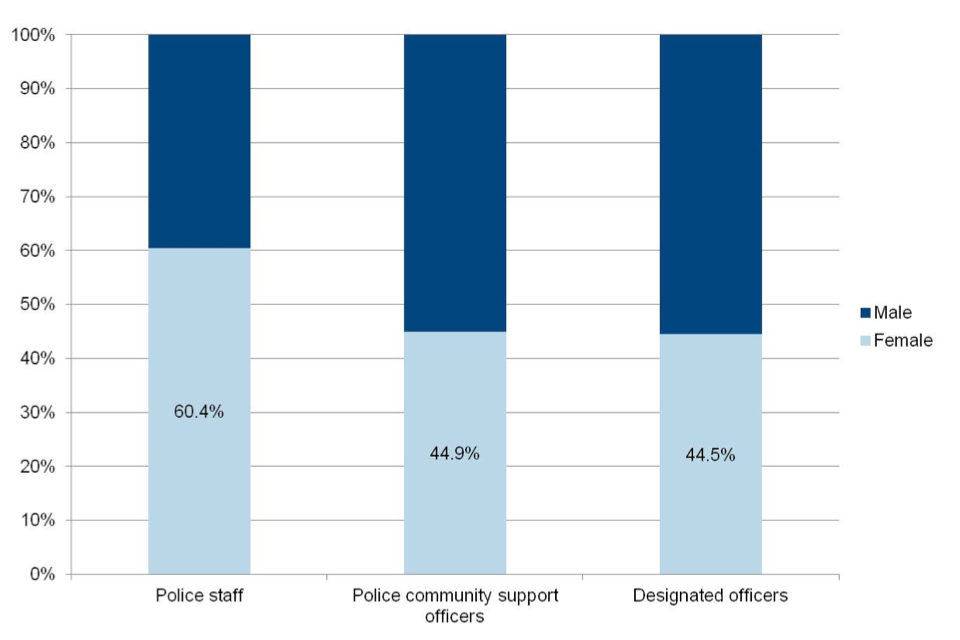
5.1 Gender
Figure 13 shows the proportions of female other police workers as at 31 March 2015. The proportion of female police staff, PCSOs and designated officers were higher than that for officers (28.2%), with police staff showing the highest proportion.
Figure 13: Proportion of female police staff, police community support officers and designated officers, as at 31 March 2015, England and Wales1, 2
Not provided.
Chart notes
1. Based on full-time equivalent figures for the 43 forces of England and Wales only.
2. This chart excludes traffic wardens due to the very small numbers, which reflects the dominant role of local authorities in parking control.
Source: Home Office, Police workforce, tables 14, 15 and 16.
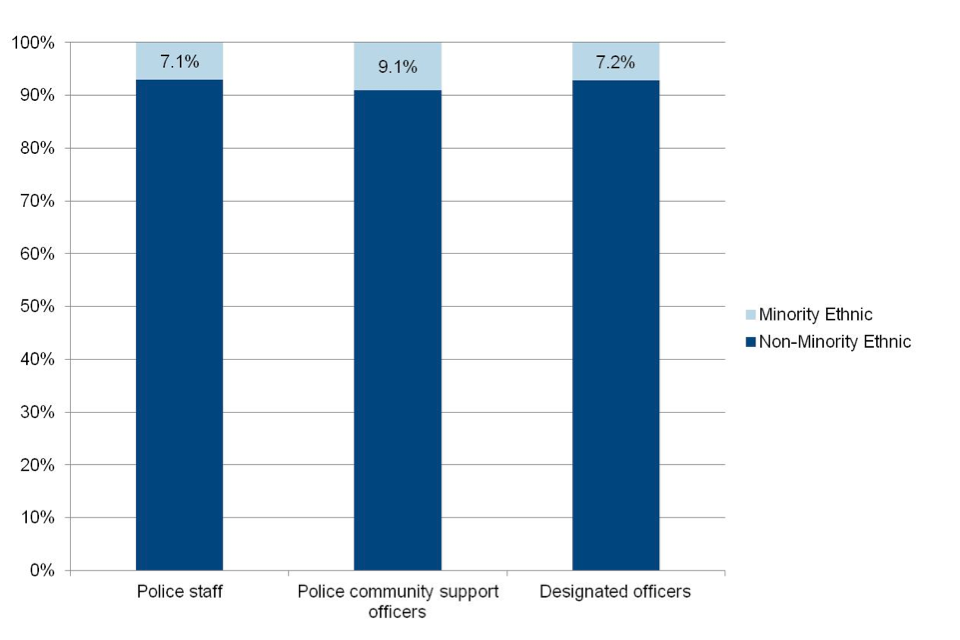
5.2 Ethnicity
Figure 14 shows the proportion of Minority Ethnic other police workers as at 31 March 2015. The proportions of Minority Ethnic police staff, PCSOs and designated officers were higher than that for officers (5.5%), with PCSOs showing the highest proportion.
Figure 14: Proportion of Minority Ethnic police staff, police community support officers and designated officers, as at 31 March 2015, England and Wales1, 2, 3
Not provided.
Chart notes
1. Based on full-time equivalent figures for the 43 forces of England and Wales only.
2. This chart excludes traffic wardens due to the very small numbers, which reflects the dominant role of local authorities in parking control.
3. Non-Minority Ethnic includes those who had not stated their ethnicity.
Source: Home Office, Police workforce, tables 14, 15 and 16.
5.3 Joiners and leavers
The joiner rates and wastage rates for police staff, PCSOs and designated officers were higher than that for officers (5.1% and 5.5% respectively) suggesting a higher turnover rate of these workers than for officers.
6. Special constables
Figure 15 shows that special constable numbers generally increased between March 2006 and March 2012, with the largest increases seen in March 2011 and March 2012. Since then, there have been large falls over the last three years.
Police forces have cited various reasons for falls in the special constable numbers over the last year (9.4% or 1,663 special constables), including specials leaving to become paid police officers, recruitment freezes and difficulty filling posts.
Figure 15: Special constables, as at 31 March 2006 to 2015, England and Wales1
Not provided.
Chart notes
1. Based on headcount figures for the 43 forces of England and Wales only.
Source: Home Office, Police workforce, table 3.
Females accounted for 30.7 per cent of all special constables, this is slightly higher than for police officers, but lower than other worker types.
Minority Ethnic special constables comprised 11.2 per cent of all special constables, considerably higher (5.7 percentage points) than for officers. Compared with a year earlier, the proportion of special constables who were Minority Ethnic rose by 0.3 percentage points.
In the year to 31 March 2015, 4,127 special constables joined the 43 police forces, accounting for 25.6 per cent of special constables. Over the same period, 5,110 special constables left, representing a wastage rate of 31.7 per cent. During the 12 months to 31 March 2015, 12.7 per cent of police officer joiners were previously special constables (Table 5b). These joiner and leaver rates are much higher than for other worker types, highlighting the higher turnover rate of special constables.
The Metropolitan Police had the most special constables with 3,659, accounting for 22.7 per cent of the total across all 43 forces.
7. Revisions analysis
The presented figures are correct at the time of publication and may include revisions submitted by forces for the years covered by, and received since the publication of, the previous year’s edition.
The table below shows that revisions to the 31 March 2014 figures published in July 2015 (first published in July 2014) have been small.
The decrease in special constables is due to Essex submitting a data correction.
Table: Police workforce,1 31 March 2014, full-time equivalents (except where specified)
| Published July 14 | Published July 15 | Revision (%) | |
|---|---|---|---|
| Police officers | 127,909 | 127,909 | N/A |
| Police staff2 | 64,097 | 64,097 | N/A |
| Police community support officers | 13,066 | 13,066 | N/A\ |
| Designated officers3 | 4,273 | 4,273 | N/A |
| Traffic wardens | 16 | 16 | N/A |
| Special constables4 | 17,789 | 17,764 | -0.1% |
- Relates to the 43 forces of England and Wales only.
- Excludes police community support officers, designated officers and traffic wardens.
- Excludes police community support officers.
- Headcount only.
This revisions analysis will be updated annually to coincide with each July publication.