Police workforce, England and Wales, 31 March 2014
Published 17 July 2014
Applies to England and Wales

© Crown copyright 2014
This publication is licensed under the terms of the Open Government Licence v3.0 except where otherwise stated. To view this licence, visit nationalarchives.gov.uk/doc/open-government-licence/version/3 or write to the Information Policy Team, The National Archives, Kew, London TW9 4DU, or email: psi@nationalarchives.gov.uk.
Where we have identified any third party copyright information you will need to obtain permission from the copyright holders concerned.
This publication is available at https://www.gov.uk/government/statistics/police-workforce-england-and-wales-31-march-2014/police-workforce-england-and-wales-31-march-2014
The Home Office is seeking feedback on this publication so that we can assess how well it meets our users’ needs and make improvements where possible. If you have not already done so, please could you complete a short five-minute survey.
1. Introduction
This release contains statistics on the numbers of police officers, police staff, police community support officers (PCSOs), designated officers, traffic wardens and special constables in post on 31 March 2014 in the 43 police forces of England and Wales and the British Transport Police.
The workforce figures in this release are all provided on a full-time equivalent (FTE) basis unless indicated otherwise.
See the ‘User Guide to Police Workforce Statistics’ for further information, including a glossary, conventions used and other background information. The user guide includes additional information on data quality and interpreting the figures, potential uses of the data and other data sources.
The data in this release can be found in the ‘Police Workforce, England and Wales, 31 March 2014’ tables.
2. Key facts
There were 209,362 police workers in the 43 police forces (of England and Wales) on 31 March 2014, a fall of 4,270 or 2.0 per cent compared with a year earlier (Table 3).
There were 127,909 police officers in the 43 police forces on 31 March 2014, a decrease of 1,674 or 1.3 per cent compared with a year earlier (Tables 1 and 3).
There were 6,715 Minority Ethnic police officers in the 43 police forces on 31 March 2014. This represents 5.2 per cent of the police officer total, a rise of 0.2 percentage points compared with a year earlier (Table 7).
There were 35,653 female police officers in the 43 forces on 31 March 2014. This represents 27.9 per cent of the police officer total, an increase of 0.6 percentage points compared with a year earlier.
There were 64,097 police staff in the 43 police forces on 31 March 2014, a fall of 1,412 or 2.2 per cent compared with a year earlier (Table 10).
There were 13,066 police community support officers (PCSOs) in the 43 police forces on 31 March 2014, a decrease of 1,139 or 8.0 per cent compared with a year earlier (Table 11).
There were 17,789 special constables (headcount) in the 43 police forces on 31 March 2014, a fall of 1,222 or 6.4 per cent compared with a year earlier (Table 13).
3. Police workforce
There were 209,362 police workers in the 43 police forces on 31 March 2014 (Table A), a decrease of 4,270 or 2.0 per cent compared with a year earlier. The headcount equivalent of police workers was 218,480, of which 210,290 or 96.3 per cent were available for duty on 31 March 2014 (see User Guide for definition).
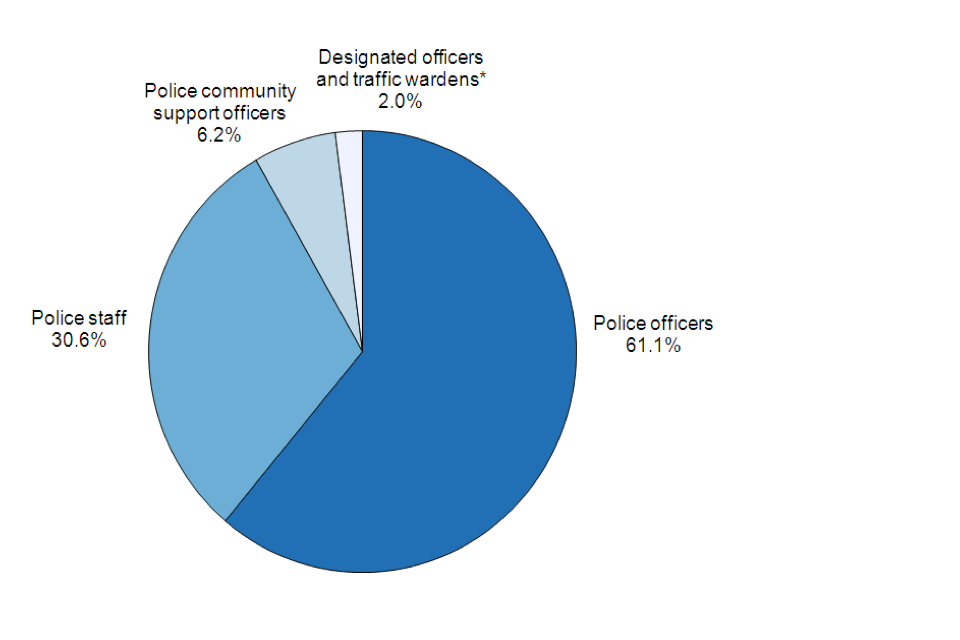
Police officers accounted for 61.1 per cent (see Figure 1) of police workers, an increase of 0.4 percentage points compared with the previous year. Police staff comprised 30.6 per cent of police workers, a decrease of 0.1 percentage point, whilst PCSOs made up 6.2 per cent, a decrease of 0.4 percentage points. Traffic wardens and designated officers (other than PCSOs) accounted for the smallest proportion of police workers at 2.0 per cent, the same proportion as the previous year.
In addition to the 209,362 police workers, there were 17,789 special constables (headcount) in the 43 police forces on 31 March 2014. Special constables do not have contracted working hours so their numbers are provided on a headcount rather than a FTE basis (Table 13).
Figure 1: Police workforce, by type of police worker, as at 31 March 2014, England and Wales1
Not provided.
Chart notes
- Based on full-time equivalent figures for the 43 forces of England and Wales only.
*Designated officers and traffic wardens account for 2.0% and 0.01% of the total police workforce respectively.
Source: Home Office, Police workforce table 3.
Table A: Police workforce, as at 31 March 2014, England and Wales1
| Rank | All staff (FTE) | All staff (headcount) | Staff available for duty (headcount) |
|---|---|---|---|
| Association of Chief Police Officers ranks | 204 | 204 | 203 |
| Chief superintendents | 358 | 359 | 354 |
| Superintendents | 763 | 764 | 749 |
| Chief inspectors | 1,778 | 1,781 | 1,755 |
| Inspectors | 5,932 | 5,962 | 5,838 |
| Sergeants | 19,767 | 20,013 | 19,517 |
| Constables | 99,107 | 101,431 | 97,229 |
| Total police ranks | 127,909 | 130,514 | 125,645 |
| Police staff2 | 64,097 | 70,054 | 67,278 |
| Police community support officers | 13,066 | 13,454 | 13,026 |
| Designated officers3 | 4,273 | 4,441 | 4,324 |
| Traffic wardens | 16 | 17 | 17 |
| Total police workforce | 209,362 | 218,480 | 210,290 |
| Special constabulary4 | - | 17,789 | - |
Table notes
- Relates to the 43 forces of England and Wales only.
- Excludes police community support officers, designated officers and traffic wardens.
- Excludes police community support officers.
- Headcount only.
Source: Home Office, Police workforce tables.
4. Police officers
There were 127,909 police officers in the 43 police forces on the 31 March 2014. In addition, the British Transport Police employed 2,912 police officers and 437 police officers were seconded to central services (Table 1).
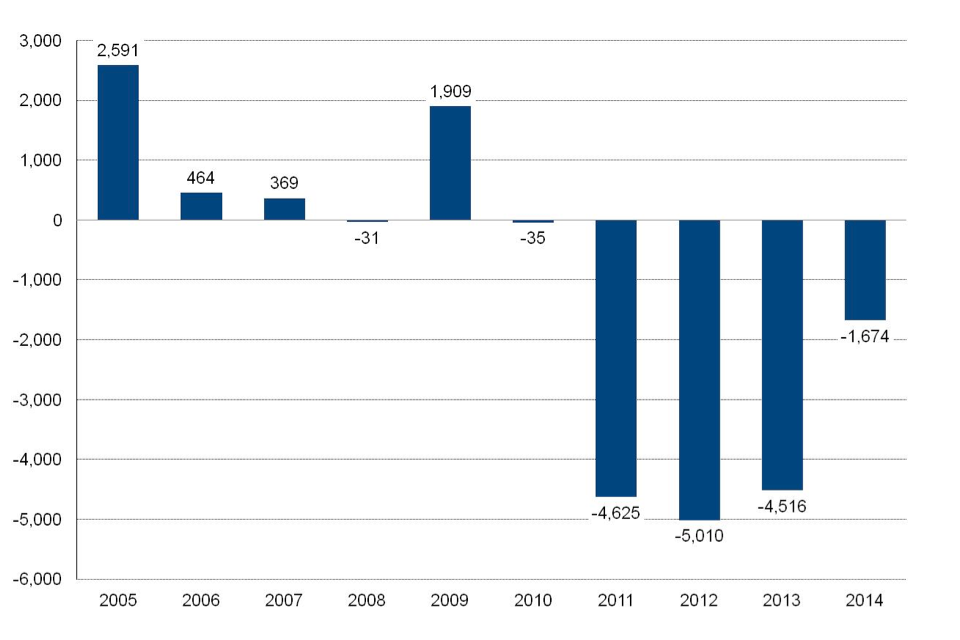
The number of police officers in the 43 forces decreased by 1,674 or 1.3 per cent compared with a year earlier, the fifth consecutive annual fall, and the lowest number since March 2002 (Figure 2, Table 3 and Supplementary Table 5).
Figure 2 shows that police officer numbers generally increased between March 2005 and March 2009 but have decreased since. The largest fall was in year ending March 2012 but the decreases have slowed more recently.
Figure 2: Change in the number of police officers, as at 31 March 2005 to 2014, compared with the previous 12 months, England and Wales1
Not provided.
Chart notes
- Based on full-time equivalent figures for the 43 forces of England and Wales only.
Source: Home Office, Police workforce table 3.
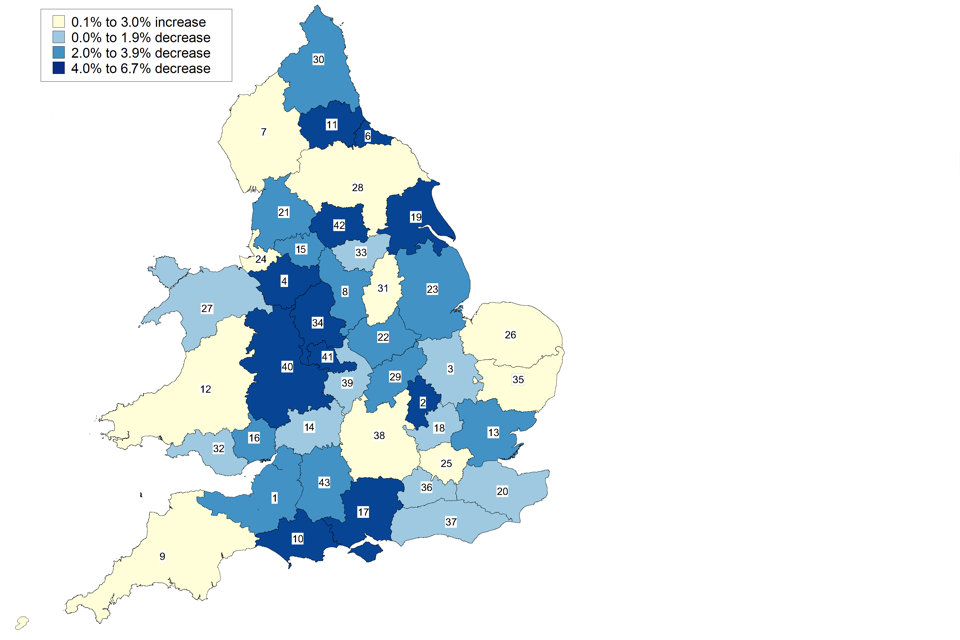
Officer numbers in the 43 police forces rose in the last 12 months in the following 10 forces: Cumbria; Devon and Cornwall; Dyfed-Powys; Merseyside; the Metropolitan Police; Norfolk; North Yorkshire; Nottinghamshire; Suffolk; and Thames Valley (Figure 3 and Table 9). Of these, Nottinghamshire (63 officers or 3.0%) had the largest increase in percentage terms, whilst the Metropolitan Police had the largest numerical increase (534 officers or 1.8%). Officer numbers also rose in the British Transport Police (260 officers or 9.8%).
Officer numbers decreased in the last 12 months in the remaining 33 forces. Bedfordshire (-73 officers or -6.7%) fell the most in percentage terms, whilst West Midlands Police (-327 officers or -4.3%) experienced the largest numerical decrease (Figure 3 and Table 9).
The Metropolitan Police had the most officers, accounting for 24.2 per cent of all officers across the 43 forces on 31 March 2014. The 8 metropolitan forces (City of London, Greater Manchester, Merseyside, Metropolitan Police, Northumbria, South Yorkshire, West Midlands and West Yorkshire) comprised 47.8 per cent of all officers (Table 9).
Figure 3: Police officers, percentage change between March 2013 and March 2014, England and Wales
Not provided.
Map notes
| 1. Avon and Somerset | 12. Dyfed-Powys | 23. Lincolnshire | 34. Staffordshire |
| 2. Bedfordshire | 13. Essex | 24. Merseyside | 35. Suffolk |
| 3. Cambridgeshire | 14. Gloucestershire | 25. Metropolitan Police and City | 36. Surrey |
| 4. Cheshire | 15. Greater Manchester | 26. Norfolk | 37. Sussex |
| 5. City of London (see 25) | 16. Gwent | 27. North Wales | 38. Thames Valley |
| 6. Cleveland | 17. Hampshire | 28. North Yorkshire | 39. Warwickshire |
| 7. Cumbria | 18. Hertfordshire | 29. Northamptonshire | 40. West Mercia |
| 8. Derbyshire | 19. Humberside | 30. Northumbria | 41. West Midlands |
| 9. Devon and Cornwall | 20. Kent | 31. Nottinghamshire | 42. West Yorkshire |
| 10. Dorset | 21. Lancashire | 32. South Wales | 43. Wiltshire |
| 11. Durham | 22. Leicestershire | 33. South Yorkshire |
Source: Home Office, Police workforce table 9.
4.1 Gender
There were 35,653 female police officers in the 43 police forces on 31 March 2014, an increase of 252 or 0.7 per cent compared with a year earlier. Female police officers represented 27.9 per cent of officers, an increase of 0.6 percentage points compared with a year earlier.
The proportion of women in senior ranks (i.e. chief inspector and above) was 19.5 per cent (up by 1.6 percentage points since March 2013), compared with 30.1 per cent of women at constable rank (up by 0.4 percentage points since March 2013) (Table 2).
4.2 Ethnicity
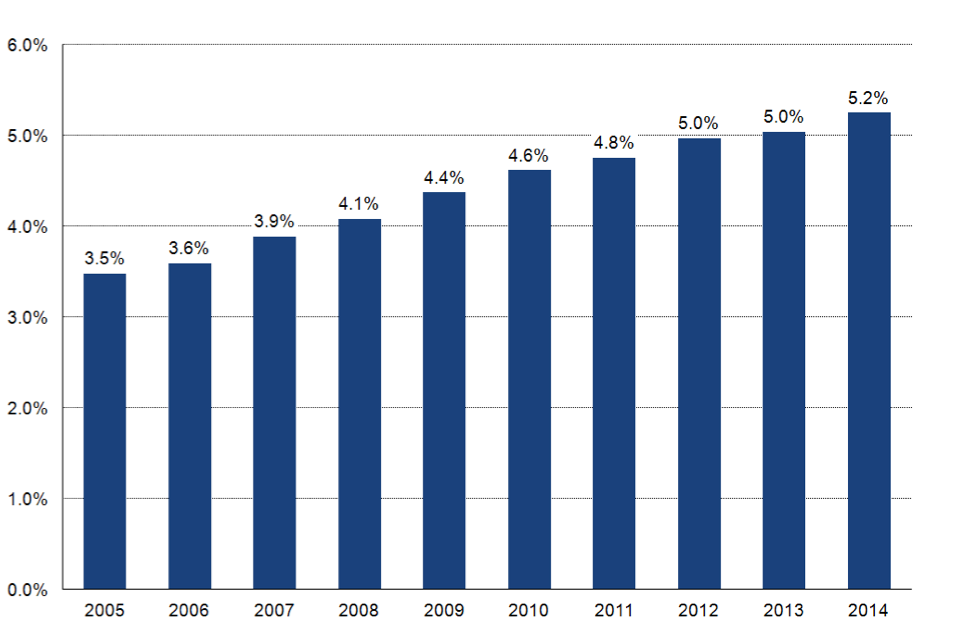
There were 6,715 Minority Ethnic police officers in the 43 forces on 31 March 2014, an increase of 178 or 2.7 per cent compared with a year earlier. Minority Ethnic police officers accounted for 5.2 per cent of all officers, a rise of 0.2 percentage points compared with a year earlier. A small proportion (1.7%) of officers had not stated their ethnicity, a rise of 0.1 percentage point compared with a year earlier (Table 8).
Figure 4 shows how the proportion of Minority Ethnic officers in the 43 forces has increased in recent years from 3.5 per cent in 2005 to 5.2 per cent in 2014 (a rise of 1.7 percentage points).
Figure 4: Proportion of officers who are Minority Ethnic, as at 31 March 2005 to 2014, England and Wales1
Not provided.
Chart notes
- Based on full-time equivalent figures for the 43 forces of England and Wales only.
Source: Home Office, Police workforce table 7.
Of the 43 forces, the Metropolitan Police had the largest proportion of Minority Ethnic officers (11.0%), followed by West Midlands (8.4%) and Leicestershire (7.3%) (Table 7). Cheshire had the lowest proportion of Minority Ethnic officers (0.7%), followed by Dyfed-Powys (0.8%), North Wales (0.9%) and North Yorkshire (0.9%) (Table 7).
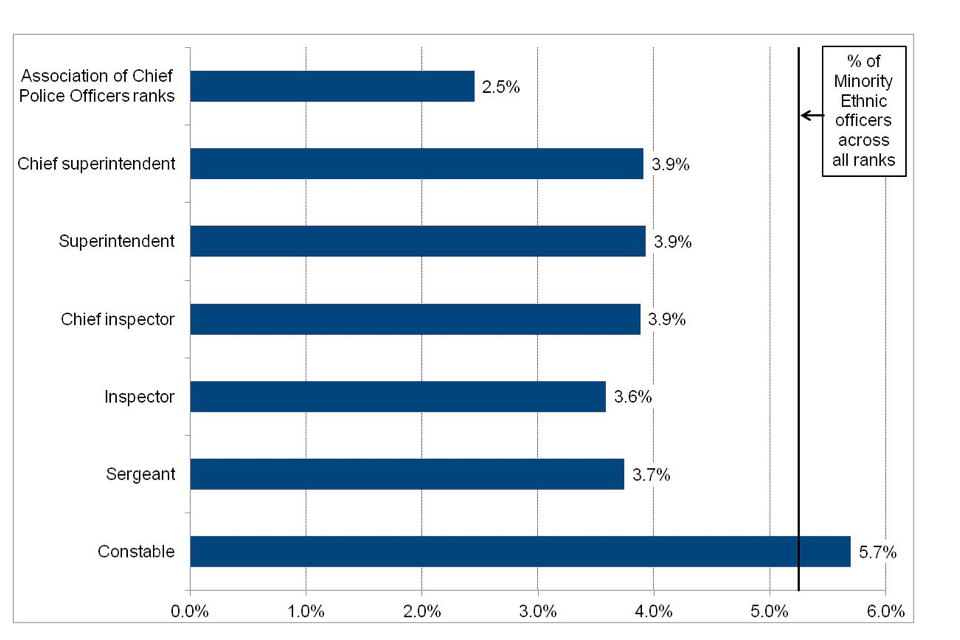
Figure 5 shows that there was a lower proportion of Minority Ethnic officers in senior ranks i.e. chief inspector or above (3.8%) compared with constables (5.7%) in the 43 police forces.
Figure 5: Proportion of police officers who are Minority Ethnic, by rank, as at 31 March 2014, England and Wales1
Not provided.
Chart notes
- Based on full-time equivalent figures for the 43 forces of England and Wales only.
Source: Home Office, Police workforce tables 4 and 7.
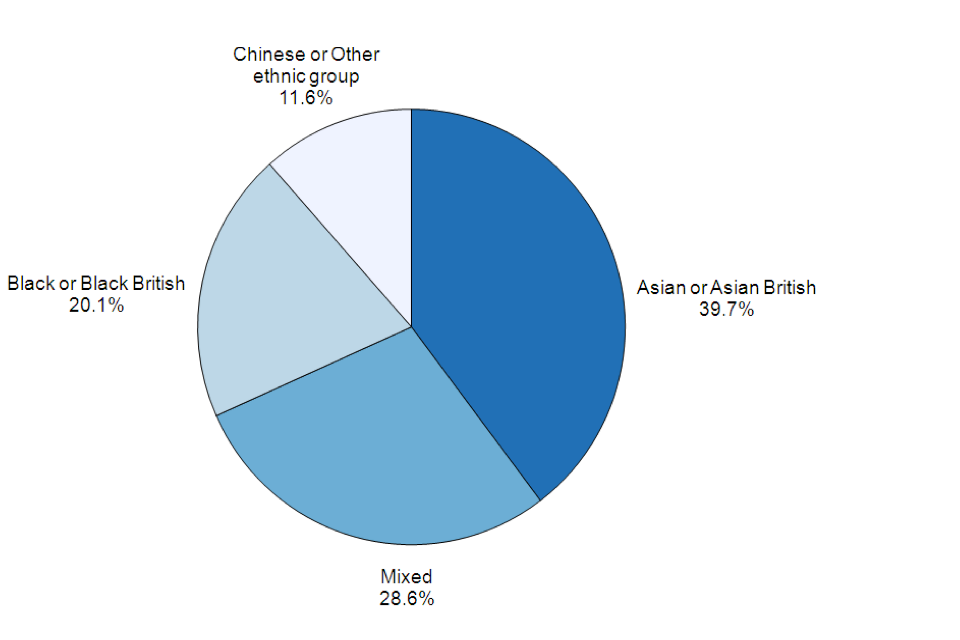
Figure 6 shows that, of those officers in the 43 police forces who indicated their ethnicity, 39.7 per cent classified themselves as Asian or Asian British, 28.6 per cent as Mixed, 20.1 per cent as Black or Black British and 11.6 per cent as Chinese or Other ethnic group.
Figure 6: Minority Ethnic officers, by ethnic group, as at 31 March 2014, England and Wales1, 2
Not provided.
Chart notes
- Based on full-time equivalent figures for the 43 forces of England and Wales only.
- Based on 125,785 out of 127,909 police officers who stated their ethnicity.
Source: Home Office, Police workforce table 8.
4.3 Joiners
In the 12 months to 31 March 2014, 5,589 police officers joined the 43 police forces, accounting for 4.4 per cent of officers, a rise of 2.6 percentage points compared with the previous year (Table 5). Transfers between these forces comprised 15.0 per cent of joiners.
Of the joining officers, 32.4 per cent were female, 8.6 per cent were Minority Ethnic, and 98.8 per cent of all joiners were constables. New recruits start as constables, so the 1.2 per cent of joiners who came in at other ranks were transfers or officers who had left and since re-joined (Table 5).
Cumbria had the most joiners in percentage terms (9.6% of officers in that force) in the year to 31 March 2014, followed by Nottinghamshire (8.1%) and the Metropolitan Police (7.6%) (Table 5). West Midlands had no joiners in the year to 31 March 2014, whilst Cleveland (0.1%) followed by Durham (0.5%) had the fewest joiners in percentage terms.
4.4 Leavers
In the 12 months to 31 March 2014, 6,904 police officers left the 43 police forces (Table 6), representing a wastage rate (number of police officers leaving as a proportion of officers in post) of 5.4 per cent, 0.1 percentage point more than the previous year. Transfers between these forces accounted for 11.7 per cent of leavers. Of the leaving officers, 19.7 per cent were female and 4.5 per cent were Minority Ethnic.
Devon and Cornwall had the lowest wastage rate for the year (3.4%), followed by Greater Manchester (4.2%) and Cambridgeshire (4.2%). Bedfordshire had the highest wastage rate (9.0%), followed by the City of London (8.4%) and Leicestershire (7.5%).
5. Police staff
There were 64,097 police staff in the 43 police forces on 31 March 2014, a decrease of 1,412 or 2.2 per cent compared with a year earlier (Table 10).
Females accounted for 60.3 per cent of all police staff, 32.5 percentage points more than for officers. Compared with a year earlier, the proportion of police staff who were female fell by 0.1 percentage point.
Minority Ethnic police staff comprised 7.0 per cent of all police staff, 1.7 percentage points more than for officers. Compared with a year earlier, the proportion of police staff who were Minority Ethnic fell by 0.2 percentage points.
In the year to 31 March 2014, 4,955 police staff joined the 43 police forces, accounting for 7.7 per cent of staff; 6,358 staff left, representing a wastage rate of 9.9 per cent.
The Metropolitan Police had the most staff with 11,303, accounting for 17.6 per cent of the total across all 43 forces.
6. Police community support officers
There were 13,066 police community support officers (PCSOs) in the 43 police forces on 31 March 2014, a decrease of 1,139 or 8.0 per cent compared with a year earlier (Table 11).
Females accounted for 44.6 per cent of all PCSOs, 16.7 percentage points more than for officers. Compared with a year earlier, the proportion of PCSOs who were female fell by 0.1 percentage point.
Minority Ethnic PCSOs comprised 9.1 per cent of all PCSOs, 3.9 percentage points more than for officers. Compared with a year earlier, the proportion of PCSOs who were Minority Ethnic fell by 0.4 percentage points.
In the year to 31 March 2014, 1,225 PCSOs joined the 43 police forces, accounting for 9.4 per cent of PCSOs; 2,036 PCSOs left, representing a wastage rate of 15.6 per cent.
The Metropolitan Police had the most PCSOs with 2,087, accounting for 16.0 per cent of the total across all 43 forces.
7. Designated officers (excluding police community support officers)
There were 4,273 designated officers in the 43 police forces on 31 March 2014, a decrease of 40 or 0.9 per cent compared with a year earlier (Table 12).
Females accounted for 43.7 per cent of all designated officers, 15.8 percentage points more than for officers, and the same proportion compared with a year earlier.
Minority Ethnic designated officers comprised 6.9 per cent of all designated officers, 1.6 percentage points more than for officers, and the same proportion compared with a year earlier.
In the year to 31 March 2014, 356 designated officers joined the 43 police forces, accounting for 8.3 per cent of designated officers; 474 designated officers left, representing a wastage rate of 11.1 per cent.
The Metropolitan Police had the most designated officers with 695, accounting for 16.3 per cent of the total across all 43 forces.
8. Traffic wardens
There were 16 traffic wardens in the 43 police forces on 31 March 2014, a decrease of 5 compared with a year earlier (Table 3). The very small number of traffic wardens reflects the dominant role of local authorities in parking control.
9. Special constabulary
There were 17,789 special constables in the 43 police forces on 31 March 2014, a decrease of 1,222 or 6.4 per cent compared with a year earlier (Table 13).
Females accounted for 30.8 per cent of all special constables, 2.9 percentage points more than for officers, and the same proportion compared with a year earlier.
Minority Ethnic special constables comprised 10.8 per cent of all special constables, 5.6 percentage points more than for officers. Compared with a year earlier, the proportion of special constables who were Minority Ethnic fell by 0.1 percentage point.
In the year to 31 March 2014, 4,804 special constables joined the 43 police forces, accounting for 27.0 per cent of special constables. During the 12 months to 31 March 2014, 23.8 per cent of police officer joiners were previously special constables (Table 17).
In the year to 31 March 2014, 5,515 special constables left, representing a wastage rate of 31.0 per cent. The Metropolitan Police had the most special constables with 4,587, accounting for 25.8 per cent of the total across all 43 forces.
10. Revisions analysis
The presented figures are correct at the time of publication and may include revisions submitted by forces for the years covered by, and received since the publication of, the previous year’s edition.
The table below shows that revisions to the 31 March 2013 figures published in July 2014 (first published in July 2013) have been small.
The increase for the designated officers’ total is due to Northamptonshire submitting a revised figure that included designated officers previously not recorded on their Human Resources system.
The police staff decrease is due to Northamptonshire submitting a data correction. However, West Midlands did submit a data correction that partially offset Northamptonshire’s revision.
Table B: Police Workforce,1 31 March 2013, full-time equivalents (except where specified)
| Published July 13 | Published July 14 | Revision (%) | |
| Police officers | 129,584 | 129,584 | N/A |
| Police staff2 | 65,573 | 65,509 | -0.1 |
| Police community support officers | 14,205 | 14,205 | N/A |
| Designated officers3 | 4,237 | 4,314 | 1.8 |
| Traffic wardens | 21 | 21 | N/A |
| Special constables4 | 19,011 | 19,011 | N/A |
Table notes
- Relates to the 43 forces of England and Wales only.
- Excludes police community support officers, designated officers and traffic wardens.
- Excludes police community support officers.
- Headcount only.
This revisions analysis will be updated annually to coincide with each July publication.