Police workforce, England and Wales, 31 March 2013
Published 18 July 2013
Applies to England and Wales
1. Introduction
Statistics are presented here on the numbers of officers and staff employed by the police. The data are on a financial year basis, and are drawn from returns from the 43 local police forces in England and Wales, and the British Transport Police. They cover the number of full-time equivalent officers and staff in post on 31 March 2013, as well as the numbers of officers and staff joining and leaving in the 12 months to 31 March 2013. These data are broken down by rank of officer, gender and self-defined ethnicity.
The User Guide provides further details relating to definitions.
2. Key facts
There were 129,584 full-time equivalent (FTE) police officers in the 43 police forces of England and Wales as at 31 March 2013. This is a decrease of 3.4% or 4,516 officers compared to a year earlier (Table 1 and 3).
There were 6,537 FTE Minority Ethnic officers in the 43 forces of England and Wales. This represents 5.0% of the total police officers, the same percentage as on 31 March 2012 (Table 7).
FTE police staff numbers for the 43 forces of England and Wales stood at 65,573, a decrease of 2.8% or 1,899 compared to a year earlier (Table 10a).
The total number of FTE police community support officers in the 43 police forces of England and Wales was 14,205, a decrease of 1.3% or 188 on the previous year (Table 10a).
There were 19,011 special constables as at 31 March 2013, 6.5% or 1,332 fewer than the previous year (Tables A and 11). Figure 1: Total police officers in 43 English and Welsh forces (full-time equivalent), change in number of officers from the previous year
Figure 1: Total police officers in 43 English and Welsh forces (full-time equivalent), change in number of officers from the previous year
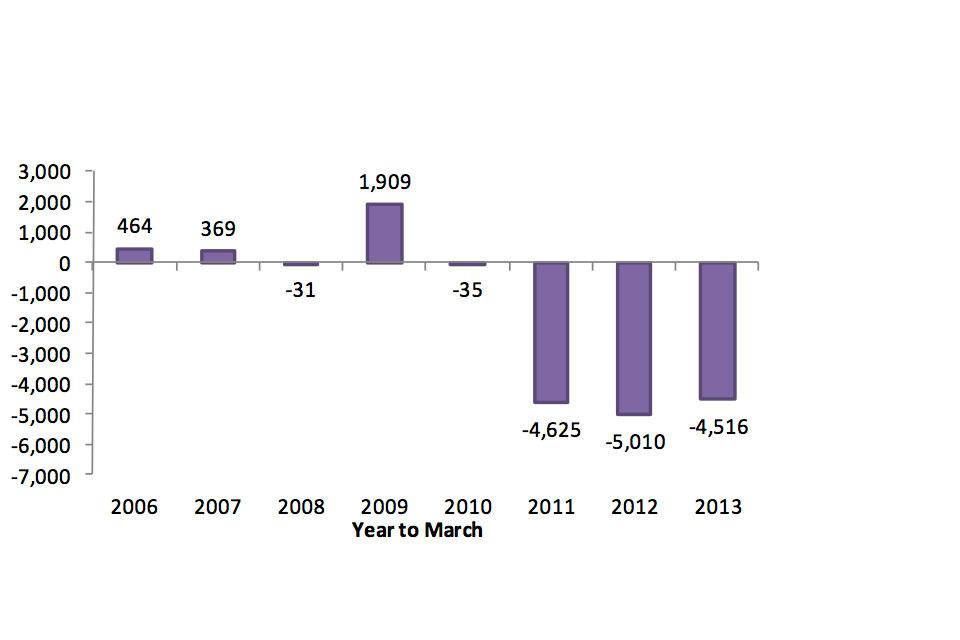
Total police officers change in number of officers from the previous year, 2006 464, 2007 369, 2008 -31, 2009 1909, 2010 -35, 2011 -4625, 2012 -5010, 2013 -4516.
Chart notes
Source: Home Office, Police workforce tables, Table 1
3. Data tables
Data on police officers in post, police officer joiners and leavers, Minority Ethnic officers, police officers by ethnicity, police staff, police community support officers, designated officers (S.38, S.39), traffic wardens and special constables sourced from returns received from the 43 police forces in England and Wales, plus the British Transport Police, can be found in the tables for ‘Police workforce, England and Wales, 31 March 2013’.
4. Police workforce
As at 31 March 2013 there were 213,620 full-time equivalent (FTE) police workers in the 43 police forces of England and Wales. Police officers accounted for 60.7% of this total, police community support officers (PCSOs) 6.6%, traffic wardens and designated officers (other than PCSOs) 2.0% and other police staff 30.7% (Figure 2 and Table A).
The headcount equivalent of 213,620 FTE police workers was 222,697. This relates to the actual numbers of people employed by the police whether full- or part-time, and of this total 214,087 or 96.1% were available for duty on 31 March 2013 (please see the User Guide for definition).
Definitions of each of the workforce categories and measures are contained in the User Guide.
In addition, there were 19,011 special constables providing a voluntary police resource to police forces and local communities in England and Wales. Special constables provide at least four hours a week to their force but do not have contracted hours; hence their numbers are shown here as headcount rather than FTE (Table 11).
Figure 2: Police workforce by type of police worker, England and Wales, as at 31 March 2013
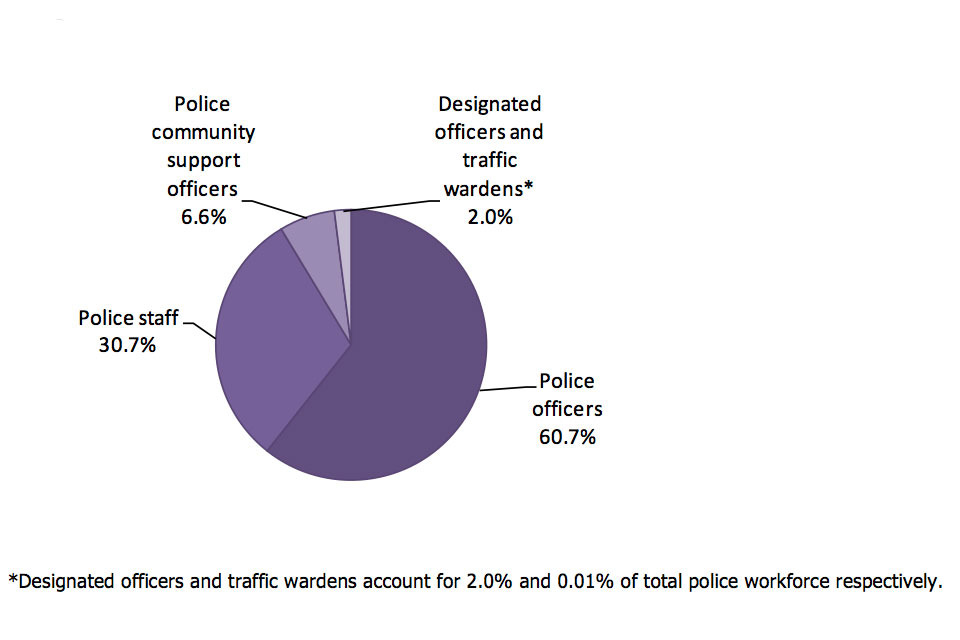
Police workforce by type of police worker, police community support officers 6.6%, designated officers and traffic wardens 2%, police officers 60.7%, police staff 30.7%.
Chart notes
Source: Home Office, Police workforce tables, Tables 1, 10a and 10b.
Table A: Police workforce, England and Wales, as at 31 March 2013
| Rank | All staff (FTE) | All staff (headcount) | Staff available for duty (headcount) |
| ACPO ranks | 201 | 201 | 201 |
| Chief superintendents | 366 | 366 | 363 |
| Superintendents | 819 | 820 | 809 |
| Chief inspectors | 1,801 | 1,802 | 1,776 |
| Inspectors | 6,280 | 6,314 | 6,182 |
| Sergeants | 20,499 | 20,750 | 20,210 |
| Constables | 99,619 | 101,870 | 97,621 |
| Total police ranks | 129,584 | 132,123 | 127,162 |
| Police staff (excl. PCSOs, TWs and DOs S.38, S.39) | 65,573 | 71,575 | 68,721 |
| Police community support officers (PCSOs) | 14,205 | 14,588 | 13,921 |
| Traffic wardens (TWs) | 21 | 23 | 23 |
| Designated officers (DOs S.38, S.39) (excl. PCSOs) | 4,237 | 4,388 | 4,260 |
| Total police workforce | 213,620 | 222,697 | 214,087 |
| Special constabulary (headcount only) | - | 19,011 | - |
Table notes
Source: Home Office, Police workforce tables, Tables 1, 10a and 10b.
5. Police officers
As at 31 March 2013 there were 129,584 full-time equivalent (FTE) police officers in the 43 police forces of England and Wales. This is a decrease of 3.4% or 4,516 officers (FTE) compared with 31 March 2012. It is the fourth consecutive annual fall in the officer total, with the 31 March 2013 figure being 14,186 or 9.9% lower than that for 31 March 2009. It is also the lowest total since 2002 (Figure 1 and Tables 1).
In addition, the British Transport Police employed 2,652 officers across England and Wales on 31 March 2013, and a further 372 were seconded to central services such as the former National Policing Improvement Agency, the College of Policing, or HM Inspectorate of Constabulary (Table 1).
There were 132,608 police officers, including officers from the British Transport Police and those seconded to central services, as at 31 March 2013. This is a decrease of 3.3% or 4,528 officers (FTE) compared with 31 March 2012 (Table 1).
In all 7 forces, British Transport Police, Cambridgeshire, Cheshire, Derbyshire, Northamptonshire, North Wales and Suffolk, increased their total officers in the 12 months to 31 March 2013 (Figure 6 and Table 9).
The other 37 forces in England and Wales reported falls in officer numbers over the 12 months to 31 March 2013. The largest decreases in percentage terms were in the City of London (down 6.8% or 57 officers) and Staffordshire (down 6.1% or 118 officers). The largest numerical decrease was in the Metropolitan Police (down 5.4% or 1,742 officers) (Figure 6 and Table 9).
The Metropolitan Police is the largest force, accounting for 23.5% of all officers on 31 March 2013. The eight Metropolitan forces (City of London, Greater Manchester, Merseyside, Metropolitan Police, Northumbria, South Yorkshire, West Midlands and West Yorkshire) accounted for 47.4% of all officers (Table 9).
The number of officers on secondment to central services shows a decrease from 479 at 31 March 2012 to 372 at 31 March 2013 (Table 9).
5.1 Gender
There were 35,471 female officers out of 129,956 officers in the 43 forces of England and Wales (including central service secondments), representing 27.3% of the total, compared with 26.8% in March 2012. The proportion of women in the more senior ranks of chief inspector and above was 18.0% (up from 16.3%), compared with 29.7% of women at constable rank (up from 29.4%) (Table 2).
5.2 Ethnicity
As at 31 March 2013 there were 6,555 Minority Ethnic police officers in the 43 forces of England and Wales (including central service secondments), accounting for 5.0% of all officers, which is the same as at March 2012 (Table 7). A small proportion (1.5%) of officers had not stated their ethnicity (Table 8).
Figure 3 shows how the proportion of Minority Ethnic officers in the 43 forces of England and Wales (excluding central service secondments) has increased in recent years. The number of Minority Ethnic officers decreased by 126 (1.9%) in the 12 months to 31 March 2013 (Table 7), and although the proportion was marginally up, it was unchanged on 5.0% when rounded.
Figure 3: Minority Ethnic officers as a proportion of all officers as at 31 March 2003 to 2013, in the 43 police forces of England and Wales (excluding central service secondments)
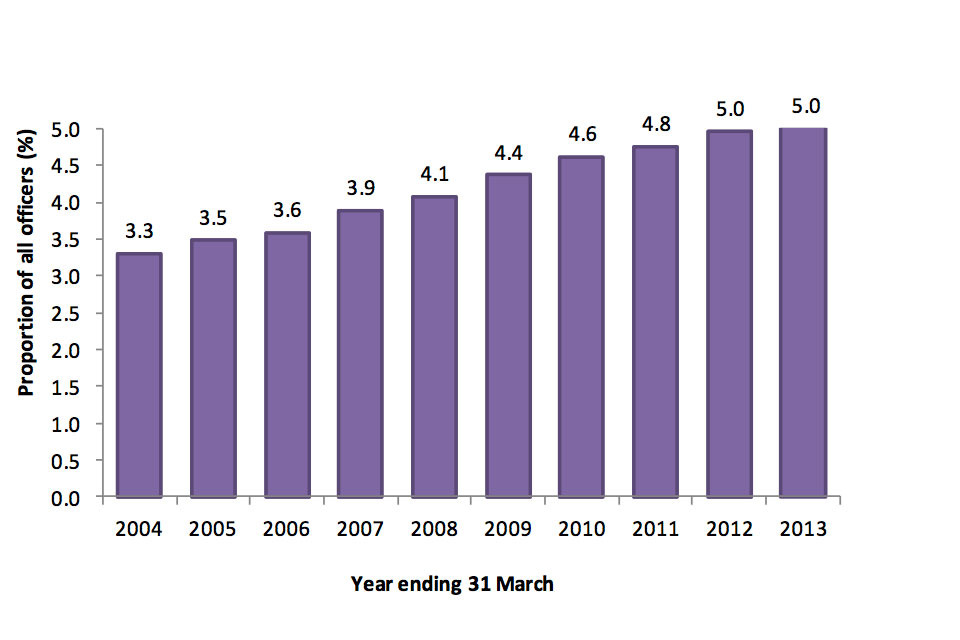
Minority Ethnic officers as a proportion of all officers, 2004 3.3%, 2005 3.5%, 2006 3.6%, 2007 3.9%, 2008 4.1%, 2009 4.4%, 2010 4.6%, 2011 4.8%, 2012 5%, 2013 5%.
Chart notes
Source: Home Office, Police workforce tables, Table 7.
The Metropolitan Police had the largest proportion of Minority Ethnic officers (10.5%), followed by West Midlands (8.3%), British Transport Police (7.5%) and Leicestershire (7.1%) (Table 7).
Minority Ethnic officers in the 43 police forces of England and Wales (including central service secondments) were under-represented at senior ranks (compared with other ranks), accounting for 3.8% of officers at the rank of chief inspector or above compared with 5.4% of constables (Figure 4).
Figure 4: Percentage of police officers who are Minority Ethnic of the 43 police forces of England and Wales (including central service secondments) by rank, as at 31 March 2013
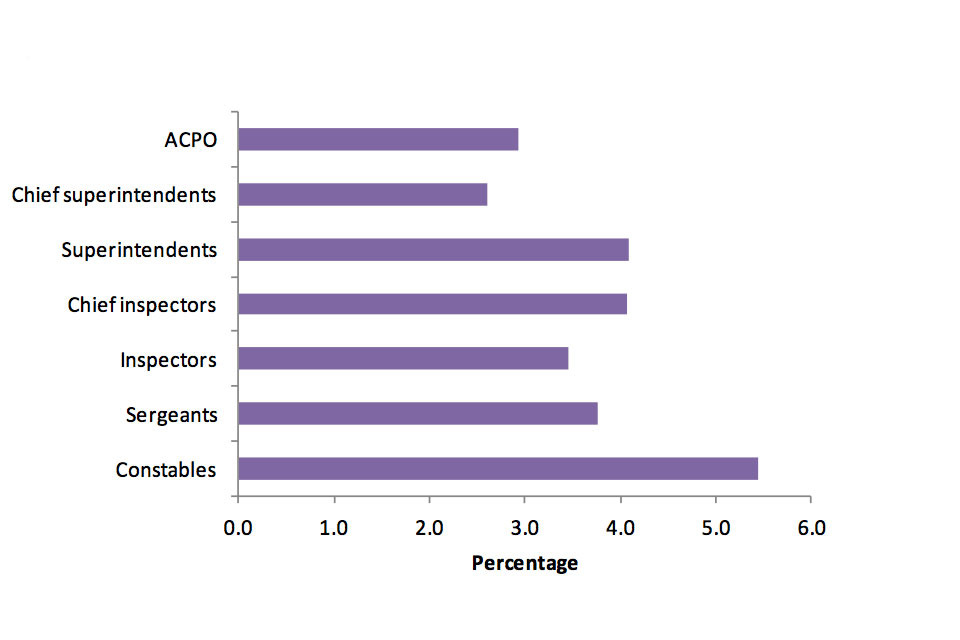
Percentage of police officers who are Minority Ethnic, Association of Chief Police Officers 3%, Chief Superintendents between 2 and 3%, Superintendents 4%, Chief Inspectors 4%, Inspectors between 3 and 4%, Sergeants between 3 and 4%, Constables between 5
Chart notes
Source: Home Office, Police workforce tables, Tables 4 and 7.
Figure 5 shows that, of those Minority Ethnic officers in the 43 police forces of England and Wales that stated their ethnicity, 39.2% classified themselves as Asian or Asian British, 28.5% as Mixed, 20.8% as Black or Black British and 11.5% as Chinese or Other ethnic group (these figures exclude central service secondments, as figures are not collected by ethnicity). These proportions vary by police force area (Table 8).
Figure 5: Minority Ethnic officers by ethnic group (excluding central service secondments and British Transport Police), England and Wales, as at 31 March 2013
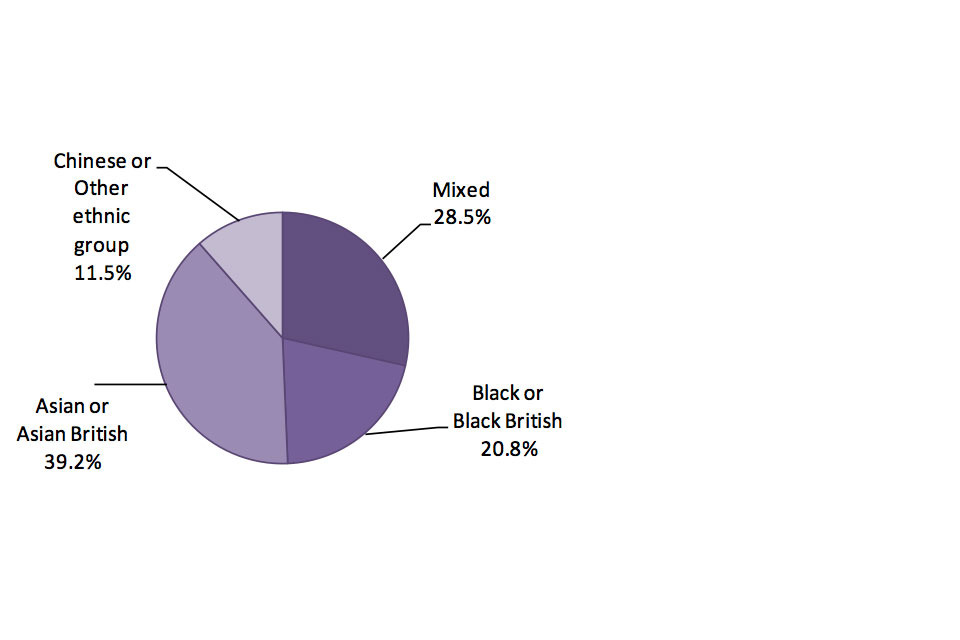
Minority Ethnic officers by ethnic group, Mixed 28.5%, Black or Black British 20.8%, Asian or Asian British 39.2%, Chinese or Other ethnic group 11.5%.
Chart notes
Source: Home Office, Police workforce tables, Table 8.
5.3 Joiners
In the 12 months to 31 March 2013 the 43 police forces in England and Wales recruited 2,358 full-time equivalent officers (Table 5). Transfers between Home Office forces accounted for 18.4% of these joiners.
Female officers accounted for 33.3% of joiners and 97.6% of all joiners came in at constable rank. New recruits to the police start as constables, so the 2.4% of all joiners who came in at other ranks are transfers or those who have left and then re-joined (Table 5).
Northamptonshire had the most joiners in percentage terms (6.8% of total officers) in the year to 31 March 2013, followed by Cambridgeshire (6.1%) and North Wales (6.1%) (Table 5).
5.4 Leavers
During the year to 31 March 2013, 6,848 full-time equivalent (FTE) officers left the 43 forces (Table 6). This total included officers transferring to other England and Wales forces, who are estimated to account for 6.9% of leavers.
The 6,848 FTE officers leaving represented a wastage rate of 5.3% (wastage rate is the total number of police officers leaving as a proportion of total officers in post). Cheshire had the lowest wastage rate for the year (3.2%) and Staffordshire had the highest (9.6%). Female officers’ wastage rate was lower than the overall rate, at 3.5%, as they accounted for 27.3% of officers in post on 31 March 2013, but only 17.9% of officers leaving. (Table 6).
Figure 6: Police officers (full-time equivalents), England and Wales, percentage change between March 2012 and March 2013
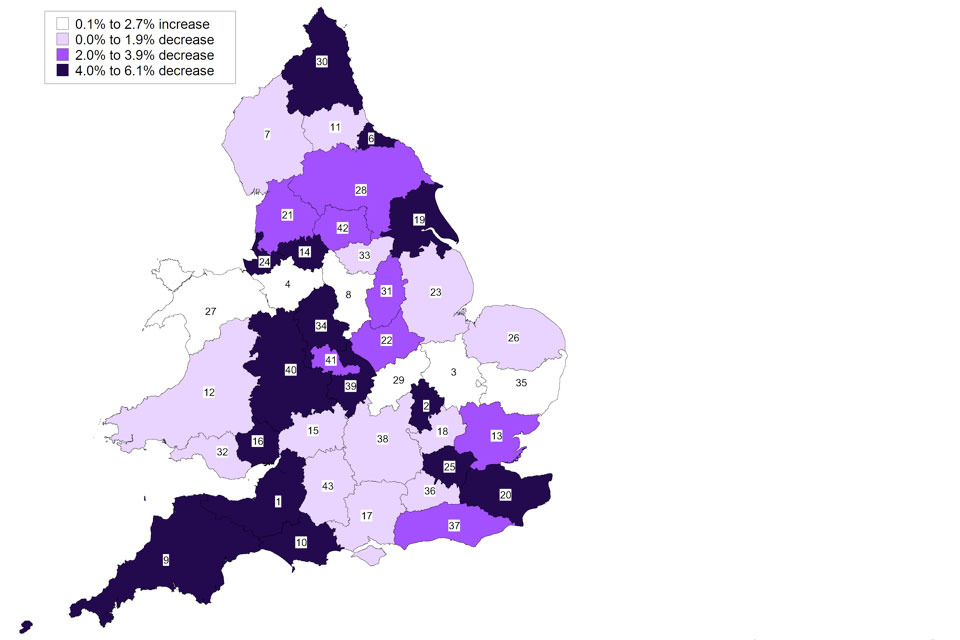
A map showing police officers percentage change between March 2012 and March 2013.
| 1. Avon and Somerset | 12. Dyfed-Powys | 23. Lincolnshire | 34. Staffordshire |
| 2. Bedfordshire | 13. Essex | 24. Merseyside | 35. Suffolk |
| 3. Cambridgeshire | 14. Greater Manchester | 25. Metropolitan and City | 36. Surrey |
| 4. Cheshire | 15. Gloucestershire | 26. Norfolk | 37. Sussex |
| 5. City of London (see 25) | 16. Gwent | 27. North Wales | 38. Thames Valley |
| 6. Cleveland | 17. Hampshire | 28. North Yorkshire | 39. Warwickshire |
| 7. Cumbria | 18. Hertfordshire | 29. Northamptonshire | 40. West Mercia |
| 8. Derbyshire | 19. Humberside | 30. Northumbria | 41. West Midlands |
| 9. Devon and Cornwall | 20. Kent | 31. Nottinghamshire | 42. West Yorkshire |
| 10. Dorset | 21. Lancashire | 32. South Wales | 43. Wiltshire |
| 11. Durham | 22. Leicestershire | 33. South Yorkshire |
Map notes
Source: Home Office, Police workforce tables, Table 9.
6. Police staff
As at 31 March 2013 there were 84,036 full-time equivalent (FTE) staff in all supporting roles in the 43 police forces of England and Wales (Tables 10a and 10b). This is a decrease of 2.2% from the previous year. Police community support officers (PCSOs) made up 16.9% of this total, designated officers made up 5.0%, and traffic wardens comprised a further 0.03% (Figure 7, Tables 10a and 10b).
Figure 7: Staff in supporting roles, England and Wales, as at 31 March 2013
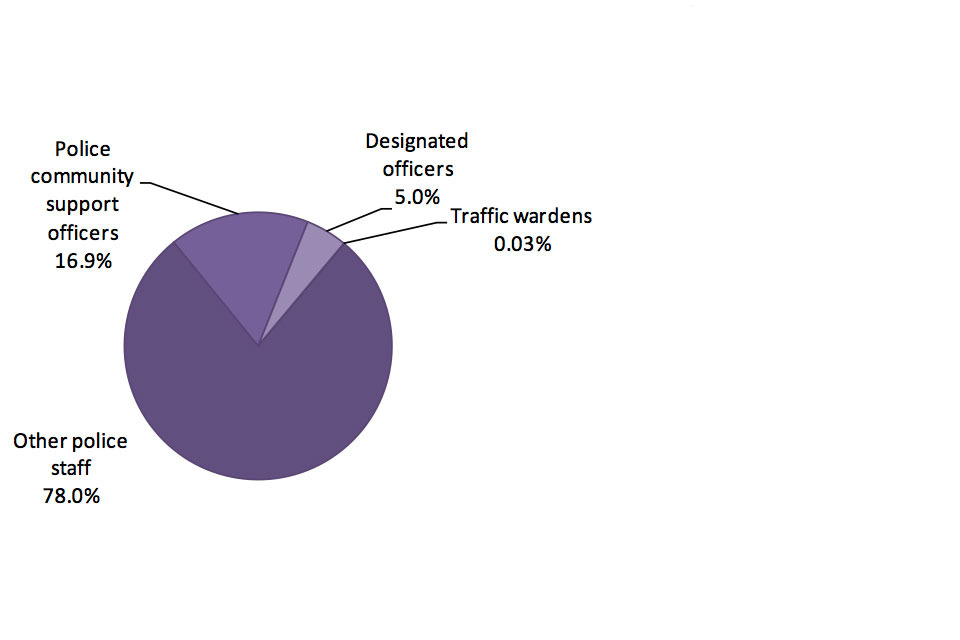
Staff in supporting roles, Police community support officers 16.9%, Designated officers 5%, Traffic wardens 0.03%, Other police staff 78%.
Chart notes
Source: Home Office, Police workforce tables, Tables 10a and 10b.
The FTE number of other police staff, i.e. excluding PCSOs, designated officers and traffic wardens, decreased by 2.8% to 65,573 in the year to 31 March 2013. The number of PCSOs decreased by 1.3% to 14,205 in the year ending March 2013. The very small number of traffic wardens reflects the dominant role of local authorities in parking control (Tables 10a and 10b).
Females accounted for 68.2% of police staff, a much higher proportion than in the police officer ranks. Females accounted for 47.0% of all PCSOs (Table 10a).
As at 31 March 2013, 6,319 other police staff were Minority Ethnic, accounting for 7.5% of the total. The proportion of Minority Ethnic PCSOs was 9.5%, a higher proportion than for other police staff and police officers (Tables 10a and 10b).
As well as having the largest proportion of officers, the Metropolitan Police also has the largest proportion of PCSOs when compared with other police forces (2,684 PCSOs, 18.9% of all PCSOs). The second highest was Greater Manchester Police which had 5.6% (or 793 PCSOs) (Tables 10a and 10b).
7. Special constabulary
There were 19,011 special constables as at 31 March 2013 in the 43 police forces of England and Wales, 6.5% or 1,332 fewer than in the previous year. This follows a 10.4% increase in the year to March 2012 (Table 11).
Females accounted for 30.8% of special constables, a higher proportion than for police officers. The 11.0% of special constables who were Minority Ethnic was also higher than the proportion among police officers. The Metropolitan Police had the highest proportion of Minority Ethnic special constables (27.7%), followed by West Midlands (20.2%) and Leicestershire (13.5%) (Table 11).
In the year to 31 March 2013, 4,045 special constables joined the special constabulary and 4,837 left. In addition, some had ceased to be active over the last few years and were removed from forces’ records but were not recorded as leaving in the 12 months to 31 March 2013, hence the discrepancy between the total figure and leaving and joining figures for special constables. The wastage rate increased to 25.4% in the year to 31 March 2013, from 19.6% in the year to 31 March 2012. Wastage rate is the total number of special constables leaving as a proportion of the total. (Table 11).
During the 12 months to 31 March 2013, 17.8% of police officer joiners were previously special constables. These new police officers would have left their post as a special constable in order to join as an officer (Table 11).
8. Data quality and interpreting the figures
As these workforce statistics do not include staff contracted out by the forces, any falls in the staff totals may be exaggerated by any new contracts established. Cleveland and Lincolnshire are recent examples of forces that have been contracting out staff in this way. While forces do submit data on contract staff to the Home Office, these data tend to understate the true position, as some services are easier to quantify in financial terms than by actual numbers of staff working at a particular time (e.g. on 31 March 2013). Therefore, these data are not used in this release.
Some police forces are now collaborating to establish joint units that deliver certain services (e.g. human resources). These units are generally staffed by officers/staff on the payroll of one or other of the forces that are collaborating. For the purpose of the workforce statistics, forces are asked to categorise them according to this criterion.
Due to the small resident population within the City of London police force area, caution is needed when examining the ethnic breakdown of the police workforce or the numbers of officers per head of population. Differences in the proportion of Black or Minority Ethnic workforce in some police force areas (e.g. Metropolitan Police, West Midlands) may, in part, reflect the different proportions of ethnic groups in the overall population, including visitors, in those areas.
The presented figures are correct at the time of publication and may include revisions submitted by forces for the years covered by, and received since the publication of, the previous year’s edition. Due to a correction to Staffordshire’s 2011/12 total for designated officers, the England and Wales total has been revised from 4,063 in the 31 March 2012 release to 4,120 in this release. The revisions to other workforce categories have been minimal. The User Guide contains the revisions analysis for each category.
9. Potential uses of the data
The key user of police workforce statistics is HM Inspectorate of Constabulary, which uses a range of police data to gauge police performance, efficiency and value for money. The Ministry of Justice (MoJ) uses police workforce statistics as one of a group of measures collated from various government departments and agencies in its biennial statistical publications on race and the criminal justice system and women and the criminal justice system. Within the Home Office the statistics are used by a range of policy advisers, social researchers and economists in order to inform policy and operational decisions by ministers.
10. Other data sources
Whilst some ethnic breakdowns are provided here, detailed figures and analysis continue to be the responsibility of the MoJ. The latest edition of its series is online at Statistics on Race and the Criminal Justice System. However, it should be noted that the figures presented in the latest edition relate only to the years up to and including 2009/10, and these may since have been revised. The next edition of Statistics on Race and the Criminal Justice System, with figures up to and including 2011/12, is expected to be published in the autumn of 2013.
