Police use of taser statistics, England and Wales, 2012 to 2013
Published 27 March 2014
Applies to England and Wales

© Crown copyright 2014
This publication is licensed under the terms of the Open Government Licence v3.0 except where otherwise stated. To view this licence, visit nationalarchives.gov.uk/doc/open-government-licence/version/3 or write to the Information Policy Team, The National Archives, Kew, London TW9 4DU, or email: psi@nationalarchives.gov.uk.
Where we have identified any third party copyright information you will need to obtain permission from the copyright holders concerned.
This publication is available at https://www.gov.uk/government/statistics/police-use-of-taser-statistics-england-and-wales-2012-to-2013/police-use-of-taser-statistics-england-and-wales-2012-to-2013
1. Summary
The figures presented in this report detail the number of uses of taser. The use of taser with the most physical impact is ‘fired’ and can result in incapacitation. For the purposes of the police’s statistical reporting this is known as the ‘highest use’ of a taser. When a taser is ‘drawn’ but not discharged this is known as the ‘lowest use’. The uses ‘red dot’, ‘arcing’ ‘aimed’ and ‘drawn’ are known as ‘non-discharges’ as the taser does not make contact with the subject. Taser use is defined in the Authorised Professional Practice (APP)[footnote 1] published by the College of Policing. A summary of this information is in the table in the background and definitions section of this document.
The figures in this report show the number of taser ‘uses’ as opposed to the number of taser ‘incidents’. This is designed to ensure full transparency on taser deployment as more than one taser may be used at an incident. Every time a taser is used in some capacity (fired, angle-drive stun, drive stun, red dot, arced, aimed or drawn) a record of its ‘highest use’ is made by the police officer and a short form is completed. These are collated by the Home Office in order to produce aggregated figures of taser use.
New figures are presented in this report for the six month periods betweenJanuary 2012 and December 2013 inclusive. Key findings are:
- Total police use of taser increased between 2012 and 2013, continuing the trend seen since 2009;
- The percentage of uses where the ‘highest use’ of a taser was ‘fired’ decreased between 2012 and 2013 (from 21% to 17%), having remained constant between 2011 and 2012.
- The most common use of a taser in each of the last two years was ‘red dot’, accounting for 51% of use, which is consistent with the level seen in 2011.
2. Overall taser use 2012 and 2013
Overall taser use increased in each of the six month periods in 2012 and 2013 as shown in the table below.
2.1 Table 1: Total taser use for England and Wales 2012 to 2013
| January 2012 to June 2012 | July 2012 to December 2012 | January 2013 to June 2013 | July 2013 to December 2013 | Change from 2011 to 2012 | Change from 2012 to 2013 |
| 3,871 | 4,290 | 4,999 | 5,381 | +4% | +27% |
Source: aggregate police force returns 2012 and 2013
Trends in taser use varied across different police forces in the last two years. There was an overall increase with a small number of forces experiencing a decrease.
Taser rollout and deployment has continued over the reporting period with the last remaining forces (Cambridgeshire, Essex, Sussex and Thames Valley) introducing the units specially trained to use them (STUs) in 2013. The ongoing rollout accounts for some of the increase in the overall use of taser between 2012 and 2013. Appendix 1 sets out at which point between 2009 and 2013 individual forces introduced STUs following their trial in a small number of forces in 2007.
3. Trends in taser use 2009 to 2013
Taser use is recorded against seven categories: fired, angle-drive stun, drive stun, red dot, arced, aimed or drawn. Only the ‘highest use’ for each taser deployed is recorded. For example if a taser is ‘drawn’ and then ‘fired’, the officer will only record ‘fired’ as that is the ‘highest use’ of that specific deployment.
Figure 1 shows the trends in the number and type of uses of taser in the five years from 2009 to 2013. The totals for ‘non-discharges’ are compared alongside the ‘highest use’ of ‘fired’ and the ‘drive stun’ and ‘angle drive stun’ categories to display the proportions of taser use of each type.
Figure 1: Trend in overall taser use in England and Wales by category, 2009 to 2013
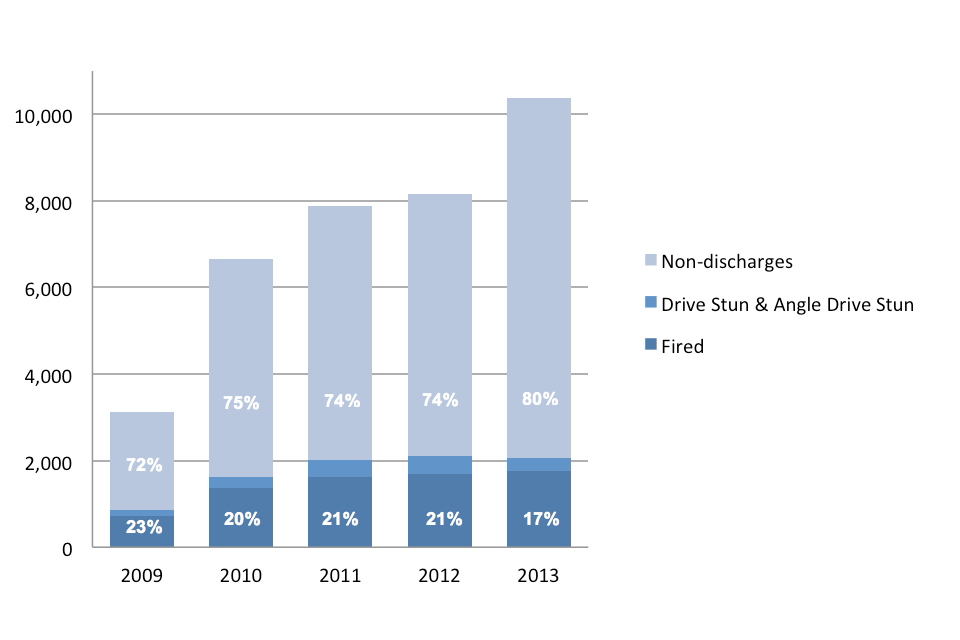
2009 72% non-discharges 23% fired, 2010 75% non-discharges 20% fired, 2011 74% non-discharges 21% fired, 2012 74% non-discharges 21% fired, 2012 80% non-discharges 17% fired.
Source: Home Office
Notes: The proportions presented in Figure 1 were calculated excluding Humberside and West Midlands who are unable to provide a full breakdown. The totals presented in this graph include all forces effectively imputing the average for both Humberside and West Midlands.
The percentage of overall use where the ‘highest use’ of a taser was ‘fired’ decreased between 2012 and 2013 (from 21% to 17%, and down from a peak of 23% in 2009). Across the period, the most common use of tasers was consistently ‘non-discharges’. These accounted for around three quarters of uses in 2009 to 2012 inclusive and increasing to 80% of uses in 2013.
A more detailed percentage breakdown of the seven categories for the total taser use in England and Wales in 2013 can be seen in Figure 2. This shows that the ‘highest use’ of ‘fired’ occurred in 17% of taser uses and a taser was ‘drawn’ in around 22% of uses. The most common use was ‘red dot’ which accounted for 51% of uses. The percentage breakdown of taser use remains similar to previous years with a slight decrease in the category of ‘fired’.
3.1 Figure 2 Police use of taser in England and Wales by type 2013
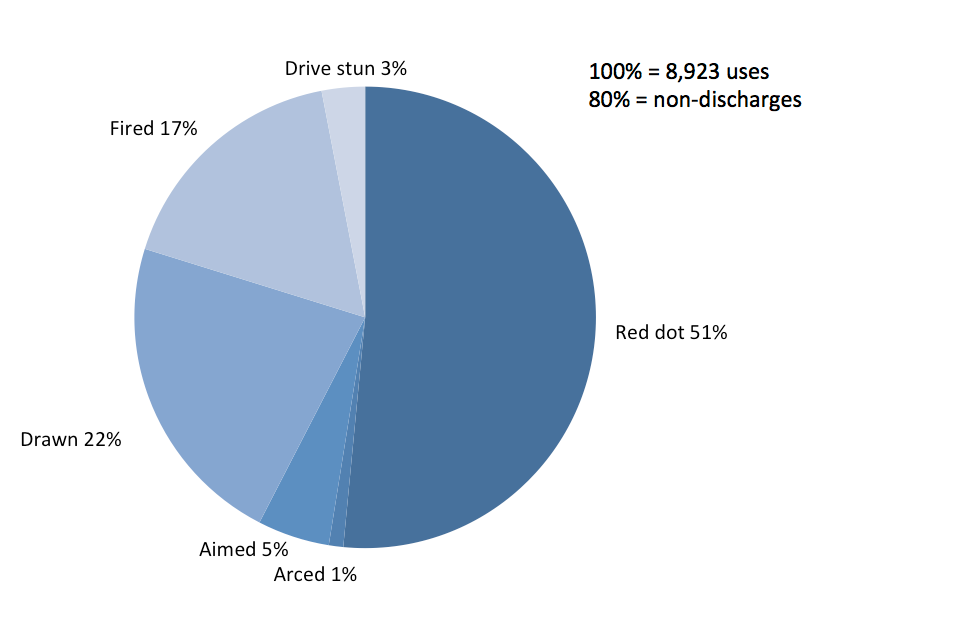
Red dot 51%, arced 1%, aimed 5%, drawn 22%, fired 17%, drive stun 3%, 100% equals 8923 uses, 80% equals non-discharges.
Notes: Charts may not sum to 100 due to rounding
This pie chart excludes Humberside and West Midlands who are unable to provide a full breakdown of taser use.
Angle drive stun accounts for less than 0.1% of total uses and not stated accounts for less than 0.2%
4. Data quality and use of data
There are a number of factors, for example the level of crime or violence perpetrated against the police, that may lead to an increase or a decrease in the use of taser. The figures in this statistical release should not be used to interpret how any of these factors are changing.
Care should be taken when making comparisons between forces on the level of taser use. This is dependent on a variety of factors including police force policy, the population size within the force area, the level of violent crime, and the incremental introduction of taser across police forces in England and Wales (see Appendix 1).
The last taser statistics released in September 2013 was based on police force data returns. This was because complications with the Home Office database and data recording had caused some inconsistencies in the data record. In the September release there was a commitment to using the database figures for future publications[footnote 2] . However, a number of data capture issues with the form used to populate the Home Office database meant that the quality of the figures were not of a standard suitable for publication. Following a validation exercise of police force data and the Home Office database, it was agreed that the former provided a more accurate data set for this statistical release.
Two forces, West Midlands and Humberside, were unable to provide a total breakdown of their figures. Where a full breakdown was not provided averages were used. Three other forces, Norfolk, Dyfed-Powys, and Cumbria, gave permission to use figures from the Home Office database.
A police-led review looked at the data capture problem and identified some issues with the method and consistency of the collection of the data. This is being addressed in a number of ways including:
- a review of the causes of the inconsistency in data capture and a programme of remedial action put into place at force level
- the introduction of an ongoing reconciliation exercise focused on the police data returns to test data quality throughout the reporting period
- the setting up of a best practice and information sharing seminar led by the national policing firearms secretariat
In the September statistical release there was a commitment to publishing the police use of taser statistics every six months from March 2014. The current publication puts the remaining historical data into the public domain. Therefore to support improved consistency of data capture at force level, consideration is being given to the frequency with which these data are published in future.
The tables of taser use figures can also be accessed as ODS files available at ‘Police use of Taser statistics, England and Wales, 2012 to 2013: data tables’.
5. Background and definitions
Taser[footnote 3] is a pistol-like conductive energy device that can incapacitate an individual through the use of an electrical current. It is less lethal than a conventional firearm and provides a valuable tactical option for the police when faced with violence or threats of violence of such severity that force is needed to protect the public, themselves or the individual.
The Home Office and the police undertook rigorous testing of taser, including submitting them for independent medical assessment, before they were introduced. New models of taser are subject to the same level of testing before they can be disseminated for operational use in police forces.
The data provided by the police to the Home Office on taser use provides information as to operational effectiveness of taser, and makes transparent the levels and types of usage. The data is also analysed for any medical implications.
The background to the trial, assessment and eventual deployment of taser was set out in the September 2013 publication[footnote 4].
The table below sets out the definitions for the different types of taser uses.
| Level of use | Type of use | Definition |
|---|---|---|
| Highest use[footnote 5] | Fired | The taser is fired with a live cartridge installed. When the trigger is pulled, the probes are fired towards the subject with the intention of completing an electrical circuit and delivering an incapacitating effect. |
| Angled Drive Stun | The officer fires the weapon with a live cartridge installed. One or both probes may attach to the subject The officer then holds the taser against the subject’s body in a different area to the probe(s), in order to complete the electrical circuit and deliver an incapacitating effect. | |
| Drive stun | The taser is held against the subject’s body and the trigger is pulled with no probes being fired. Contact with the subject completes the electrical circuit which causes pain but does not deliver an incapacitating effect. | |
| Non-discharges | Red dot | The weapon is not fired. Instead, the taser is deliberately aimed and then partially activated so that a laser red dot is placed onto the subject. |
| Arcing | Sparking of the taser without aiming it or firing it. | |
| Aimed | Deliberate aiming of the taser at a targeted subject. | |
| Lowest use | Drawn | Drawing of taser in circumstances where any person could reasonably perceive the action to be a use of force. |
-
Full APP available at ‘Use of force, firearms and less lethal weapons’. ↩
-
The new database is now (27 March 2014) working well and will be used to compile the 2012 and 2013 figures due to be published in March 2014. ↩
-
Only Conducted Energy Devices manufactured by TASER International are currently authorised for use by police forces in England and Wales. ↩
-
Police use of Taser statistics, England and Wales, 2009 to 2011. ↩
-
The highest level of use is ‘fired’ which is designed to result in incapacitation, the lowest level of use is drawn. ↩