Police use of Taser statistics, England and Wales, 2009 to 2011
Published 10 September 2013
Applies to England and Wales

© Crown copyright 2013
This publication is licensed under the terms of the Open Government Licence v3.0 except where otherwise stated. To view this licence, visit nationalarchives.gov.uk/doc/open-government-licence/version/3 or write to the Information Policy Team, The National Archives, Kew, London TW9 4DU, or email: psi@nationalarchives.gov.uk.
Where we have identified any third party copyright information you will need to obtain permission from the copyright holders concerned.
This publication is available at https://www.gov.uk/government/statistics/police-use-of-taser-statistics-england-and-wales-2009-to-2011/police-use-of-taser-statistics-england-and-wales-2009-to-2011
1. Summary
Taser is a pistol-like device that can incapacite an individual through the use of an electrical current. Only Conducted Energy Devices manufactured by Taser International are currently authorised for use by police forces in England and Wales. It is less lethal than a convention firearm and provides a valuable tactical option for the police when faced with violence or threats of violence of such severity that force is needed to protect the public, themselves or the individual concerned.
Taser has been authorised for use by the police in accordance with the procedures for authorising the police use of less lethal weapons. This process includes an independent assessment of the potential medical impact and rigorous testing of the equipment to ensure its fitness for use. Every incident in which Taser is deployed – whether it is fired or not – is recorded by the local police force and a report is sent to the Home Office for collation. The data, summarised and published provides information as to Taser’s operational effectiveness, its medical implications, and makes transparent the levels and types of usage by the police.
The figures presented in this report detail the number of uses of Taser. Only the highest level of ‘use’ for each Taser deployed is recorded, refered to in this report as ‘highest use’ (for more information see the ‘Breakdown of Taser use’ section). Taser use is defined by College of Policing Authorised Professional Practice.
The figures show the number of Taser ‘uses’ as opposed to the number of Taser ‘incidents’. This is designed to ensure full transparency on Taser deployment as there may be more than one ‘use’ of Taser at an ‘incident’. Every time a Taser is used (fired, angle-drive stunned, drive stunned, red-dotted, arced, aimed or drawn) a record is made by the police officer and a short form is submitted. These are collated in the Home Office database.
Key facts from this report are:
- Total police use of Taser has increased year on year from 2009 to 2011,
- The proportion of Taser where the ‘highest use’ is ‘fired’ remained constant through 2010 and 2011 at about a fifth, after declining from 2009,
- The most common ‘highest use’ of a Taser was ‘red dot’ in each of the last two years.
The figures presented in this report cover the period from January 2009 to December 2011 of which the data for January 2010 to December 2011 is being published for the first time. The next publication will be in March 2014 and cover figures for 2012 and 2013. After this point, Police use of Taser statistics will be published every 6 months.
The last Taser statistics release was in March 2011 and covered the period to March 2010. There has been a delay to releasing figures due to changes in the data collection method (for more information see the ‘Data quality and use of data’ section below). Following difficulties in moving to the new database, this report re-establishes official statistics on the Police use of Taser statistical publication by publishing figures for 2010 and 2011.
2. Background
In 2004, following a trial in five forces (Thames Valley, North Wales, Lincolnshire, Northamptonshire and the Metropolitan Police Service), it was agreed to allow chief officers of all police forces in England and Wales to make Taser available to authorised firearms officers. The Home Office announced on 19 July 2007 that authorised police firearms officers in England and Wales would be able to use Taser (from 20 July 2007) in a greater set of circumstances. These officers are now able to deploy Taser in operations or incidents where the use of firearms is not authorised, but where they are facing violence or threats of violence of such severity that they would need to use force to protect the public, themselves or the subject.
It was also announced in July 2007 that the deployment of Taser by specially trained police units who are not firearms officers, but who are facing similar threats of violence, would be trialled in ten police forces. The 12-month trial commenced on 1 September 2007 and finished on 31 August 2008. It took place in the following forces: Avon & Somerset, Devon & Cornwall, Gwent, Lincolnshire, Merseyside, Metropolitan Police Service, Northamptonshire, Northumbria, North Wales and West Yorkshire.
Following the success of the trial, from 1 December 2008, Taser use was extended to specially trained units in accordance with ACPO policy and guidance. This set out that Taser can only be used where officers would be facing violence or threats of violence of such severity that they would need to use force to protect the public, themselves and/or the subject(s).
Linked to this wider roll out, the Home Office made available 10,000 additional Tasers which Chief Officers were able to bid for based on their own operational requirements. These additional Tasers were deployed to forces as soon as bids from forces were assessed and the procurement process was complete. Not all forces chose to immediately widen the use of Taser. In addition, for those forces who did, the roll-out was incremental given the need for officers in Specially Trained Units to be fully trained.
3. Total Taser use
Total Taser use figure for England and Wales has increased each 6 months since 2009 (Table 1.1). The percentage increase between 2010 and 2011 is much lower than the equivalent comparison of 2010 to 2009. For the total use of Taser figures by force see Table 1. The total positive increase in the number of Taser uses is made up of varying movement for individual forces, including some forces where the use of Taser has declined over the two years.
It is highly likely the large increase in the use of Taser between 2009 and 2010 is explained by the wider roll out of Taser following the successful trial of Specially Trained Units. Appendix 1 demonstrates that a number of forces chose to introduce STUs in 2009 so, if they have trained their additional officers it is likely the whole cadre would have been trained by 2010.
3.1 Table 1.1 Total Taser use
| England and Wales | ||||||||
|---|---|---|---|---|---|---|---|---|
| Jan09 to Jun09 | Jul09 to Dec09 | Jan10 to Jun10 | Jul10 to Dec10 | Jan11 to Jun11 | Jul11 to Dec11 | Change from 2009 to 2010 | Change from 2010 to 2011 | |
| Total use | 1,267 | 1,861 | 3,113 | 3,536 | 3,836 | 4,041 | +113% | +18% |
Source: Home Office, database returns for 2009 and aggregate police returns 2010 and 2011
4. Breakdown of Taser use
Taser use is now recorded against seven categories: Drawn, Aimed, Arced, Red Dotted, Drive Stun, Angled Drive Stun and Fired. Only the highest level of ‘use’ for each Taser deployed is recorded. The table below provides information on each use and ranks them in terms of ‘highest use’.
| Highest use | Fired | The Taser is fired with a live cartridge installed. When the trigger is pulled, the probes are fired into the subject so that the electrical circuit is completed and an incapacitating effect delivered. |
| Angled Drive Stun | The officer fires the weapon with a live cartridge installed. However one of the probes does not attach itself properly. The officer then holds the Taser against the subject’s body in a different area to the probe, in order to complete the electrical circuit and deliver an incapacitating effect. | |
| Drive stun | With a live cartridge installed, the Taser is held against the subject’s body and the trigger is pulled. Contact with the subject completes the electrical circuit which causes pain but does not deliver an incapacitating effect. | |
| Non-discharges | Red dotted | The weapon is not fired. Instead, the Taser is deliberately aimed and then partially activated so that a laser red dot is placed onto the subject. |
| Arcing | Sparking of the Taser without aiming it or firing it. | |
| Aimed | Deliberately aiming of the Taser at a targeted subject. | |
| Lowest use | Drawn | Drawing of Taser in circumstances where any person could reasonably perceive the action to be a use of force. |
Figure 1 shows the number of uses in the three years from 2009 to 2011. It groups the breakdowns in which the Taser does not make contact with the subject (red-dotted, arcing, aimed and drawn) and labels these as non-discharges. The proportion of total uses that are non-discharges are then compared alongside the ‘highest use’ of ‘fired’ and the ‘drive stun and angle drive stun’ categories.
The percentage of uses where the ‘highest use’ of a Taser was ‘fired’ has remained fairly constant between 2010 and 2011 (20.4% in 2010 and 20.8% in 2011) having declined from 2009 (to 23.2 per cent). This suggests that while overall use of Taser by the police has increased, the way that Taser are being used has not changed.
4.1 Figure 1

Shows the proportion of Taser uses from 2009 to 2011 in the categories of non-discharges (red-dotted, arcing, aimed and drawn), drive stun and angle drive stun and fired.
Source: Home Office
Notes: The proportions presented in this chart were calculated excluding Humberside and West Midlands who are unable to provide a full breakdown. The totals presented in this graph include all forces effectively imputing the average for both Humberside and West Midlands.
The more detailed percentage breakdown of the seven categories for the total Taser use in England and Wales in 2010 and 2011 can be seen in Figure 2. This shows that in both years the ‘highest use’ of ‘fired’ occurred in just over 20% of Taser uses and a Taser was only ‘drawn’ in around 15% of uses. The most common ‘highest use’ in both years was ‘red dot’ with this being the ‘highest use’ in over 50% of uses.
4.2 Figure 2 Police use of Taser by type
2010
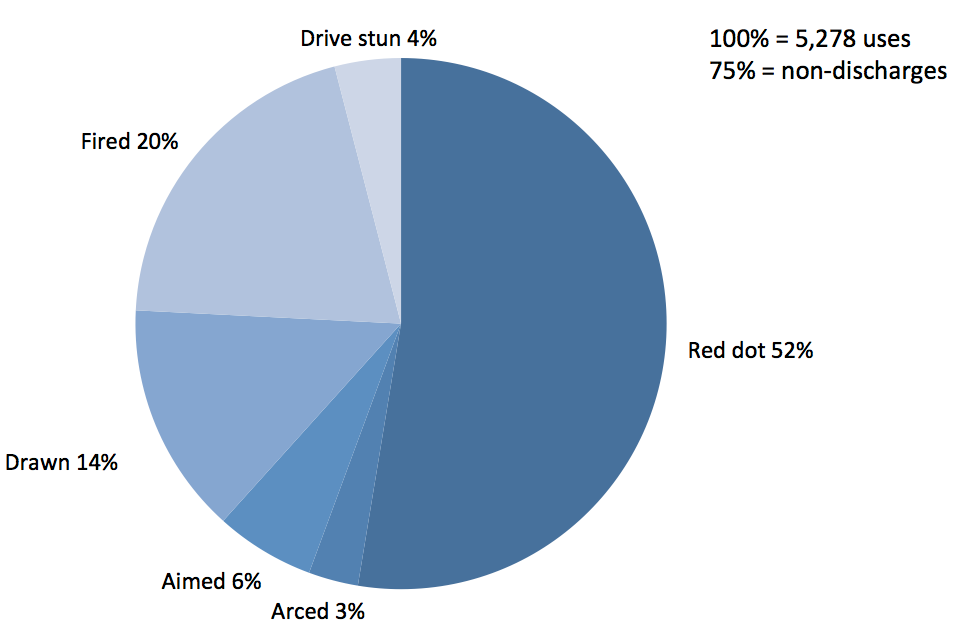
Police use of Taser by type for 2010, red dot, 52%, arced 3%, aimed 6%, drawn 14%, fired 20% and drive stun 4%.
2011
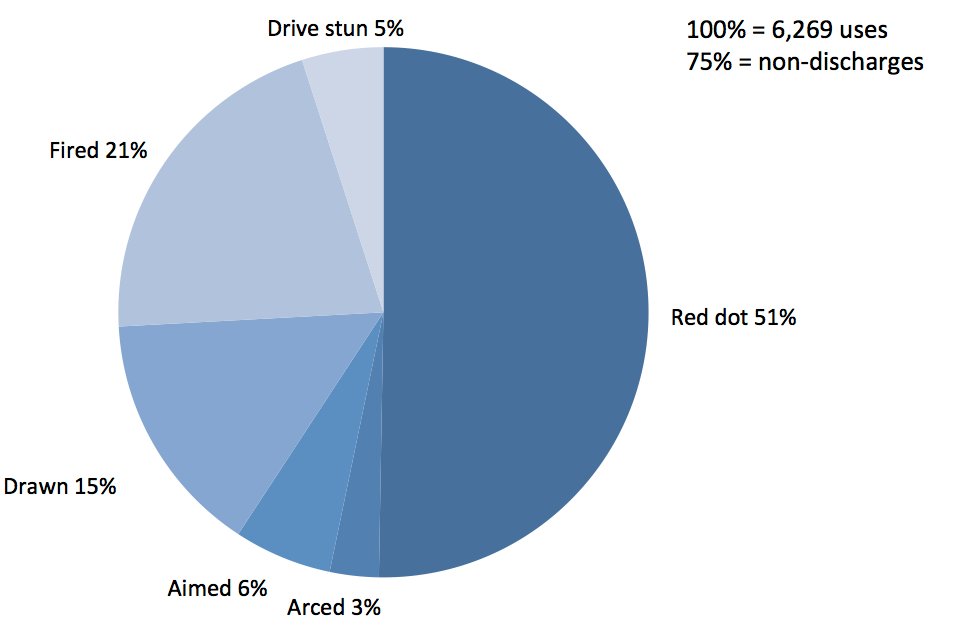
Police use of Taser by type for 2011, red dot, 51%, arced 3%, aimed 6%, drawn 15%, fired 21% and drive stun 5%.
Source: Home Office
Notes: Charts may not sum to 100 due to rounding.
This chart excludes Humberside and West Midlands who are unable to provide a full breakdown.
In both years Angle Drive Stun accounts for less than 0.1% of total uses and not stated accounts for less than 0.2%.
5. Data quality and use of data
There are a number of factors that may lead to an increase or a decrease in the use of Taser. These figures should not be used to interpret how any of these factors are changing, for example, the level of crime.
Care should be taken when making comparisons between forces on the level of Taser use. The level of Taser use is dependent on a variety of factors including police force policy, the population size and the level of violent crime. Furthermore there is likely to be varying data quality across the forces due to differing approaches to data capture.
The 2009 figures presented in this report were collected through a centralised Home Office database which was replaced by a new database. Previously figures were published on a quarterly basis which has now been changed to a 6 monthly publication within calendar years.
Unfortunately there were a number of data capture issues with the development of this new database. Given these difficulties it was decided that the quality of these figures was not of a standard suitable for publication. In order to provide data for 2010 and 2011 a separate collection was established to collect aggregate Taser use figures directly from police forces and it is these figures presented in this report.
The new database is now working well and will be used to compile the 2012 and 2013 figures due to be published in March 2014. A quality assurance exercise will be carried out on this data to ensure continuity for the time series.
The overall story told by the figures originally collected in the Home Office database for 2010 and 2011 is very similar. The proportion of police use of Taser where the ‘highest use’ is ‘fired’ is still about a fifth and the highest category is consistently ‘red-dotted’ at just over half.
Accompanying data tables can be accessed as an ODS file at ‘Police use of Taser statistics, England and Wales, 2009 to 2011: data tables’.