Police use of Taser statistics, England and Wales, 2014
Published 9 July 2015
Applies to England and Wales

© Crown copyright 2015
This publication is licensed under the terms of the Open Government Licence v3.0 except where otherwise stated. To view this licence, visit nationalarchives.gov.uk/doc/open-government-licence/version/3 or write to the Information Policy Team, The National Archives, Kew, London TW9 4DU, or email: psi@nationalarchives.gov.uk.
Where we have identified any third party copyright information you will need to obtain permission from the copyright holders concerned.
This publication is available at https://www.gov.uk/government/statistics/police-use-of-taser-statistics-england-and-wales-1-january-to-31-december-2014/police-use-of-taser-statistics-england-and-wales-2014
The Home Office is seeking feedback on this publication so that we can assess how well it meets our users’ needs and make improvements where possible. If you have not already done so, please could you complete a short five-minute survey.
1. Summary
This release contains statistics on police use of Taser across England and Wales for 2014. It includes a number of revisions to previously published figures which cover January to June 2014 (see section 6.4 revisions analysis) and previously unreleased figures covering July to December 2014. Taser use is recorded against seven categories: Drawn, Aimed, Arced, Red Dotted, Drive Stun, Angled Drive Stun and Fired. Definitions on each of the Taser use types are set out in section 6.1 coverage.
Drawn is known as the lowest use. The uses red-dot, arcing, aimed and drawn are known as non-discharges as the Taser does not make contact with the subject. The uses drive stun, angle-drive stun and fired are known as discharges; fired has the most physical impact and can result in incapacitation.
The figures in this report show the number of Taser ‘uses’ as opposed to the number of Taser ‘incidents’. This is to ensure full transparency on Taser deployment as more than one Taser may be used at an incident. Every time a Taser is used, only a record of its highest use is recorded. For example, if a Taser is drawn, aimed, arced, red-dotted, then fired, only fired will be recorded.
The statistics in this release can be found in the Police use of Taser, England and Wales, 2014 data tables.
2. Key facts
- the police used Taser 10,062 times in 2014, representing a decrease of 3%
(-318) compared with 2013; of these:
- non-discharges accounted for 8,081 uses, representing a fall of 3% (-279) compared with 2013
- drive stun and angle-drive stun accounted for 256 uses, representing a fall of 11% (-31) compared with 2013f
- fired accounted for 1,724 uses, representing a fall of 1% (-9) compared with 2013
- non-discharges accounted for 80% of Taser use in 2014, with this mainly comprising of either the use of red-dot (64%) or an officer drawing the Taser (27%)
- drive stun and angle-drive stun accounted for 3% of Taser use in 2014
- fired accounted for 17% of Taser use in 2014
3. Overall Taser use by type in 2013 and 2014
Police use of Taser decreased by 3% between 2013 to 2014. Figure 1 shows a breakdown by type of use.
Of the uses of Taser, the number of Taser drawn has shown the largest numeric decrease from 2,497 (2013) to 2,219 (2014), a decrease of 278 (-11%). The total uses of red-dotted showed the largest numeric increase from 5,105 (2013) to 5,203, an increase of 98 (2%).
Figure 1: Taser use, 2014 compared with 2013, England and Wales
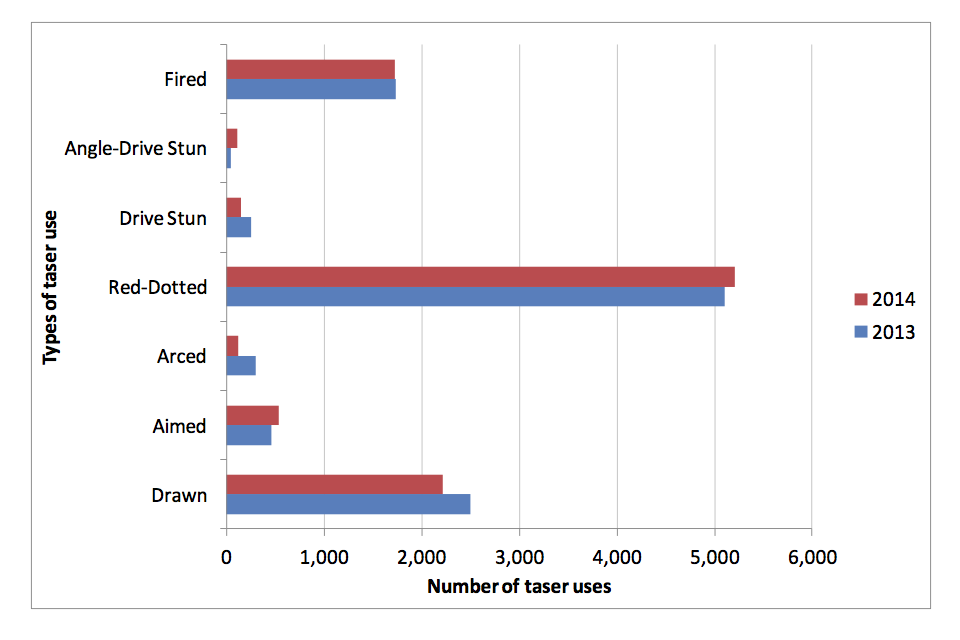
Taser use, 2014 compared with 2013, England and Wales.
Source: Police use of Taser, England and Wales, 2014
Note: Some caution should be made when comparing figures between years (see section 6.3 Comparability with pre-2014 figures).
Trends in Taser use varied across different police forces in the last 2 years. There was an overall decrease across all forces, with 19 forces experiencing a decrease, and 24 experiencing an increase.
4. Trends in Taser use 2010 to 2014
Appendix 1 (which can be found in the Police use of Taser, England and Wales, 2014 data tables) sets out at which point between 2009 and 2013 individual forces first issued Taser to Specially Trained Units (STUs) following a trial in a small number of forces in 2007.
Figure 2 shows Taser use trends from 2010 to 2014. It shows the number of non-discharges, the number of drive stun and angle-drive stun and the number fired. Any increases should be seen in the context of Tasers first being issued to STUs in different years across different forces.
Figure 2: Taser use, 2010 to 2014, England and Wales
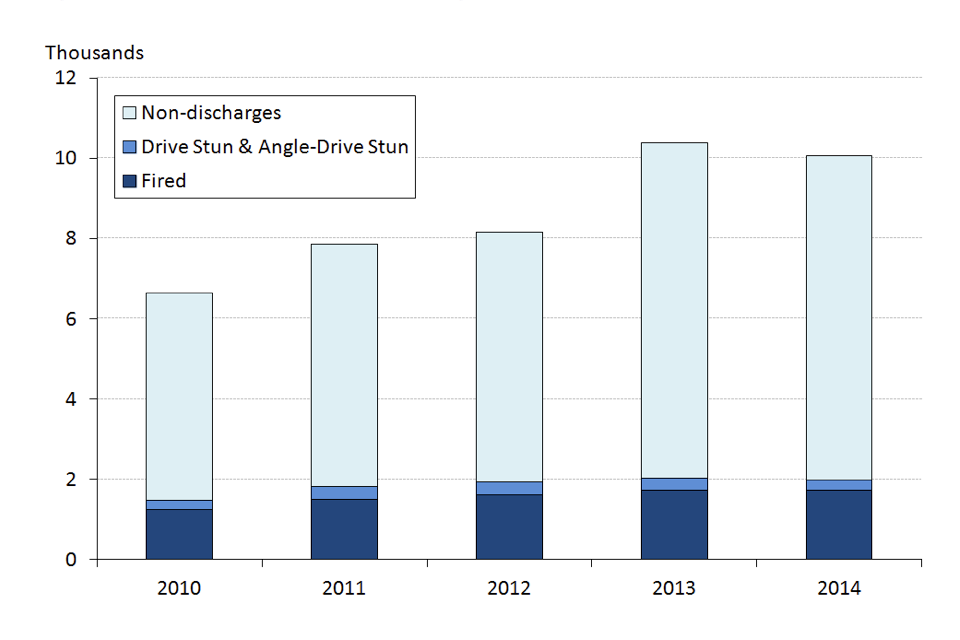
Taser use, 2010 to 2014, England and Wales.
Source: Police use of Taser, England and Wales, 2014
Note: Total figures have excluded those which were ’not stated’.
There were 10,062 uses of Taser in 2014, representing a decrease of 3% (-318) compared with the previous year. However, this is an increase of 51% (3,413) compared to 2010, partially due to different forces first issuing Taser to STUs in different years between 2007 and 2013.
In 2014, the number of non-discharges (8,081) accounted for 80% of total Taser use, a decrease of 3% from 2013. Of the total use, 1,724 were fired, representing a fall of 1% (-9) compared with the previous year.
Of the forces that were able to provide full breakdowns, the proportion of fired remained the same (17%) in 2014 compared to the previous year. Compared to 2010, the proportion of fired has decreased by 3 percentage points from 20%.
In 2014, the proportion of non-discharges has shown a decrease of 1 percentage point from last year and has remained within the region of 74% to 80% over the last 5 years.
5. Taser use in 2014
There were 10,062 total uses of Taser in 2014. As Figure 3 below shows, red-dot was the most common use of Taser, accounting for 52% (5,203) of the total use, while angle-drive stun was the least common use of Taser, accounting for only 1% (111) of the total use.
The proportion of non-discharges (drawn, aimed, arced and red-dot) accounted for 80% (8,081) of the total use, while discharges accounted for 20% (1,980) of the total use.
Figure 3: Police use of Taser in England and Wales by type, 2014
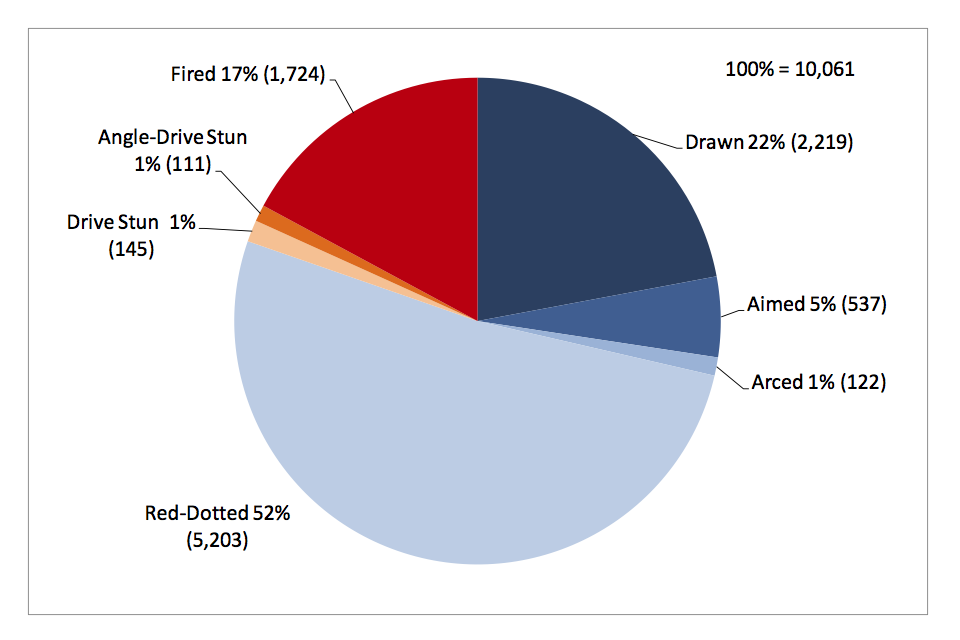
Police use of Taser in England and Wales by type, 2014, red-dotted 52%, drive stun 1%, angle-drive stun 1%, fired 17%, drawn 22%, aimed 5%, arced 1%.
Source: Police use of Taser, England and Wales, 2014
Notes: Chart may not sum to 100 due to rounding.
The total use of Taser has excluded 1 ‘not stated’ figure.
6. Additional information
6.1 Coverage
The ‘Police use of Taser’ release provides figures from the 43 police forces in England and Wales on Taser use. The figures in this release cover the 2014 calendar year and the period going back to 2009.
The statistics in this release are based on aggregated figures provided by individual police forces to the National Armed Policing Secretariat (NAPS). NAPS then collated the figures and provided them to the Home Office.
Taser1 is a pistol-like conductive energy device that can incapacitate an individual through the use of an electrical current. It is less lethal than a conventional firearm and provides a tactical option for the police where use of force is needed to protect the public, themselves or the individual.
As detailed in Table 1, Taser is recorded against seven Taser categories: ‘drawn’, ‘aimed’, ‘arced’, ‘red-dot’, ‘drive stun’, ‘angle-drive stun’ and ‘fired’.
The figures in this report show the number of Taser ‘uses’ as opposed to the number of Taser ‘incidents’. This is to ensure full transparency on Taser deployment as more than one Taser may be used at an incident. Every time a Taser is used, only a record of its highest use is recorded. For example, if a Taser is ‘drawn’, ‘aimed’, ‘arced’, ‘red-dotted’, then ‘fired’, only ‘fired’ will be recorded.
Table 1 Definitions and levels of the different types of Taser use
| Level of use | Type of use | Definition |
|---|---|---|
| Highest use | Fired | The Taser is fired with a live cartridge installed. When the trigger is pulled, the probes are fired towards the subject with the intention of completing an electrical circuit and delivering an incapacitating effect. |
| Angle-drive stun | The officer fires the weapon with a live cartridge installed. One or both probes may attach to the subject. The officer then holds the Taser against the subject’s body in a different area to the probe(s), in order to complete the electrical circuit and deliver an incapacitating effect. | |
| Drive stun | The Taser is held against the subject’s body and the trigger is pulled with no probes being fired. Contact with the subject completes the electrical circuit which causes pain but does not deliver an incapacitating effect. | |
| Non-discharges | Red-dot | The weapon is not fired. Instead, the Taser is deliberately aimed and then partially activated so that a laser red dot is placed onto the subject. |
| Arcing | Sparking of the Taser without aiming it or firing it. | |
| Aimed | Deliberate aiming of the Taser at a targeted subject. | |
| Lowest use | Drawn | Drawing of the Taser in circumstances where any person could reasonably perceive the action to be a use of force. |
- Only TASER® X26 Conducted Energy Devices manufactured by TASER International are currently authorised for use by police forces in England and Wales
6.2 Work undertaken to ensure the statistics were of sufficient quality to continue publishing as official statistics
On 23 March 2015, the Home Secretary announced the suspension of the Police use of Taser statistical publication (and the Police use of firearms statistical publication) due to data quality concerns. To address these, Home Office officials, along with the National Armed Policing Secretariat, carried out an internal review of the reporting process. Following the review, the Home Office Chief Statistician wrote to all Chief Constables and Commissioners asking them to confirm figures covering the second half of 2014 and previously published figures data covering the first half of 2014.
In light of the above, the Home Office Chief Statistician is now satisfied that the figures are of sufficient quality to publish them as official statistics. However, as is common using data extracted from forces’ systems, figures may not necessarily be accurate to the last digit and may be subject to future revisions.
6.3 Comparability with pre-2014 figures
This release provides figures on all of the different types of Taser use in 2014. However, in previous years, some forces were unable to supply data for all types. In some cases, the data tables use footnotes to indicate that:
- force was unable to split ‘Drawn’, ‘Aimed’ and ‘Red-Dot’ uses so total for the three categories assigned to ‘Drawn’
- force was unable to split ‘Arced’, ‘Fired’ and ‘Drive Stun’ uses so total for the three categories assigned to ‘Arced’
- force was unable to split ‘Drawn’ and ‘Aimed’ uses so total for the two categories assigned to ‘Drawn’
In other cases, in previous years, some types of Taser use for some forces were either missing or not recorded. The data tables for previous years show these as either ‘..’ (not available) or ‘NR’ (not recorded).
6.4 Revisions analysis
Following the data confirmation exercise involving all police forces’ Chief Constables and Commissioners (see 6.2 above), 18 forces submitted revisions for at least one of the Taser use types for figures covering the first half of 2014.
As shown in Table 2 below, forces submitted revisions which resulted in the total number of Taser uses decreasing by 0.3% (-15) for the first 6 months of 2014.
Looking at type of Taser use, the ‘drawn’ category showed the largest numeric decrease (-51 or -4%) and the ‘red-dotted’ category showed the largest numeric increase (12 or 0.5%). Forces cited the changes as being attributable to ‘operational’ or administrative reasons.
Table 2 Taser use by type, comparison between January to June 2014 figures published in October 2014 and July 2015
| Previous October 2014 publication | July 2015 publication | Change | % Change | Number of forces that made revisions | |
|---|---|---|---|---|---|
| Not stated | 0 | - | 0 | - | - |
| Drawn | 1,186 | 1,135 | -51 | -4 | 11 |
| Aimed | 276 | 275 | -1 | -0.4 | 6 |
| Arced | 60 | 61 | 1 | 2 | 5 |
| Red-Dotted | 2,636 | 2,648 | 12 | 0.5 | 14 |
| Drive Stun | 78 | 84 | 6 | 8 | 7 |
| Angle-Drive Stun | 45 | 56 | 11 | 24 | 5 |
| Fired | 826 | 833 | 7 | 1 | 15 |
| Total | 5,107 | 5,092 | -15 | -0.3 |
The data for the latest year (and other years) may be revised in due course. It is standard practice across all Home Office statistical releases to incorporate revisions for previous years’ data in the latest release. Corrections and revisions follow the Home Office corporate revisions policy (see page 6).
6.5 Review of Taser data and other police use of force
In October 2014, the Home Secretary announced that the national policing lead for conflict management, Chief Constable David Shaw, would conduct an in-depth review of the publication of Taser data and other use of force by police officers. The review will present options for publishing data on how police officers are deploying their sensitive powers, who they are being used on and what the outcome was. Recommendations from the Review will feed into future plans to develop this release.
6.6 Developing the police use of Taser statistical release
In parallel with the Review of Taser data and other police use of force, Home Office statisticians will continue to review the arrangements for producing this release. By improving current practices and taking measures to ensure compliance with the Code of Practice (for Official Statistics), the aim of Home Office statisticians is to resume a more regular publication schedule and apply potentially for National Statistics status, after considering the recommendations from the David Shaw review. Home Office statisticians have already taken the following steps to improve the publication and make it more in line with other Home Office statistical releases:
- to ensure the statistics were of sufficient quality to continue publishing as official statistics, officials undertook a data confirmation exercise which included sign-off from Chief Constables and Commissioners (see section 6.2)
- the clarity and format of both the commentary and data tables have been enhanced
- a revisions section which details changes to previously published figures has now been included
- a statistical news release has now been provided
- accompanying ODS data tables have been provided to improve the accessibility and usability of the statistics
- users of this release have been asked to complete a short feedback survey so that the Home Office can assess how well the release meets users’ needs and make improvements where possible (see 6.7 ‘User feedback and enquiries’); in addition, a clear point of contact has been included so users can make enquiries.
Going forward, Home Office statisticians will continue to improve the quality of the outputs in this release so that they are more aligned with National Statistics publications. For example, developing a comprehensive user guide which will document definitions, processes, uses made of the statistics, etc. In addition, statisticians will:
- in collaboration with forces, develop recording and validation practices
- assess the feedback gained from the user survey to ensure users’ needs are met and improvements are made where possible; authors will document the findings in the next release
- review the publication schedule to ensure more timely and regular statistics are provided
6.7 Feedback and enquiries
The Home Office is seeking feedback on this publication so that we can assess how well it meets our users’ needs and make improvements where possible. If you have not already done so, please could you complete a short five-minute survey.
If you would like to make an enquiry about this release, please email the Chief Statistician’s Unit at: CSU.Statistics@homeoffice.gov.uk.