Police powers and procedures England and Wales 2011/12
Published 18 April 2013
Applies to England and Wales

© Crown copyright 2013
This publication is licensed under the terms of the Open Government Licence v3.0 except where otherwise stated. To view this licence, visit nationalarchives.gov.uk/doc/open-government-licence/version/3 or write to the Information Policy Team, The National Archives, Kew, London TW9 4DU, or email: psi@nationalarchives.gov.uk.
Where we have identified any third party copyright information you will need to obtain permission from the copyright holders concerned.
This publication is available at https://www.gov.uk/government/statistics/police-powers-and-procedures-in-england-and-wales-201112/police-powers-and-procedures-in-england-and-wales-2011-12
This release contains figures on Arrests, Detentions, Road Checks, Intimate Searches, Stops and Searches, Breath Tests and Fixed Penalty Notices.
These statistics show that:
- There were 1.2 million persons arrested by the police for recorded crimes in 2011/12, down 9% on 2010/11. The number of recorded crimes decreased by 4% over the same period.
- The police stopped and searched 1.1 million persons and/or vehicles under section 1 of the Police and Criminal Evidence Act (PACE) in 2011/12, 7% less than in 2010/11. Resultant arrests fell by 6%. Stops and searches on suspicion of drugs accounted for 50% of the overall total.
- They also made 46,961 stops and searches in anticipation of violence (under section 60 of the Criminal Justice and Public Order Act 1994), down 25% on 2010/11.
- The police issued 1.5 million fixed penalty notices for motoring offences in 2011, down 18% on 2010. Speed limit offences accounted for over half of them.
- The police carried out 685,992 screening breath tests during 2011, 7% fewer than in 2010. The number of positive or refused tests also fell by 4% and accounted for 12% of the total.
This release, ‘Police Powers and Procedures, England and Wales 2011/12’ contains statistics at police force area level, with analyses by age and gender. There is also a limited analysis of arrests and stops and searches by ethnicity of those arrested or stopped.
1. Arrests
1.1 Introduction
Statistics are presented here on the police powers of arrest. They relate only to arrests for notifiable offences, which form the coverage of recorded crime statistics, and are on a financial year basis. The data are drawn from returns from the 43 local police forces in England and Wales, and cover trends in arrest rates in England and Wales from 2002/03 to 2011/12, as well as breakdowns by offence group, sex and self-defined ethnicity. The Home Office does not receive arrests data from the British Transport Police.
Figures on arrests reported to the Home Office reflect police activity and should not be used to infer levels of crime committed by offenders, or their specific characteristics.
The User Guide provides further details relating to definitions.
1.2 Key facts
There was a 9% decrease in the number of persons arrested for notifiable offences between 2010/11 and 2011/12, from 1.4 million to 1.2 million. Recorded crime in England and Wales decreased by 4% over the same period. The number of persons arrested fell for the fifth successive year, and was the lowest number since the arrests data collection began (in 1999/00; 1.3 million persons). However, caution is needed when making such comparisons since figures for earlier years included estimates for a few forces that were unable to supply arrests information to the Home Office.
Arrests for violence against the person fell for the fifth consecutive year, from a ten-year peak of 487,600 in 2006/07, to 384,200 in 2011/12. The 11% fall in arrests for violence against the person between 2010/11 and 2011/12 compares with a 7% fall in the number of violence against the person offences recorded by police in the same period.
There were decreases in the number of arrests of persons aged between 10 and 17 years, between 18 and 20 years and those aged 21 or over in 2011/12, by 20% (to 167,995), 14% (to 172,302) and 6% (to 893,951) respectively.
Number of persons arrested by sex, England and Wales, 2002/03 to 2011/12
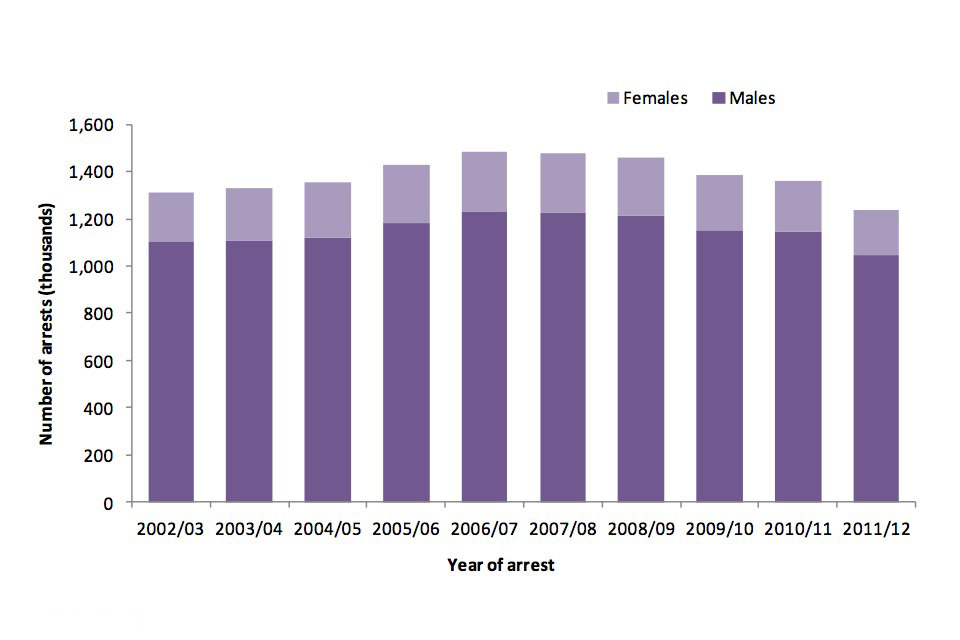
Number of arrests in thousands from 2002/3 to 2011/12 by gender.
Chart notes
Source: Home Office, Arrests table A.01
1.3 Data tables
Data on arrests, sourced from returns received from the 43 police forces in England and Wales, can be found in the Excel tables.
1.4 Arrests by offence group
Decreases in the number of arrests were seen in each of the 9 offence groups, with violence against the person having the biggest numerical reduction (down 47,422 arrests, or 11%). Despite this decrease in the number of arrests for violence against the person offences, the 384,205 arrests in that category accounted for almost a third of all arrests in 2011/12 (31%). In terms of percentage change between 2010/11 and 2011/12, the biggest fall was for criminal damage (down 16%, or 17,625 arrests).
Arrests for violence against the person offences fell for the fifth consecutive year, from a 10-year peak of 487,600 in 2006/07. There have also been year-on-year decreases for theft and handling of stolen goods, which fell for the ninth consecutive year from a peak of 419,900 in 2002/03 to 270,416 in 2011/12, and criminal damage, which had its sixth annual fall from 169,600 in 2005/06 to 95,518 in 2011/12.
The number of arrests for both sexual offences and drug offences decreased in 2011/12, having previously increased for 3 and 6 consecutive years respectively.
Arrests for property crime (burglary, theft, fraud and forgery, and criminal damage) accounted for just over 39% (39.2%) of all arrests for notifiable offences in 2011/12, slightly up on the proportion in 2010/11 (38.8%). The number of arrests for property crime fell by 8% to 484,470, the sixth consecutive year a fall has been reported.
Arrests by offence group, England and Wales, change between 2010/11 and 2011/12
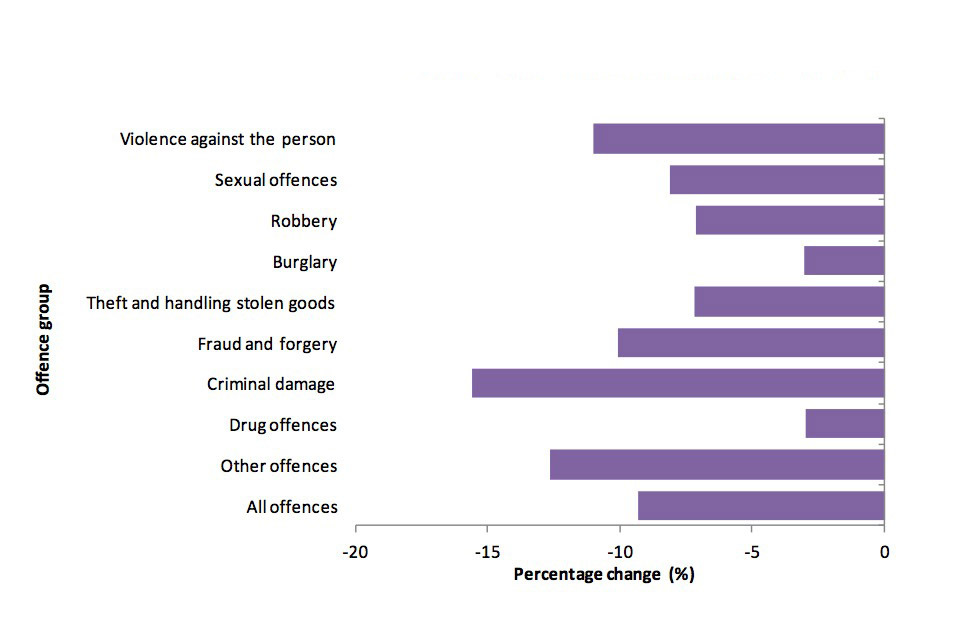
Percentage change by arrest group between 2010/11 and 2011/12.
Chart notes
Source: Home Office, Arrests table A.02
1.5 Arrests by gender and age
As in previous years, the majority of persons arrested for notifiable offences in 2011/12 were male. Since 2002/03 males have consistently accounted for between 83% and 85% of all arrestees.
Arrests of males and females both fell in 2011/12, with male arrests decreasing by 97,570 (9%) to 1,044,230, and female arrests decreasing by 29,367 (13%) to 190,798.
There were decreases in the number of arrests of persons aged between 10 and 17 years, between 18 and 20 years and those aged 21 or over in 2011/12, by 20% (to 167,995), 14% (to 172,302) and 6% (to 893,951) respectively.
In 2011/12 over 70% of both male and female arrestees were aged 21 or over (72.3% and 72.7% respectively). Persons in this age grouping accounted for the majority of all persons arrested across all offence groups (ranging between 60% and 86%) apart from robbery, where similar proportions of persons arrested were aged between 10 and 17 years (41%) or aged 21 or over (39%).
1.6 Arrests by police force area
Thirty-nine police forces recorded decreases in the number of arrests for notifiable offences in 2011/12 compared to the year before. The largest percentage decreases were in Cambridgeshire (down 25%), followed by Wiltshire and Cheshire (both down 17%) and Durham and Hampshire (both down 16%). The 4 police forces with percentage increases were City of London (up 9%), North Yorkshire and Surrey (both up 8%) and Lincolnshire (up 3%).
The Metropolitan Police Service recorded 26,348 fewer arrests for recorded crime offences in 2011/12 than in 2010/11 (down 10%). Accounting for 19% of all arrests in England and Wales in 2011/12, the proportion of arrests made by the Metropolitan Police Service remained the same as the previous year.
Arrest rates across police forces in 2011/12 varied widely, from 12 per 1,000 population in Wiltshire to 38 per 1,000 in Cleveland. The average for England and Wales was 22 arrests per 1,000 population.
1.7 Arrests by ethnicity
Persons arrested are asked to define their ethnicity. For the purposes of this analysis these are grouped into six main categories: White; Black (or Black British); Asian (or Asian British); Chinese or Other; Mixed; and not stated.
Number and proportion of arrests by ethnicity, 2010/11 and 2011/12
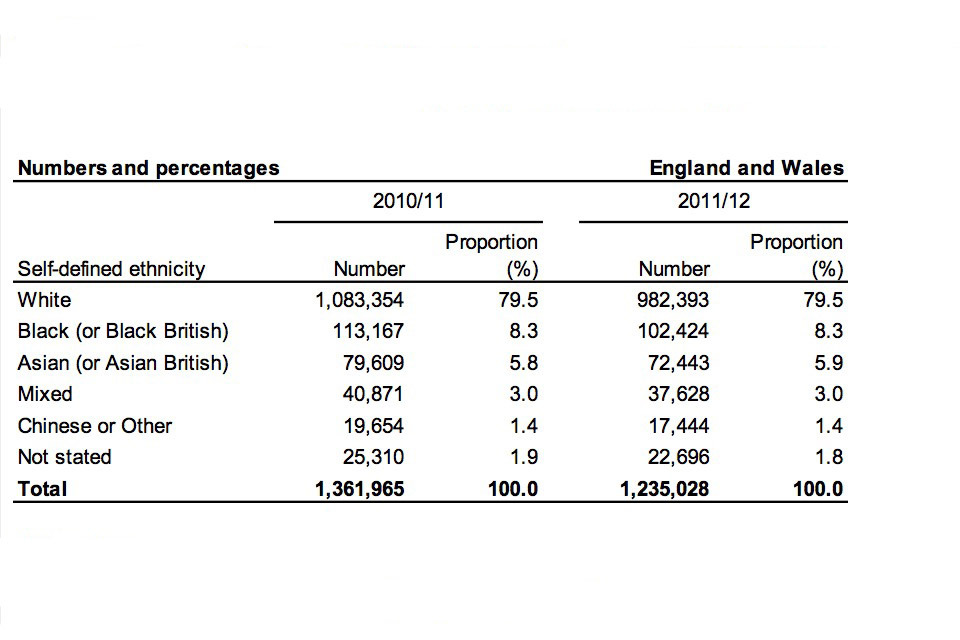
Figures for this table are available in arrests table A.04.
Chart notes
Source: Home Office, Arrests tables A.04 and A.11
Eighty per cent of persons arrested in England and Wales in 2011/12 defined themselves as White. A further 8% defined themselves as Black, and 6% as Asian. Smaller proportions of arrested persons defined themselves as being of Chinese or Other (1%) or Mixed (3%) ethnicities. Two per cent of arrestees did not define their ethnicity. Proportions of arrests by ethnicity in 2011/12 were very similar to those for 2010/11.
Some forces, however, recorded larger proportions of arrestees who defined themselves as Black (eg Metropolitan, 27%; West Midlands, 13%; Bedfordshire, 11%) or Asian (eg West Midlands, 14%; Bedfordshire, 13%; Metropolitan and Leicestershire, both 12%; West Yorkshire, 11%) than for England and Wales as a whole. And a much lower proportion of persons arrested by the Metropolitan Police Service defined themselves as White (48%) than compared with all of England and Wales.
1.8 Data quality and interpreting the figures
It should be borne in mind that figures on sexual offences are heavily influenced by the willingness of victims to report. In addition, the number of arrests for drug offences is greatly dependent on police activities and priorities, and doesn’t give a reliable indication of trends in the level of drug offending.
Comparisons with recorded crime are limited here to trends over time. As arrests relate to persons and recorded crime to offences, it is not appropriate to compare actual numbers.
Due to the small resident population within the City of London police force area, caution is needed when examining the ethnic breakdown of those arrested by that force. Differences in the proportion of Black or Minority Ethnic arrestees in some police force areas (eg Metropolitan, West Midlands) may, in part, reflect the different proportions of ethnic groups in the overall population, including visitors, in those areas.
The presented figures are correct at the time of publication and may include revisions submitted by forces for the years covered by, and received since the publication of, the previous year’s edition. Due to revisions for 2010/11 submitted by Hertfordshire, headline figures for that year show an increase on those included within ‘Police Powers and Procedures 2010/11’ (1,361,965 in this edition compared with 1,360,451 in last year’s).
1.9 Potential uses of the data
The key user of arrest statistics is the Ministry of Justice (MoJ), which presents data collated from various government departments and agencies in its biennial statistical publications on race and the criminal justice system and women and the criminal justice system. Within the Home Office the statistics are used by a range of policy advisers, social researchers and economists in order to inform policy and operational decisions by ministers.
1.10 Other data sources
Whilst some ethnic breakdowns are provided here, detailed figures and analysis continue to be the responsibility of MoJ. The latest edition of its ‘Statistics on Race and the Criminal Justice System’ series is online at ‘Race and the criminal justice system 2010’. However, it should be noted that the figures presented in the latest edition relate only to the years up to and including 2009/10, and may since have been revised. The next edition of ‘Statistics on Race and the Criminal Justice System’, with figures up to and including 2011/12, is expected to be published in the autumn of 2013.
MoJ also publishes data on individuals given an out of court disposal or proceeded against at court in its ‘Criminal Statistics: England and Wales’ quarterly series, the latest of which is online at Criminal justice statistics.
Following the Home Secretary’s acceptance of the recommendations of the National Statistician’s Review of Crime Statistics in June 2011, the collation and publication of crime statistics moved to the Office for National Statistics (ONS) on 1 April 2012. Figures for police recorded crime for 2011/12 are available on the ONS website at Crime statistics.
2. Detentions
2.1 Introduction
Under section 42 of the Police and Criminal Evidence Act (PACE) 1984, detention in police custody before charge on the authority of a police officer is normally limited to 24 hours except where the alleged offence is an indictable one, where the maximum is 36 hours. From 20 January 2004, new powers were introduced which enabled a superintendent or above to authorise continued detention for up to 36 hours for all arrestable offences. Additionally, the police can apply to magistrates for warrants of further detention, extending the maximum detention period to 96 hours. With effect from 1 January 2006 the offence coverage was revised to include all indictable offences.
Information about data quality and interpreting the figures is given below. Further details relating to definitions can be found in the User Guide.
2.2 Key facts
The overall number of persons detained for more than 24 hours (up to a maximum of 96 hours) under PACE and subsequently released without charge was 4,420 during 2011/12. A like-for-like comparison of those police forces who provided data for both 2010/11 and 2011/12 shows a 1% increase.
Ninety-four per cent of those detained for more than 24 hours during 2011/12 were released within 36 hours, the same proportion as the year previously.
Warrants of further detention (issued by magistrates) under PACE, which authorise detention without charge, were applied for on 478 occasions during 2011/12. Ninety-seven per cent of these warrants were granted. A similarly high proportion of warrants was granted in earlier years.
In 2011/12, 60% of those detained under warrant were charged, a decrease of 19 percentage points on 2010/11.
2.3 Data tables
Detentions data, sourced from returns received from police forces in England and Wales, can be found in the detentions tables.
2.4 Data quality and interpreting the figures
The presented figures are correct at the time of publication and include a revision for 2010/11 submitted by Sussex Police with regards to the total number of persons detained for more than 24 hours and subsequently released. As a result, the headline figure for 2010/11 shows a slight decrease from that included within ‘Police Powers and Procedures 2010/11’ (3,997 in this edition compared with 3,999 in last year’s).
Not all forces have been able to provide figures for 2010/11 and/or 2011/12, for example they may not have been able to extract relevant figures from their recording system. Data for the following have, therefore, been excluded when comparing changes over time: Cheshire, Cleveland, Dorset, Hampshire, Northumbria, North Yorkshire, West Midlands, Wiltshire and South Wales.
2.5 Potential uses of the data
Figures on police detention are reported to the Home Office for the purposes of monitoring whether police forces are using their powers of further detention appropriately, rather than to ascertain charging rates. As a result, no figures are collected on the number of persons charged after being held for less than 36 hours with no warrant applied for. Information received for 2011/12 from South Wales Police shows that it detained one person for longer than authorised during the year.
Figures on charging rates for when a person is held for more than 36 hours under warrant are collected because, in these instances, persons can be held in police custody for up to 96 hours and it is important to monitor charging rates when persons are held for extended periods of time.
3. Stops and searches
3.1 Introduction
This section looks at stops and searches conducted by police under various legislation, under which police are able to search persons and vehicles without a warrant. A summary of the relevant powers is included in the User Guide.
Financial year data on the type and reason for stops and searches, ethnicity of persons stopped and searched and resultant arrests are presented. These are based on returns submitted to the Home Office from police forces in England and Wales including, since 2009/10, the British Transport Police (BTP). While BTP’s stop and search data are included in comparisons between 2010/11 and 2011/12, they are excluded from longer-term trends.
Figures reported to the Home Office on stops and searches, and resultant arrests, reflect police activity and should not be used to infer levels of crime.
3.2 Key facts
Police stopped and searched 1.2 million persons and/or vehicles in 2011/12, a decrease of 9% on 2010/11. These comprised:
- 1.1 million stops and searches under section 1 of the Police and Criminal Evidence Act (PACE), a fall of 7% on 2010/11. Nine per cent of the section 1 stops and searches in 2011/12 resulted in an arrest.
- 46,961 stops and searches in anticipation of violence (under section 60 of the Criminal Justice and Public Order Act 1994), a 25% decrease compared to the previous year.
In 2011/12, there were no searches conducted under section 47A of the Terrorism Act 2000 (TACT), compared to 11,787 conducted under section 44 (the power replaced by section 47A) in the previous year.
Stops and searches by legislation (excluding BTP), 2002/03 to 2011/12
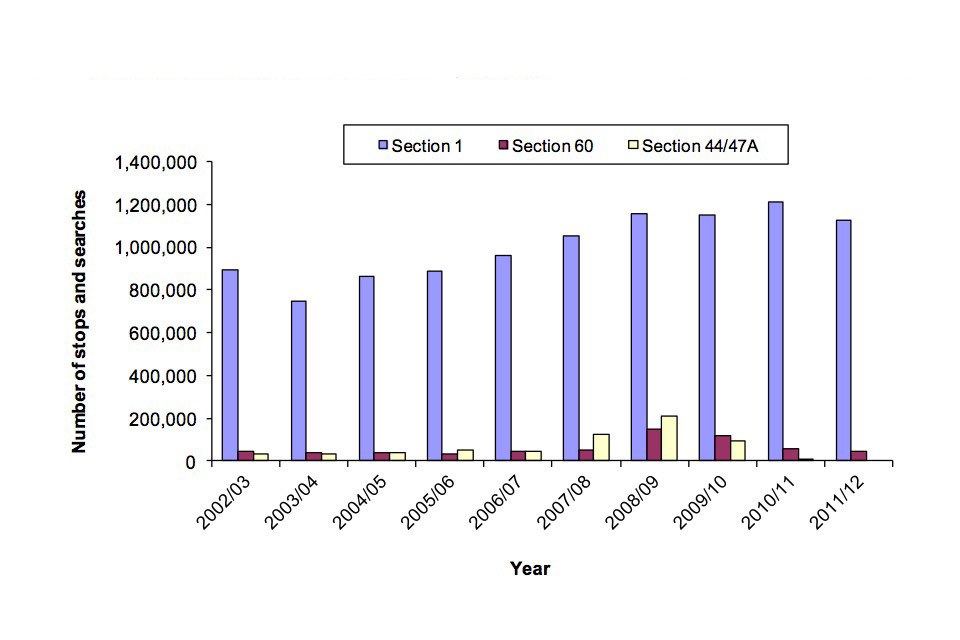
Number of stops and searches from 2002/3 to 2011/12 by legislation, sections 1, 60 and 44/47A.
Chart notes
Source: Home Office, Stops and searches tables SS.01
Forty-three per cent of all stops and searches in 2011/12 were carried out by the London forces (City of London and Metropolitan Police Service), a slightly smaller proportion than during the previous year (46%).
Ethnicity self-classifications of persons stopped and searched under section 1 of PACE in 2011/12 were of similar proportions across all ethnic groups as in the previous year. The majority (67%) of persons searched under these powers defined themselves as White.
3.3 Data tables
Data sourced from statistical returns received from police forces in England and Wales can be found in the stops and searches tables.
3.4 Section 1 of the Police and Criminal Evidence Act 1984 (and associated legislation)
These legislation give police the power to search persons and/or vehicles for a range of items including stolen property, offensive weapons, controlled drugs or evidence that a person is a terrorist.
Stops and searches under section 1 of PACE fell from 1,229,324 in 2010/11 to 1,137,551 in 2011/12, down 7%.
Ninety-nine per cent of the 1,137,551 searches conducted throughout England and Wales under section 1 of PACE in 2011/12 were of persons, the same proportion as seen in 2010/11.
Excluding data for Dyfed-Powys and Devon and Cornwall (see section on data quality and interpreting the figures), the articles most commonly searched for in 2011/12 were drugs (50% of the total), and stolen property (21%). These had also been the most commonly searched for articles in 2010/11. There were increases in only one of the seven categories of reason for search in 2011/12 (stolen property; up less than 1% to 236,469). Of all the other categories of search, the biggest percentage decrease was recorded for other offences, down 31% (to 42,055) followed by offensive weapons, which fell by 18% (to 99,915).
In 2011/12 the number of arrests following a stop and search fell by 6% to 107,068. At 9%, the proportion of people arrested following a stop and search in 2011/12 remained the same as in 2010/11.
Excluding data for Dyfed-Powys, Devon and Cornwall and Sussex (see section on data quality and interpreting the figures), the majority of arrests resulting from stops and searches in 2011/12 were for drugs (39,741) and stolen property (28,424), which represented more than half of all arrests made as a result of searches under section 1 of PACE.
3.5 Section 60 of the Criminal Justice and Public Order Act 1994
Under section 60 of the Criminal Justice and Public Order Act 1994 police have powers to stop and search persons and/or vehicles in anticipation of violence.
There were 46,961 such searches carried out in 2011/12 compared to 62,429 in 2010/11, a decrease of 25%.
Excluding figures from the BTP, the number of section 60 searches averaged around 41,000 between 2002/03 and 2006/07. In 2007/08 the number rose to 53,501 and then tripled in 2008/09 to 150,174. This large increase coincided with two initiatives aimed at reducing knife crime – Operation Blunt 2, launched by the Metropolitan Police Service on 19 May 2008, and the Home Office’s Tackling Knives Action Programme, launched in June 2008. The number of section 60 searches in England and Wales (excluding BTP) in 2011/12 was more similar to the levels recorded before the above initiatives were launched.
Including the BTP, 35 forces are recorded as having used section 60 stops and searches in 2011/12, compared to 37 forces in 2010/11. The proportion of stops and searches resulting in an arrest under these powers varied across the forces; overall, 3% led to an arrest in 2011/12, one percentage point higher than in 2010/11.
Almost all (99.8%) of the 46,961 searches conducted under section 60 in 2011/12 were of persons. Only 90 were of vehicles.
3.6 Section 47A of the Terrorism Act 2000
Section 47A of TACT allows the police to stop and search persons, without reasonable suspicion, in order to prevent acts of terrorism. Searches under this power may only be authorised in a specific area for a defined period where the police reasonably suspect an act of terrorism will take place. Section 47A stop and search powers replaced similar powers under section 44 of TACT on 18 March 2011. There has, as yet, been no use of new stop and search powers under s47A of TACT.
Data on long-term trends presented in the stop and search tables combine data on both section 44 and section 47A searches. Further information on the background to this change can be found in the User Guide.
3.7 Geographical patterns
Forty-three per cent of all stops and searches in England and Wales were conducted by the Metropolitan Police Service in 2011/12. The police force who conducted the next highest number of searches was Greater Manchester, which conducted 4% of all searches in England and Wales.
Nine per cent of all searches in 2011/12 in England and Wales led to an arrest. Police forces with the highest proportion of arrests were Kent (19%), Northumbria (17%), Cleveland (16%) and Sussex (also 16%). Cumbria had the lowest proportion at 3%.
There were 21 searches per 1,000 population throughout England and Wales in 2011/12. Rates for police forces varied widely, from 2 searches per 1,000 population by Essex, to 62 per 1,000 population in the area covered by the Metropolitan Police Service.
3.8 Ethnicity of persons searched under section 1 of PACE
Police ask persons being stopped and searched to define their ethnicity. For the purposes of this analysis, ethnicities are grouped into 6 main categories: White; Black (or Black British); Asian (or Asian British); Chinese or Other; Mixed; and, not stated.
Self-classifications of persons stopped and searched under section 1 of PACE in 2011/12 were of similar proportions across all ethnic groups as compared to the previous year. In 2011/12, 67% of the persons defined themselves as White, 14% as Black and 10% as Asian. Smaller proportions defined themselves as Chinese or Other (1%) or Mixed (3%). The ethnicity for 4% of persons was not stated.
A large proportion of section 1 stops and searches were conducted by the Metropolitan Police Service, and these have had considerable effect on the proportions for England and Wales as a whole. Excluding stops and searches by the Metropolitan Police Service, the majority of persons searched under section 1 in England and Wales in 2011/12 were White (83%); much smaller proportions were Asian (6%) or Black (4%). In contrast, of the persons searched under section 1 by the Metropolitan Police Service, 43% defined themselves as White, 28% as Black and 16% as Asian. Proportions of persons searched by the Metropolitan Police Service who defined themselves as Mixed (4%) or Chinese or Other (2%) were slightly higher than those seen in other forces in England and Wales (2% and 0.5% respectively).
Fifty-one per cent of the stops and searches conducted by the Metropolitan Police Service were on Minority Ethnic persons, compared to 13% across all other forces. This in part is explained by both the high population density and the high Minority Ethnic populations (resident and visitor) within the Metropolitan Police Service area.
Nine per cent of the section 1 stops and searches in 2011/12 resulted in an arrest. There was little difference between the proportions across the ethnic groupings, ranging from 7% for those defining themselves as Asian and 11% defining themselves as Chinese or Other or mixed.
3.9 Data quality and interpreting the figures
Data presented here have been sourced from annual statistical returns received from police forces in England and Wales including, since 2009/10, the BTP. Data from the BTP are included in comparisons between 2010/11 and 2011/12 stops and searches, though are excluded from longer-term trends.
The presented figures are correct at the time of publication. They may include revisions submitted by forces for the years covered by, and received since the publication of, ‘Police Powers and Procedures 2010/11’.
Two forces – Dyfed-Powys and Devon and Cornwall – have reported that their recording systems do not allow them to accurately categorise section 1 stops and searches at the current time, resulting in them including a higher number of searches than other forces in the ‘other’ category. In addition, Sussex police reported the same problem with their data on arrests resulting from searches under section 1 in 2010/11. Tables SS.01 to SS.03 present the figures as received from these forces. While the total numbers of section 1 stops and searches for these forces are included in the overall comparison between 2010/11 and 2011/12, data for Dyfed-Powys and Devon and Cornwall have been excluded in individual search type comparisons at the bottom of Tables SS.02 and data for all 3 police forces are excluded in comparisons presented in Table SS.03. Efforts are being made to resolve this issue for the ‘Police Powers and Procedures 2012/13’ release.
Due to the relatively small numbers of persons stopped and searched under section 60 of the Criminal Justice and Public Order Act 1994, caution is needed when examining the ethnic breakdown of those arrested as a result of such stops and searches. In addition, differences in the proportion of Black or Minority Ethnic persons stopped and searched in some police force areas (eg Metropolitan, West Midlands) may, in part, reflect the different proportions of ethnic groups in the overall population, including visitors, in those areas.
The User Guide provides further details relating to definitions, legislation and procedure.
The presented figures are correct at the time of publication and may include revisions submitted by forces for the years covered by, and received since the publication of, the previous year’s edition. Due to revisions for 2010/11 submitted by Cumbria, West Yorkshire and the British Transport Police, headline figures for searches and resultant arrests presented in this release show changes from figures included within ‘Police Powers and Procedures 2010/11’. For section 1, the number of searches has been revised upwards from 1,222,378 to 1,229,324 this release. The largest change relates to 6,870 additional section 1 searches for 2010/11 reported by West Yorkshire in this release, which missed inclusion in ‘Police Powers and Procedures 2010/11’ due to delays associated with a new data capture system within the force. The number of section 60 searches in 2010/11 has been amended from 60,963 to 62,429 in this release. Section 44 searches data for 2010/11 have been revised slightly downwards from 11,792 to 11,787. For resultant arrests the changes were: 113,676 to 114,236 for section 1 and 1,403 to 1,414 for section 60. Data on arrests resulting from section 44 searches made in 2010/11 have not been revised.
3.10 Potential uses of the data
The key user of stop and search statistics is the Ministry of Justice (MoJ), which presents data collated from various government departments and agencies in its biennial statistical publications on race and the criminal justice system. Within the Home Office the statistics are used by a range of policy advisers, social researchers and economists in order to inform policy and operational decisions by ministers. Additionally, these data are used regularly to answer Parliamentary Questions tabled by Members of Parliament.
3.11 Other data sources
Quarterly figures for stops and searches under the Terrorism Act 2000 (of persons only) appear in the Home Office online statistical series ‘Operation of police powers under the Terrorism Act 2000 and subsequent legislation: Arrests, outcomes and stops & searches’. Links to the latest annual and quarterly bulletins can be found at Counter terrorism statistics.
Whilst some ethnic breakdowns are provided here, detailed figures and analysis continue to be the responsibility of MoJ. The latest edition of its ‘Statistics on Race and the Criminal Justice System’ series is online at ‘Race and the criminal justice system 2010’. However, it should be noted that the figures presented in the latest edition relate only to the years up to and including 2009/10, and may since have been revised. The next edition of ‘Statistics on Race and the Criminal Justice System’, with figures up to and including 2011/12, is expected to be published in the autumn of 2013.
4. Road checks
4.1 Introduction
This section covers the use of police powers, under section 4 of the Police and Criminal Evidence Act (PACE) 1984, to conduct road checks. It examines the number of times this power was used and the number of arrests resulting from road checks. The data presented are drawn from returns from police forces in England and Wales, excluding the British Transport Police, and are on a financial year basis.
Further details relating to definitions, legislation and procedures are given in the User Guide.
4.2 Key facts
A total of 15 road checks were carried out in 2011/12, 14 fewer than in 2010/11. They were conducted within 9 police force areas, the same number as the year before.
- The total number of vehicles recorded as having been stopped in road checks was 2,697 in 2011/12, down 24% (or 869 vehicles) from 2010/11. The number has decreased year on year since 2007/08, when 7,200 vehicles were stopped.
- An average of 180 vehicles were stopped in each road check in 2011/12, compared with 123 in 2010/11.
- As in previous years, the majority of road checks in 2011/12 were conducted to ascertain whether a vehicle was carrying a person who had witnessed an indictable offence.
- The number of arrests made as a result of road checks remains relatively low. There were 4 such arrests in 2011/12, all of which were connected with the reason for the road check.
4.3 Data tables
Data sourced from statistical returns submitted by police forces in England and Wales are available in the road checks tables.
4.4 Data quality and interpreting the figures
The presented figures are correct at the time of publication. They may include revisions submitted by forces for the years covered by, and received since the publication of, ’Police Powers and Procedures 2010/11’.
For 2011/12, 6 forces were unable to supply road checks data (Cambridgeshire, Gloucestershire, Hampshire, Warwickshire, West Mercia and Wiltshire).
The User Guide provides further details relating to definitions, legislation and procedures, and data quality.
5. Intimate searches
5.1 Introduction
This section covers the use of police powers, under section 55 of the Police and Criminal Evidence Act (PACE) 1984, to conduct intimate searches. It examines the number of times this power was used, the reasons for intimate searches and the results of such searches. The data presented are drawn from returns from police forces in England and Wales, excluding the British Transport Police, and are on a financial year basis.
Further details relating to definitions, legislation and procedures are given in the User Guide.
5.2 Key facts
Eighty-four intimate searches were carried out in 2011/12, 10 fewer than during the previous year.
- Drugs accounted for 90% of known reasons for intimate searches in 2011/12, the same as in 2010/11.
- In 2011/12, class A drugs (mainly heroin, other opiate drugs, LSD and cocaine) were found during 18% of the intimate searches made for drugs, compared with 20% in 2010/11.
- One of the eight searches conducted for harmful articles in 2011/12 resulted in 1 or more such object(s) being found.
5.3 Data tables
Data sourced from statistical returns submitted by police forces in England and Wales are available in the intimate searches tables.
5.4 Data quality and interpreting the figures
The presented figures are correct at the time of publication. They may include revisions submitted by forces for the years covered by, and received since the publication of, ’Police Powers and Procedures 2010/11’.
The data include only those intimate searches where data on who conducted the search are available. For 2011/12, 4 forces were unable to supply intimate searches data to the Home Office (Dorset, Gloucestershire, Kent and Wiltshire).
The User Guide provides further details relating to definitions, legislation and procedures, and data quality.
6. Fixed Penalty Notices
6.1 Introduction
This section covers the use of police powers to issue fixed penalty notices (FPNs) for endorsable and non-endorsable motoring offences. It looks at FPNs by offence type and how they were dealt with (eg penalty paid or a fine registered at court). The presented data are drawn from returns from police forces in England and Wales.
The User Guide has further information relating to definitions, legislation and procedure.
6.2 Key facts
There were 1.5 million FPNs for motoring offences issued by the police (including police-employed traffic wardens) in 2011, an 18% fall on 2010. Since peaking at 3.5 million in 2003 there have been year-on-year decreases in the total number of FPNs issued.
Issued FPNs can be endorsable (accompanied with penalty points on licence) or non-endorsable depending on the nature and severity of the offence committed. Numbers of endorsable and non-endorsable FPNs both fell in 2011 when compared to 2010, by 19% and 16% respectively. Endorsable FPNs issued have halved since their peak of 2.2 million issued in 2005; the 480,000 FPNs issued for non-endorsable FPNs in 2011 compares with 1.5 million issued in 2002, a fall of just over two thirds.
In 2011, increases were recorded in only 2 of the 12 FPN offence categories. These were the other offences category (up 8%), which includes load offences (e.g. dangerous loads or exceeding the axle weight) and offences peculiar to motor cycles (e.g. failure to wear a crash helmet), and vehicle test and condition offences (up 1%). The number of FPNs issued for these 2 offence groupings accounted for only 6% of all FPNs issued in England and Wales in 2011. The largest decrease in 2011 was for obstruction, waiting and parking offences (down 30%) followed by speed limit offences (down 21%).
The largest decrease in numerical terms was for speed limit offences (down 208,112 offences), though the 778,632 FPNs issued for these offences still accounted for just over half of all FPNs issued in 2011.
The number of FPNs issued for using a handheld mobile phone while driving fell by 7% in 2011 compared to the previous year, from 124,728 to 116,144.
For the first time in 2011, data on FPNs for work record or employment offences are included in this chapter. This offence type relates to the failure of employers and employees to monitor/observe limits on hours of driving to ensure rest requirements are being met. In 2011, 7,187 FPNs were issued for these offences in England and Wales.
Trend in endorsable and non-endorsable fixed penalty notices, 2002 to 2011
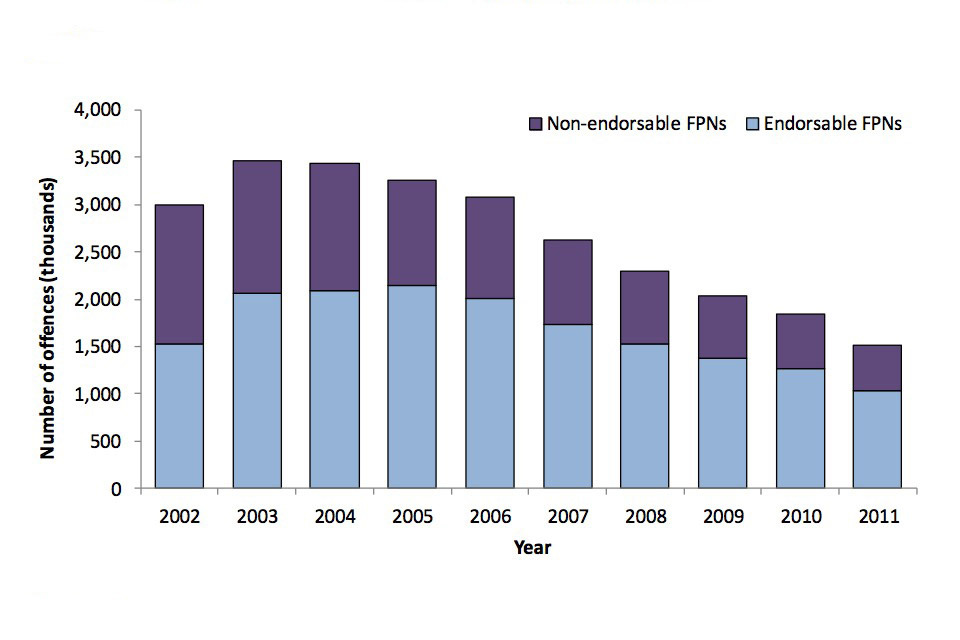
Number of non-endorsable fixed penalty notices and endorsable fixed penalty notices by year from 2002 to 2011.
Chart notes
Source: Home Office, Fixed Penalty Notices table FPN.01
6.3 Data tables
Data sourced from statistical returns received from the 43 police forces in England and Wales can be found in the Fixed Penalty Notices tables. Those in list format cover the years 2007 to 2011 only.
6.4 Additional analysis
Eighty-nine per cent of the FPNs issued by the police in 2011 were paid, while a fine was automatically registered at court for a further 8%. The proportion of both of these outcomes has remained stable since 2005.
FPNs are more likely to be paid for endorsable offences. In 2011, the payment rate for endorsable FPNs was 97%, compared with a 72% payment rate for non-endorsable offences in 2011 issued with the driver present and a 78% payment rate for non-endorsable offences issued where the driver was absent.
Data on payment rates for FPNs should be seen in the context of large falls in FPNs issued over the last ten years, which may impact on payment rates. Most notably, the total number of non endorsable FPNs issued where the driver was absent has fallen by 88% between 2002 and 2011, from 1.1 million FPNs to just over 140,000. Further information on these trends can be found in table FPN.05.
While the payment rate for endorsable offences has remained relatively stable since 2002, payment rates for non-endorsable offences have fluctuated more during the last 10 years. Payment rates non-endorsable FPNs issued with the driver present ranged from 71% paid in 2003 to 76% in 2005 and 2006. For those issued where the driver was absent, after a small fall from 2002 to 2003, the payment rate has slowly risen each year since, from 68% in 2003 78% in 2011.
Fixed penalty notices by result, 2002 to 2011

Figures for this table are available in Fixed Penalty Notices table FPN.05.
Source: Home Office, Fixed Penalty Notices table FPN.05
There were 681,099 FPNs issued for camera-detected traffic light and speeding offences in 2011, a 20% decrease compared to 2010 (853,924 offences). The majority of these FPNs (92%) were for speeding offences. Cameras provided evidence for 80% of all speeding offence FPNs issued in 2011, up slightly from 79% in 2010.
6.5 Data quality and interpreting the figures
The National Safety Camera Programme was launched nationally in August 2001. This allowed fixed penalty income from speeding and red traffic light offences to be used to meet the costs of operating the cameras.
On 15 December 2005 the Secretary of State for Transport announced the ending of the National Safety Camera Programme and netting-off funding arrangement for cameras in England and Wales, with effect from March 2007. Camera funding, activities and partnerships were integrated into the wider road safety delivery process from 1 April 2007. Further changes to funding arrangements to increase flexibility were introduced in 2010 and April 2011.
Instead of offering a fixed penalty notice to those who exceed the speed limit but do not require prosecution, forces can use their discretion to offer a speed awareness course. Those who accept the offer and complete the course, at their own expense, are not subject to any other sanction. The majority of forces in England and Wales now offer such courses. These initiatives should be borne in mind when interpreting changes over time.
On 1 April 2009 FPNs for commercial vehicle offences have been introduced, the fine being for graduated amounts. Further information can be found in the User Guide.
The presented figures are correct at the time of publication and may include revisions submitted by forces for the years covered by, and received since the publication of, the previous year’s edition. During the preparation work for this release, City of London Police were found to have incorrectly classified 227 non-endorsable FPNs for offence class 4a (use of mobile phone while driving), as class 4b (careless driving – excluding the use of mobile phone while driving). Figures for endorsable FPNs issued in City of London in 2007 for class 4a have, therefore, increased from 0 to 227 when compared to ‘Police Powers and Procedures 2010/11’; the equivalent figures for 4b have fallen from 233 to 6. Relevant totals for 2007 which include totals for offence class 4a and 4b separately have also been amended in this release.
The User Guide provides further details relating to definitions, legislation and procedure, and data quality.
6.6 Potential uses of the data
Data on FPNs issued for motoring offences, when analysed alongside data on road traffic collisions and fatalities (collected by the Department for Transport) and data on prosecutions for motoring offences (collected by the Ministry of Justice), provide a detailed picture of road safety and levels of road crime enforcement in England and Wales each year. This information allows colleagues in all three departments to inform policy and operational decisions by ministers. Additionally, these data are used to answer Parliamentary Questions tabled my Members of Parliament.
6.7 Other data sources
In addition to FPNs for motoring offences, police officers can also issue FPNs for minor disorder offences under the Penalty Notice for Disorder (PND) scheme, which includes possession of cannabis, alcohol consumption and licensing offences. Data on PNDs are collected and published by the Ministry of Justice in its Criminal Statistics: England and Wales quarterly series, available online at Criminal justice statistics. This series also contains figures on court proceedings for motoring offences.
7. Breath Tests
7.1 Introduction
This section covers the use of police powers, under the Road Traffic Act 1988, to conduct breath tests art the roadside (or similar location) to determine whether motorists are driving with alcohol in their body, beyond the prescribed limit. It examines the regional and seasonal use of such powers, as well as the number of motorists who either fail or refuse breath tests. The data presented in this chapter are drawn from returns from police forces in England and Wales and relate only to preliminary roadside breath tests (hereafter referred to as ‘breath tests’) which are conducted to give an indication whether motorists are driving over the limit, and not the subsequent evidential tests.
Further details relating to definitions, legislation and procedure are given in the User Guide.
7.2 Key facts
Police carried out 685,992 breath tests in 2011 compared to 736,846 in 2010. This 7% decrease follows the 10% decrease in the previous year, down from a peak of 815,290 breath tests in 2009.
The number of positive or refused tests in 2011 decreased by 4%, from 84,436 in 2010 to 80,761 in 2011.
Twelve per cent of all breath tests in 2011 were refused or gave a positive result. This is very similar to the proportion found in 2010 (11%) and 2009 (11%).
Trends in breath tests, 2001 to 2010
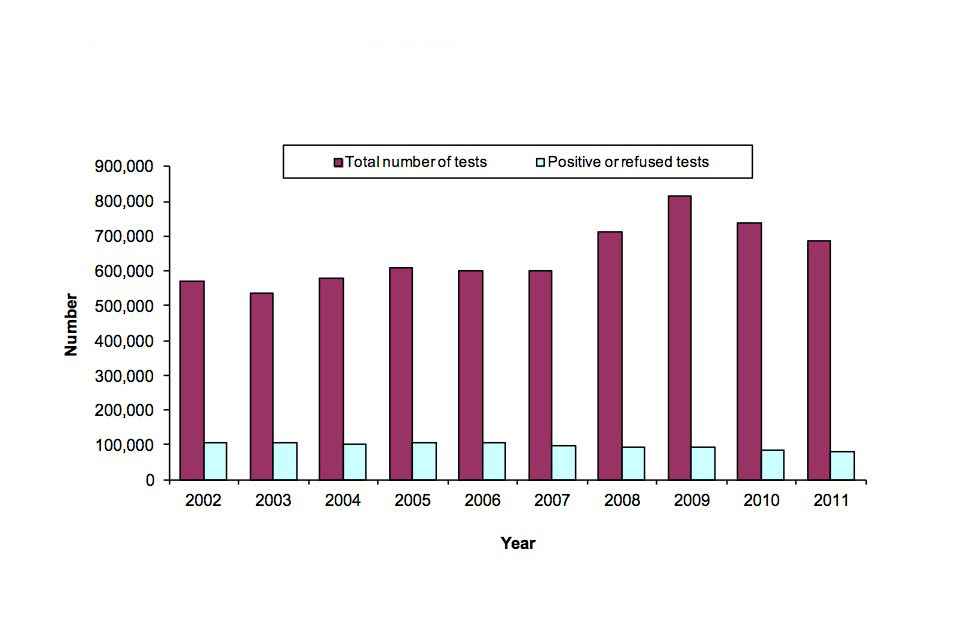
Number of breath tests and positive or refused tests from 2002 to 2011.
Chart notes
Source: Home Office, breath tests table BT.04
7.3 Data tables
Data sourced from statistical returns received from the 43 police forces in England and Wales, can be found in the breath test tables.
7.4 Seasonal variations
The chart below shows the number of breath tests recorded in each of the months in 2011. In December 151,521 breath tests were carried out; this equates to 22% of all breath tests in 2011 and coincides with the annual national Christmas drink and driving campaign.
The number of breath tests carried out in June was 94,485, which was a further 14% of all breath tests in 2011. This is likely to be due to police campaigns against drinking and driving during the summer months.
Excepting the two peaks in June and December, the number in each month ranged between 40,000 and 50,000 with an average of approximately 44,000 tests. Therefore, compared to the average in the other months, the number of tests carried out in June (94,485) was more than double, and in December (151,521) was more than triple, the average in the other months.
Despite the much higher numbers of tests in June and December, compared with the other 10 months, there was a more modest increase in the number of positive/refused tests. There were 9% more positive/refused tests in June and 30% more in December, compared with the average of the other 10 months.
Number of breath tests each month in 2011

Number of breath tests and positive or refused tests for 2011 by month.
Chart notes
Source: Home Office, breath tests table BT.01
7.5 Geographical patterns
In 2011, 12 breath tests were conducted per 1,000 population across England and Wales. The rate for Wales (26 per 1,000 population) was more than twice that for England (11 per 1,000 population). There was a large variation in the number of tests carried out per 1,000 of the population by individual police forces, from 1 per 1,000 population in West Midlands to 35 in Dyfed-Powys and 38 per 1,000 population in North Wales.
The number of breath tests per 1,000 of the population that were positive or refused averaged 1.5 throughout England and Wales, though were not as varied as the total number of breath tests by police force level. The rate of positive or refused tests ranged from 0.9 per 1,000 population in Northumbria, Surrey and Avon and Somerset to 3.2 per 1,000 population in North Wales.
7.6 Data quality and interpreting the figures
The presented figures are correct at the time of publication. They may include revisions submitted by forces for the years covered by, and received since the publication of, ‘Police Powers and Procedures 2010/11’.
A breath alcohol screening test can be required when a driver involved in a collision, is suspected of driving with alcohol in the body or following the commission of a moving traffic offence. Results of breath alcohol screening tests can only be regarded as indicative of the level of alcohol present in a sample of breath and are not used to determine whether a driver was above or below the legal limit to drive. It remains the case that it is only at a police station or hospital that a specimen(s) can be obtained to determine a person’s actual alcohol concentration, using pre-calibrated evidential devices ensuring the sample has not been affected by any interfering substances or that blood or urine specimens may be taken for subsequent laboratory analysis. These subsequent evidential tests are not included in the breath test statistics.
From April 2008, new digital recording equipment started to be used by forces. The devices are able to record exact breath alcohol readings and the result of individual tests, as well as reason for test, time of day, day of week and age and gender profiles of those tested, and results are downloaded to data systems on a monthly basis and provided to the Department for Transport (DfT).
Data presented here have been sourced from annual statistical returns received from the 43 police forces in England and Wales. By 2011, a large number of police forces in England and Wales had been making greater use of the digital breath test devices, in comparison to previous years. However, the manual recording systems are still being used by some police forces. These figures are based on the combined results of both devices. Negative breath tests may previously have been under-reported to the Home Office. It is anticipated that, as more forces use data from the digital devices, this will lead to further improvements in data recording practices by forces.
The User Guide provides further details relating to data quality and interpreting the figures.
7.7 Other data sources
Analysis of reported roadside breath alcohol screening tests, based on data from digital breath testing devices, is published by the (DfT). Latest figures were included within the DfT’s Reported Road Casualties in Great Britain: 2011 Annual Report.
The Association of Chief Police Officers (ACPO) publishes an annual press release showing the number of persons who were required to take a breath test during the Christmas drink and drug driving campaign. This release relates to the period 1 December 2012 to 31 December 2012.