Police powers and procedures England and Wales 2012 to 2013
Published 3 April 2014
Applies to England and Wales

© Crown copyright 2014
This publication is licensed under the terms of the Open Government Licence v3.0 except where otherwise stated. To view this licence, visit nationalarchives.gov.uk/doc/open-government-licence/version/3 or write to the Information Policy Team, The National Archives, Kew, London TW9 4DU, or email: psi@nationalarchives.gov.uk.
Where we have identified any third party copyright information you will need to obtain permission from the copyright holders concerned.
This publication is available at https://www.gov.uk/government/statistics/police-powers-and-procedures-england-and-wales-2012-to-2013/police-powers-and-procedures-england-and-wales-2012-to-2013
This release contains figures on arrests, detentions, road checks, intimate searches, stops and searches, breath tests and fixed penalty notices issued for motoring offences.
These statistics show that:
- There were 1.1 million persons arrested by the police for recorded crimes in 2012/13, down 12% on 2011/12. The number of recorded crimes decreased by 7% over the same period
- The police stopped and searched 1.0 million persons and/or vehicles under section 1 of the Police and Criminal Evidence Act (PACE) and associated legislation in 2012/13, 12% fewer than in 2011/12. Stops and searches on suspicion of drugs accounted for 51% of the total. At 10%, the proportion of people arrested following a section 1 stop and search was 1 percentage point higher than the previous year
- Police also made 5,346 stops and searches in anticipation of violence (under section 60 of the Criminal Justice and Public Order Act 1994), down 89% on 2011/12
- The police issued 1.3 million fixed penalty notices for motoring offences in 2012, down 9% on 2011. Speed limit offences accounted for over half of the notices issued
- The police carried out 682,558 screening breath tests during 2012, 1% fewer than in 2011. The number of positive or refused tests also fell by 6% and accounted for 11% of the total
This statistical release contains statistics at police force area level, with analyses by age and gender. There is also a limited analysis of arrests and stops and searches by ethnicity of those arrested or stopped.
1. Arrests
1.1 Introduction
Statistics are presented here on the police powers of arrest. They relate only to arrests for notifiable offences, which form the coverage of recorded crime statistics, and are on a financial-year basis (April to March). The data are drawn from returns from the 43 local police forces in England and Wales; the Home Office does not receive arrests data from the British Transport Police. They cover trends in arrest rates in England and Wales between the years ending March 2003 and March 2013, as well as breakdowns by offence group, sex and self-defined ethnicity. Unless otherwise indicated, the figures here relate to the year ending March 2013.
Figures on arrests reported to the Home Office reflect police activity and should not be used to infer levels of crime committed by offenders, or their specific characteristics.
The Office for National Statistics (ONS) amended some elements of the published police recorded crime data series in the year ending March 2013 , information about which is included in the user guide. However, the arrest data collection has not been directly influenced by these changes; the figures presented here and in the accompanying tables continue to use the offence groupings violence against the person, sexual offences, robbery, burglary, theft and handling stolen goods, fraud and forgery, criminal damage, drug offences and other offences, though some offences may have moved between categories.
The user guide provides further details relating to definitions.
1.2 Key facts
There was a 12% decrease in the number of persons arrested for notifiable offences in the year ending March 2013 compared with the previous year, from 1.2 million to 1.1 million. Recorded crime in England and Wales decreased by 7% over the same period. The number of persons arrested fell for the sixth successive year, and was the lowest number since the arrests data collection began (1.3 million persons in the year ending March 2000). However, caution is needed when making such comparisons since figures for earlier years included estimates for a few forces that were unable to supply arrests information to the Home Office.
Arrests for violence against the person fell for the sixth consecutive year. The 10% fall in arrests in the last 2 years compares with a 4% fall in the number of violence against the person offences recorded by police in the same period.
There were decreases in the number of arrests in each of age groupings where the age was known (eg persons aged between 10 and 17 years). The number of arrests of persons whose age was unknown increased.
Number of persons arrested by sex, England and Wales, years ending March 2003 to March 2013
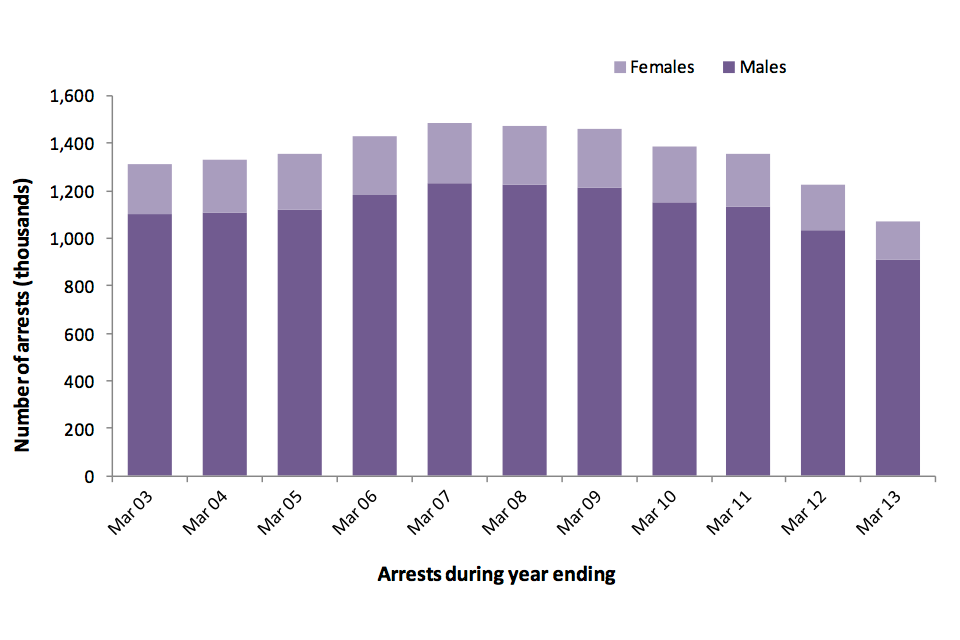
Number of persons arrested by sex, England and Wales, years ending March 2003 to March 2013.
Chart notes
Source: Home Office, arrests table A.01.
1.3 Data tables
Data sourced from returns received from the 43 police forces in England and Wales are available in the arrests tables.
1.4 Arrests by offence group
Decreases in the number of arrests were seen in each of the 9 offence groups. Violence against the person offences had the biggest numerical reduction (down 39,884 arrests, or 10%), but the 340,732 arrests in that category still accounted for almost a third (32%) of all arrests in the year ending March 2013. In terms of percentage change from the year ending March 2012, the biggest fall was for other offences (down 19%, or 33,823 arrests).
Arrests for violence against the person offences fell for the sixth consecutive year, from a peak of 487,569 in the year ending March 2007. There have also been year-on-year decreases for theft and handling of stolen goods, which have fallen from a peak of 419,900 in the year ending March 2003 to 233,471 in the year ending March 2013, and criminal damage, from 169,600 in the year ending March 2006 to 81,392 in the year ending March 2013.
The number of arrests for both sexual offences and drug offences decreased for the second consecutive year, having increased for the previous 3 and 6 years respectively.
Arrests for property crime (burglary, theft, fraud and forgery, and criminal damage) accounted for 39% of all arrests for notifiable offences, the same proportion as in the previous 12 months. The number of arrests for property crime fell by 13% to 418,213, the seventh consecutive year a fall has been reported.
Arrests by offence group, England and Wales, change between years ending March 2012 and March 2013
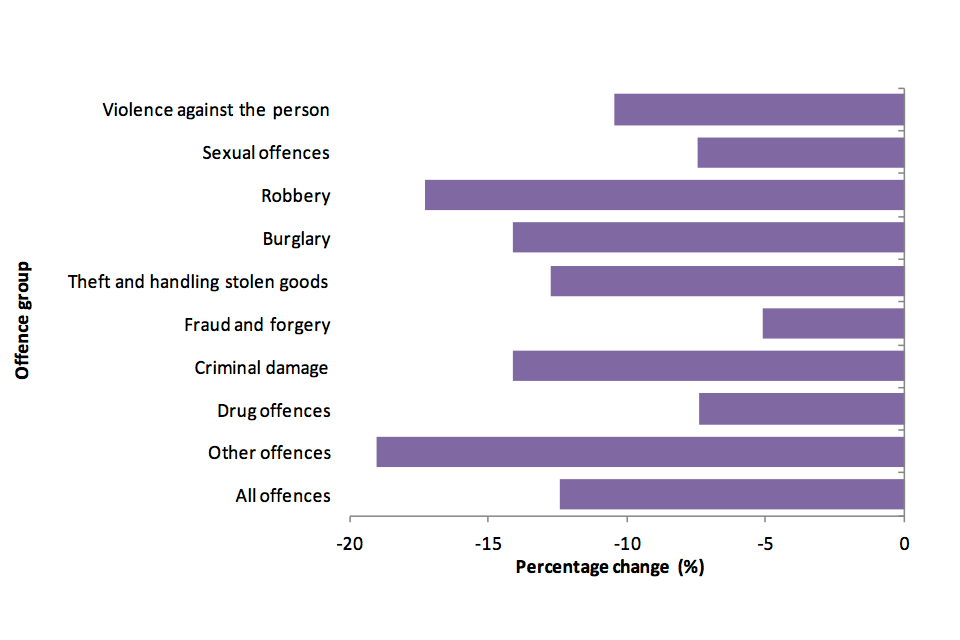
Arrests by offence group, England and Wales, change between years ending March 2012 and March 2013.
Chart notes
Source: Home Office, arrests table A.02.
1.5 Arrests by gender and age
As in previous years, the majority of persons arrested for notifiable offences in the year ending March 2013 were male. Since the year ending March 2004 males have consistently accounted for between 83% and 85% of all arrestees.
Arrests of males and females both fell in the year ending March 2013, with male arrests decreasing by 124,971 (12%) to 910,148, and female arrests decreasing by 27,202 (14%) to 161,920.
There were decreases in the number of arrests of persons aged between 10 and 17 years, between 18 and 20 years and those aged 21 or over, by 24% (to 126,809), 20% (to 136,939) and 9% (to 807,303) respectively.
Over 75% of both male and female arrestees were aged 21 or over (75.1% and 76.2% respectively). Persons in this age grouping accounted for the majority of all persons arrested across all offence groups (ranging between 64% and 86%) apart from robbery, where the majority of persons arrested were aged between 10 and 17 years (36%) or were 21 years or over (44%).
1.6 Arrests by police force area
All but one of the 43 police forces recorded decreases in the number of arrests for notifiable offences in the year ending March 2013 compared to the year before. Dyfed-Powys recorded 11,770 arrests, up slightly from the 11,756 in the previous year. The largest percentage decreases were in City of London (down 38%) and Derbyshire (down 33%), while the smallest decreases were in Leicestershire and Surrey (both down 3%) and Sussex and Thames Valley (both down 2%).
In numerical terms, the greatest decreases in arrests were recorded by the Metropolitan Police Service (down 27,531, or 12%) and Greater Manchester (down 11,779, or 19%). Accounting for 19% of all arrests in England and Wales in the year ending March 2013, the proportion of arrests made by the Metropolitan Police Service remained the same as the previous year.
Arrest rates across police forces in the year ending March 2013 varied widely, from 11 per 1,000 population in both Warwickshire and Wiltshire, to 34 per 1,000 population in Cleveland. The average for England and Wales was 19 arrests per 1,000 population.
1.7 Arrests by ethnicity
Persons arrested are asked to define their ethnicity. For the purposes of this analysis these are grouped into six main categories: White; Black (or Black British); Asian (or Asian British); Chinese or Other; Mixed; and not stated.
Number and proportion of arrests by ethnicity, years ending March 2012 and March 2013
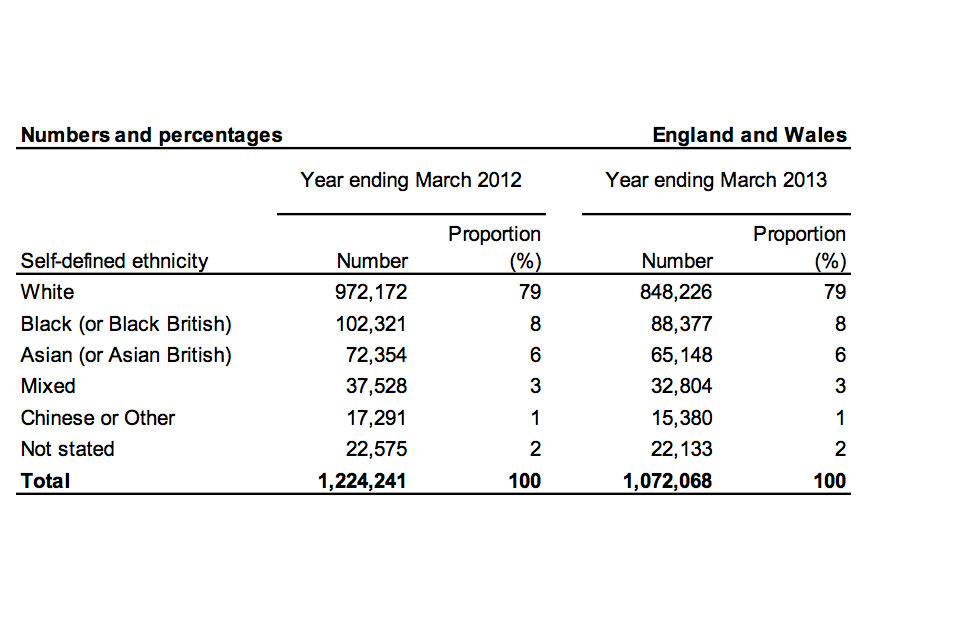
Number and proportion of arrests by ethnicity, years ending March 2012 and March 2013.
Chart notes
Source: Home Office, arrest tables A.04 and A.11.
Seventy-nine per cent of persons arrested in England and Wales in the year ending March 2013 defined themselves as White. A further 8% defined themselves as Black, and 6% as Asian. Smaller proportions of arrested persons defined themselves as being of Chinese or Other (1%) or Mixed (3%) ethnicities. Two per cent of arrestees did not define their ethnicity. These proportions of arrests by ethnicity were very similar to those in the previous year.
Some forces, however, recorded larger proportions of arrestees who defined themselves as Black (eg Metropolitan, 26%; West Midlands, 12%; Bedfordshire, 11%) or Asian (eg West Midlands and Bedfordshire, both 14%; Metropolitan and West Yorkshire, both 12%; Leicestershire, 11%) than for England and Wales as a whole. A much lower proportion of persons arrested by the Metropolitan Police Service defined themselves as White (49%) than compared with all of England and Wales (79%).
1.8 Data quality and interpreting the figures
The presented figures are correct at the time of publication and may include revisions submitted by forces for the years covered by, and received since the publication of, the previous year’s edition.
It should be borne in mind that figures on sexual offences are heavily influenced by the willingness of victims to report. In addition, the number of arrests for drug offences is greatly dependent on police activities and priorities, and doesn’t give a reliable indication of trends in the level of drug offending.
Comparisons with recorded crime are limited here to trends over time. As arrests relate to persons and recorded crime to offences, it is not appropriate to compare actual numbers.
In line with a recommendation by the National Statistician’s Review of Crime Statistics for England and Wales, which identified fraud as one of the gaps in crime statistics, police recorded crime data published by the Office for National Statistics (ONS) now include information from additional sources such as Action Fraud and the National Fraud Intelligence Bureau. Information about the ONS’s changes to offence classifications can be found via their crime statistics methodology webpage. Data on arrests presented in this release have been unaffected by this; all arrests for notifiable fraud and forgery offences are included in the figures.
Due to the small resident population within the City of London police force area, caution is needed when examining the ethnic breakdown of those arrested by that force. Differences in the proportion of Black or Minority Ethnic arrestees in some police force areas (eg Metropolitan, West Midlands) may, in part, reflect the different proportions of ethnic groups in the overall population, including visitors, in those areas.
1.9 Revisions analysis
Due to revisions for the years ending March 2011 and March 2012 submitted by Lincolnshire, headline figures show decreases on those included within Police powers and procedures 2011/12 (1,353,740 and 1,224,241 in this edition compared with 1,361,965 and 1,235,028 in last year’s respectively). The resubmissions were required after force statisticians found that counting rules had not been followed correctly.
1.10 Potential uses of the data
The key users of arrest statistics are the Ministry of Justice (MoJ) and Youth Justice Board (YJB), both of which present data collated from various government departments and agencies in statistical publications looking at race, women and young people and the criminal justice system. Within the Home Office the statistics are used by a range of policy advisers, social researchers and economists in order to inform policy and operational decisions by ministers.
Whilst some ethnic breakdowns are provided here, detailed figures and analysis continue to be the responsibility of MoJ. The latest edition of its Statistics on Race and the Criminal Justice System series was published in November 2013. Figures presented relate to the period up to and including financial year ending March 2012, and may since have been superseded by data included in this edition of Police powers and procedures. The next edition of MoJ’s bulletin, with arrest figures for the financial year ending March 2014, is expected to be published in the autumn of 2015.
MoJ also publishes biennial statistics on the representation of females and males as victims, suspects, offenders and employees in the criminal justice system. Its latest statistics can be found in Statistics on Women and the Criminal Justice System 2011, and includes arrest figures for the financial year ending March 2011. The next edition, which will include arrests data for the financial year ending March 2013, is scheduled to be published in November 2014.
The YJB’s series on Youth Justice Statistics looks at the flow of young people through the Youth Justice System. The latest edition was released in January 2014 and includes arrests data for the financial year ending March 2012, which may since have been superseded by data included in this edition of Police powers and procedures.
1.11 Other data sources
Data on individuals given an out of court disposal or proceeded against at court are published in MoJ’s Criminal Statistics: England and Wales quarterly series.
Crime statistics, including police recorded crime figures, are published by ONS on a quarterly basis.
2. Detentions
2.1 Introduction
Under section 42 of the Police and Criminal Evidence Act (PACE) 1984, detention in police custody before charge on the authority of a police officer is normally limited to 24 hours except where the alleged offence is an indictable one, where the maximum is 36 hours. From 20 January 2004, new powers were introduced which enabled a superintendent or above to authorise continued detention for up to 36 hours for all arrestable offences. Additionally, the police can apply to magistrates to authorise warrants of further detention, extending the maximum detention period without charge to 96 hours. With effect from 1 January 2006 the offence coverage was revised to include all indictable offences. Figures presented here are on a financial-year basis and relate to the year ending March 2013 unless otherwise indicated.
Information about data quality and interpreting the figures is given below. Further details relating to definitions can be found in the user guide.
2.2 Key facts
The overall number of persons detained for more than 24 hours (up to a maximum of 96 hours) under PACE and subsequently released without charge was 3,742 during the year ending March 2013. A like-for-like comparison of those police forces who provided data for both that and the previous year shows a 9% decrease.
Ninety-five per cent of those detained for more than 24 hours were released within 36 hours, up 2 percentage points on the previous year.
Warrants of further detention were applied for on 457 occasions, 92% of which were granted. A similarly high proportion of warrants was granted in earlier years.
Seventy-two per cent of those detained under warrant were charged, an increase of 11 percentage points compared to the previous year.
2.3 Data tables
Detentions data, sourced from returns received from police forces in England and Wales, can be found in the detentions tables.
2.4 Data quality and interpreting the figures
The presented figures are correct at the time of publication. There have been no revisions submitted by forces for the years covered by, and received since the publication of, Police powers and procedures 2011/12.
Five forces (Hampshire, Lincolnshire, Thames Valley, West Midlands and Wiltshire) were unable to supply the Home Office with detentions data for the year ending March 2013. Two further forces (Dorset and Cheshire) could supply only partial data.
2.5 Potential uses of the data
Figures on police detention are reported to the Home Office for the purposes of monitoring whether police forces are using their powers of further detention appropriately, rather than to ascertain charging rates. As a result, no figures are collected on the number of persons charged after being held for less than 36 hours with no warrant applied for.
Figures on persons held for more than 36 hours under warrant are, however, collected. This is because such persons can be held in police custody for up to 96 hours and it is important to monitor charging rates when persons are held for extended periods of time.
3. Stops and searches
3.1 Introduction
This section looks at stops and searches conducted by police under various legislation, under which police are able to search persons and vehicles without a warrant. A summary of the relevant powers is included in the user guide.
Financial year data (April to March) between the years ending March 2003 and March 2013 are presented, covering the type and reason for stops and searches, the ethnicity of persons stopped and searched and resultant arrests. These are based on returns submitted to the Home Office from the 44 police forces in England and Wales including, since the year ending March 2010, the British Transport Police (BTP). While BTP’s stop and search data are included in comparisons for the years ending March 2012 and March 2013, they are excluded from longer-term trends. Unless otherwise indicated, the figures here relate to the year ending March 2013.
Figures reported to the Home Office on stops and searches, and resultant arrests, reflect police activity and should not be used to infer levels of crime committed by offenders, or their specific characteristics.
3.2 Key facts
Police stopped and searched 1,011,533 persons and/or vehicles in the year ending March 2013, a decrease of 15% compared to the previous year. These comprised:
- 1,006,187 stops and searches under section 1 of the Police and Criminal Evidence Act (PACE), a fall of 12%; 10% of these section 1 stops and searches resulted in an arrest
- 5,346 stops and searches in anticipation of violence (under section 60 of the Criminal Justice and Public Order Act 1994), an 89% decrease; 5% of section 60 stops and searches resulted in an arrest
There have been no stops and searches under section 47A (as amended by the Protection of Freedoms Act 2012) of the Terrorism Act 2000 (TACT) since it replaced section 44 of TACT on 18 March 2011.
Thirty-six per cent of all stops and searches in the year ending March 2013 were carried out by the Metropolitan Police Service, a smaller proportion than during the previous year (43%).
Ethnicity self-classifications of persons stopped and searched under section 1 of PACE were of similar proportions across all ethnic groups as in the previous year. The majority (70%) of persons searched under these powers defined themselves as White.
Stops and searches by legislation, England and Wales (excluding BTP), years ending March 2003 to March 2013
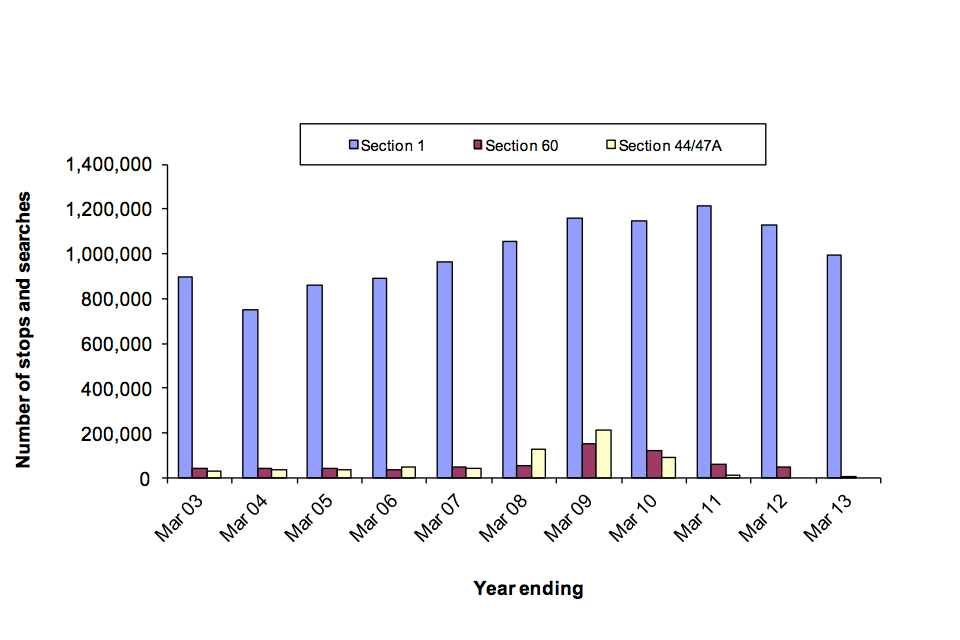
Stops and searches by legislation, England and Wales (excluding BTP), years ending March 2003 to March 2013.
Chart notes
Source: Home Office, stops and searches table SS.01.
3.3 Data tables
Data sourced from statistical returns received from police forces in England and Wales can be found in the stop and search tables.
3.4 Section 1 of the Police and Criminal Evidence Act 1984 and associated legislation
These (hereafter referred to as section 1 of PACE) give police the power to search persons and/or vehicles for a range of items including stolen property, offensive weapons, controlled drugs or evidence that a person is a terrorist. More information is given in the user guide.
In the year ending March 2013, stops and searches under section 1 of PACE fell by 12% (to 1,006,187, from 1,137,849 in the previous year). Ninety-nine per cent of the 1,006,187 searches conducted throughout England and Wales under section 1 of PACE were of persons, the same proportion as seen in the previous year; the remainder were searches of unattended vehicles.
Excluding data for Dyfed-Powys, Devon and Cornwall and South Wales (see section on data quality and interpreting the figures), the articles most commonly searched for were drugs (51% of the total), and stolen property (22%). These had also been the most commonly searched for articles in the previous year. There were decreases in all 7 categories of reason for search. The biggest percentage decrease was recorded for offensive weapons, down 27% (to 72,636) followed by criminal damage, which fell by 24% (to 12,267) and other offences down 23% (to 31,917). In numerical terms, the biggest decrease recorded was for drugs (down 51,480).
The number of arrests following a stop and search fell by 3% to 104,116. At 10%, the proportion of people arrested following a stop and search was 1 percentage point higher than the previous year.
Excluding data for Dyfed-Powys, Devon and Cornwall and South Wales (see section on data quality and interpreting the figures), the majority of arrests resulting from stops and searches were for drugs (40,570) and stolen property (28,461), which together represented 69% of all arrests made as a result of searches under section 1 of PACE.
3.5 Section 60 of the Criminal Justice and Public Order Act 1994
Under section 60 of the Criminal Justice and Public Order Act 1994 police have powers to stop and search persons and/or vehicles in anticipation of violence.
There were 5,346 such searches carried out in the year ending March 2013 compared to 46,966 in the previous year, a decrease of 89%.
Excluding figures from the BTP, the number of section 60 searches averaged around 41,000 per year between the years ending March 2003 and March 2007. In the year ending March 2008 the number rose to 53,501 and then tripled in the year ending March 2009 to 150,174. This large increase coincided with two initiatives aimed at reducing knife crime – Operation Blunt 2, launched by the Metropolitan Police Service on 19 May 2008, and the Home Office’s Tackling Knives Action Programme, launched in June 2008. The number of searches in the year ending March 2012 (45,696) was more similar to the levels recorded before the above initiatives were launched. There was a further substantial decrease – to 4,912 - in the year ending March 2013. Information from some forces suggests this reduction was due to stop and search powers being used in a more focused way.
Including the BTP, 31 forces are recorded as having used section 60 stop and search powers in the year ending March 2013, compared to 35 forces in the previous year. One force was unable to accurately categorise the number of section 60 stops and searches, where persons were found to be carrying offensive weapons or dangerous instruments (see section on data quality and interpreting the figures). The proportion of stops and searches resulting in an arrest under these powers varied across the forces; overall, 5% led to an arrest, 2 percentage points higher than in the previous year.
Almost all (99.9%) of the 5,346 searches conducted under section 60 were of persons. Only 6 were of vehicles.
3.6 Section 47A of the Terrorism Act 2000
Section 47A (as amended by the Protection of Freedoms Act 2012) of the Terrorism Act 2000 (TACT) allows the police to stop and search persons, without reasonable suspicion, in order to prevent acts of terrorism. Searches under this power may only be authorised in a specific area for a defined period where the police reasonably suspect an act of terrorism will take place. Section 47A of TACT stop and search powers replaced similar powers under section 44 of TACT on 18 March 2011. There has, as yet, been no use of stop and search powers under section 47A of TACT.
Data on long-term trends presented in the stop and search tables combine data for section 44 and section 47A searches. Further information on the background to this change can be found in the user guide.
3.7 Geographical patterns
Thirty-six per cent of all stops and searches in England and Wales were conducted by the Metropolitan Police Service in the year ending March 2013, down from 43% in the previous year. The police force which conducted the next highest number of searches was West Yorkshire (4%).
Ten per cent of all searches in England and Wales led to an arrest. Police forces with the highest proportion of arrests were City of London (20%), Sussex (17%) and Cleveland (16%). Cambridgeshire had the lowest proportion at 2%.
There were 18 searches per 1,000 population throughout England and Wales. Rates for police forces varied widely, from 2 searches per 1,000 population by Cheshire, to 57 per 1,000 population in the area covered by Cleveland.
3.8 Ethnicity of persons searched under section 1 of PACE
Police ask persons being stopped and searched to define their ethnicity. For the purposes of this analysis, ethnicities are grouped into 6 main categories: White; Black (or Black British); Asian (or Asian British); Chinese or Other; Mixed; and, not stated.
Excluding data for South Wales Police (see section on data quality and interpreting the figures), the proportion of persons in the year ending March 2013 who defined themselves as White (at 70%) was 3 percentage points higher than the previous year. The proportions who defined themselves as Black (down 2 percentage points to 12%) and Asian (down 1 percentage point to 9%) were slightly lower. There were no changes in the proportions of persons who defined themselves as Chinese or Other (at 1%), Mixed (at 3%) or those who did not state their ethnicity (at 4%).
A large proportion of section 1 stops and searches were conducted by the Metropolitan Police Service, and these have had considerable effect on the proportions for England and Wales as a whole. Excluding stops and searches by the Metropolitan Police Service, there was a larger majority of persons searched under section 1 in England and Wales who were White (84%), and smaller proportions who were Asian (6%) or Black (4%). In contrast, of the persons searched under section 1 by the Metropolitan Police Service, 46% defined themselves as White, 27% as Black and 15% as Asian. Proportions of persons searched by the Metropolitan Police Service who defined themselves as Mixed (4%) or Chinese or Other (2%) were slightly higher than those seen in other forces in England and Wales (2% and 1% respectively).
Forty-nine per cent of the stops and searches conducted by the Metropolitan Police Service were on Minority Ethnic persons, compared to 13% across all other forces. This in part is explained by both the high population density and the high Minority Ethnic populations (resident and visitor) within the Metropolitan Police Service area.
Ten per cent of the section 1 stops and searches resulted in an arrest and there was little difference between the proportions across the ethnic groupings. The proportion was 9% for those self-defining as Asian or not defining their ethnicity, 10% for those self-defining as White and 13% for those defining themselves as Black, Chinese or Other, or Mixed.
3.9 Data quality and interpreting the figures
Data presented here have been sourced from annual statistical returns received from police forces in England and Wales including, since the year ending March 2010, the BTP. Data from the BTP are included in comparisons for the years ending March 2012 and March 2013, though are excluded from longer-term trends.
The presented figures are correct at the time of publication and may include revisions submitted by forces for the years covered by, and received since the publication of, the previous year’s edition.
Three forces reported that their recording systems have not allowed them to accurately categorise section 1 stops and searches, resulting in them including a higher number of searches than other forces in the ‘other’ category. This affected Devon and Cornwall in the years ending March 2010 to March 2012 and Sussex (arrests resulting from searches under section 1) in the years ending March 2010 to March 2011. Dyfed-Powys has been unable to accurately categorise section 1 stops and searches since the year ending March 2011, but is making efforts to resolve this issue for the ‘Police powers and procedures 2014/15’ release. Additionally, the new recording system used by South Wales allowed officers to not choose between any of the 7 search categories and/or the 6 self-defined ethnicity categories, thus creating extra ‘no information’ categories for each.
Tables SS.01 to SS.03 present the figures as received from the above-mentioned 4 forces. They are also included within the section 1 comparison of totals for the years ending March 2012 and March 2013 at the foot of Tables SS.02 and SS.03. They are excluded, however, in the individual search type comparisons at the bottom of Tables SS.02 and SS.03. In Table SS.04, data for Sussex are excluded for the years ending March 2010 and March 2011, Devon and Cornwall data are excluded for the years ending March 2010 to March 2012, Dyfed-Powys data are excluded for the years ending March 2010 to March 2013 and South Wales excluded for the year ending March 2013.
For Tables SS.05 and SS.06, figures for Nottinghamshire have been excluded for the year-on-year comparisons for section 60 stops and searches, where persons were found to be carrying offensive weapons or dangerous instruments. This is because Nottinghamshire currently does not record if an object has been found as a result of stop and search.
Due to the relatively small numbers of persons stopped and searched under section 60 of the Criminal Justice and Public Order Act 1994, caution is needed when examining the ethnic breakdown of those arrested as a result of such stops and searches. In addition, differences in the proportion of Black or Minority Ethnic persons stopped and searched in some police force areas (eg Metropolitan Police Service) may, in part, reflect the different proportions of ethnic groups in the overall population, including visitors, in those areas.
The user guide provides further details relating to definitions, legislation and procedure.
3.10 Revisions analysis
Due to a revision by Nottinghamshire police for the year ending March 2012, headline figures for searches and resultant arrests presented in this release show changes from those included within Police powers and procedures 2011/12; this is because there is a delay in inputting the data onto their system and this will probably happen for future years’ figures. For section 1, this has meant the number of searches (including BTP) has been revised upwards from 1,137,551 to 1,137,849 and resultant arrests 107,068 to 107,095 in this release. The number of section 60 searches in the year ending March 2012 has been amended from 46,961 to 46,966 and resultant arrests from 1,305 to 1,284 in this release.
3.11 Potential uses of the data
The key user of stop and search statistics is the Ministry of Justice (MoJ), which presents data collated from various government departments and agencies in its biennial statistical publication on race and the criminal justice system. Within the Home Office, the statistics are used by a range of policy advisers, social researchers and economists in order to inform policy and operational decisions by ministers. Additionally, these data are used regularly to answer parliamentary questions tabled by members of parliament.
3.12 Other data sources
Quarterly figures for stops and searches conducted in Great Britain under the Terrorism Act 2000 (of persons only) appear in the Home Office online statistical series Operation of police powers under the Terrorism Act 2000 and subsequent legislation: arrests, outcomes and stops & searches.
Whilst some ethnic breakdowns are provided here, detailed figures and analysis will continue to be published by the MoJ. The latest edition of its Statistics on Race and the Criminal Justice System series was published in November 2013. Figures presented relate to the period up to and including the financial year ending March 2012, and may since have been superseded by figures in this current Police powers and procedures release. The next edition of MoJ’s bulletin, with figures for the financial year ending March 2014, is expected to be published in the autumn of 2015.
4. Road checks
4.1 Introduction
This section covers the use of police powers, under section 4 of the Police and Criminal Evidence Act (PACE) 1984, to conduct road checks. It examines the number of times this power was used and the number of arrests resulting from road checks. The data presented are drawn from returns from police forces in England and Wales, excluding the British Transport Police. They are on a financial-year basis and relate to the year ending March 2013 unless otherwise indicated.
Further details relating to definitions, legislation and procedures are given in the user guide.
4.2 Key facts
A total of 26 road checks were carried out in the year ending March 2013, 11 more than in the previous 12 months. They were conducted within 11 police force areas, compared to 9 police force areas the year before.
A total of 3,297 vehicles were recorded as having been stopped in the road checks, up 22% (or 600 vehicles) on the previous year but following 4 annual decreases.
An average of 127 vehicles were stopped in each road check, compared with 180 in the previous year.
As in previous years, the majority of road checks were conducted to ascertain whether a vehicle was carrying a person who had witnessed an indictable offence.
The number of arrests made as a result of road checks remains relatively low. There were 3 such arrests in the year ending March 2013, 1 of which was connected with the reason for the road check.
4.3 Data tables
Data sourced from statistical returns submitted by police forces in England and Wales are available in the road checks tables.
4.4 Data quality and interpreting the figures
The presented figures are correct at the time of publication. There have been no revisions submitted by forces for the years covered by, and received since the publication of, Police powers and procedures 2011/12.
Four forces (Hampshire, Warwickshire, West Mercia and Wiltshire) were unable to supply the Home Office with road checks data for the year ending March 2013.
The user guide provides further details relating to definitions, legislation and procedures, and data quality.
4.5 Potential uses of the data
The key users of these statistics are Home Office policy advisers, who use them in order to inform policy and operational decisions by ministers.
5. Intimate searches
5.1 Introduction
This section covers the use of police powers, under section 55 of the Police and Criminal Evidence Act (PACE) 1984, to conduct intimate searches. It examines the number of times this power was used, the reasons for intimate searches and the results of such searches. The data presented are drawn from returns from police forces in England and Wales, excluding the British Transport Police. They are presented here are on a financial-year basis and relate to the year ending March 2013 unless otherwise indicated.
Further details relating to definitions, legislation and procedures are given in the user guide.
5.2 Key facts
There were 105 intimate searches carried out in the year ending March 2013, 21 more than during the previous year.
As in previous years, drugs accounted for the majority of known reasons for intimate searches (88%).
Class A drugs (mainly heroin and cocaine, including crack) were found during 14% of the intimate searches made for drugs, down 4 percentage points on the previous year.
None of the 13 searches conducted for harmful articles resulted in such object(s) being found.
5.3 Data tables
Data sourced from statistical returns submitted by police forces in England and Wales are available in the intimate searches tables.
5.4 Data quality and interpreting the figures
The presented figures are correct at the time of publication. There have been no revisions submitted by forces for the years covered by, and received since the publication of, Police powers and procedures 2011/12.
The data include only those intimate searches where data on who conducted the search are available. Six forces (Dorset, Hampshire, Kent, Lincolnshire, Thames Valley and Wiltshire) were unable to supply the Home Office with intimate searches data for the year ending March 2013.
The user guide provides further details relating to definitions, legislation and procedures, and data quality.
5.5 Potential uses of the data
The key users of these statistics are Home Office policy advisers, who use them in order to inform policy and operational decisions by ministers.
6. Fixed penalty notices
6.1 Introduction
This section covers the use of police powers to issue fixed penalty notices (FPNs) for endorsable and non-endorsable motoring offences. It looks at FPNs by offence type and how they were dealt with, for example the penalty being paid or a fine registered at court. Data are presented on a calendar-year basis (January to December) and relate to the 43 local police forces in England and Wales.
From June 2012, PentiP, a new national system for processing FPNs, was introduced in police forces across England and Wales, replacing the Vehicle Procedures and Fixed Penalty Office (VP/FPO) system. VP/FPO data, supplied to the Home Office by individual police forces, are presented in this release for the years 2002 to 2011 so that comparisons can be made on the number of FPNs issued during that period. Data for all forces for 2011 and 2012 have been extracted centrally from PentiP, allowing comparisons to be made for those (and future) years. In general, PentiP figures are slightly lower than equivalent ones from VP/FPO; PentiP figures for FPNs issued in England and Wales in 2011 are approximately 5% lower than those drawn from VP/FPO.
The user guide contains further information relating to definitions, legislation, procedure and the change to PentiP.
6.2 Key facts
There were 1.3 million FPNs for motoring offences issued by the police (including police-employed traffic wardens) in 2012, a 9% fall on 2011. Since peaking at 3.5 million in 2003 there have been year-on-year decreases in the total number of FPNs issued.
Issued FPNs can be endorsable (accompanied with penalty points on licence) or non-endorsable depending on the nature and severity of the offence committed. Endorsable FPNs issued have more than halved in number from a peak of 2.2 million in 2005 to 1.0 million in 2011; non-endorsable FPNs have also fallen from 1.5 million issued in 2002 to 480,000 in 2011, a fall of 67%. There were falls in endorsable and non-endorsable FPNs in 2012 when compared to 2011, to 940,000 (down 6%) and 369,000 (down 16%) respectively.
In 2012, increases were recorded in 3 of the 13 FPN offence categories compared to 2011. These were work record and employment offences (up 9%), careless driving offences (excluding use of a handheld mobile phone while driving, up 5%) and the other offences category (up 3%), which includes load offences (eg dangerous loads or exceeding the axle weight) and offences peculiar to motor cycles (eg failure to wear a crash helmet). The FPNs issued for these 3 offence categories accounted for only 2% of all FPNs issued in England and Wales in 2012.
For the first time in this series, data have been included (for 2011 and 2012) relating to the failure to hold an operator’s licence. Although this offence grouping had the largest decrease in percentage terms in 2012 (down 27%), the number of FPNs issued was very low (58 in 2012 compared to 79 in 2011). Other notable falls in percentage terms were for obstruction, waiting and parking offences (down 26%) and use of a handheld mobile phone while driving (down 25%).
The largest changes in numerical terms were for obstruction, waiting and parking offences (down 34,086 offences), use of a handheld mobile phone while driving (down 30,472 offences), seat belt offences (down 24,173 offences) and neglect of traffic signs and directions (down 21,227 offences).
The number of FPNs issued for speeding offences fell by 1% in 2012 compared to the previous year, from 738,528 to 729,299. In 2012, FPNs issued for this offence category amounted to 56% of the total FPNs issued during the year.
Trend in endorsable and non-endorsable fixed penalty notices, 2002 to 2012
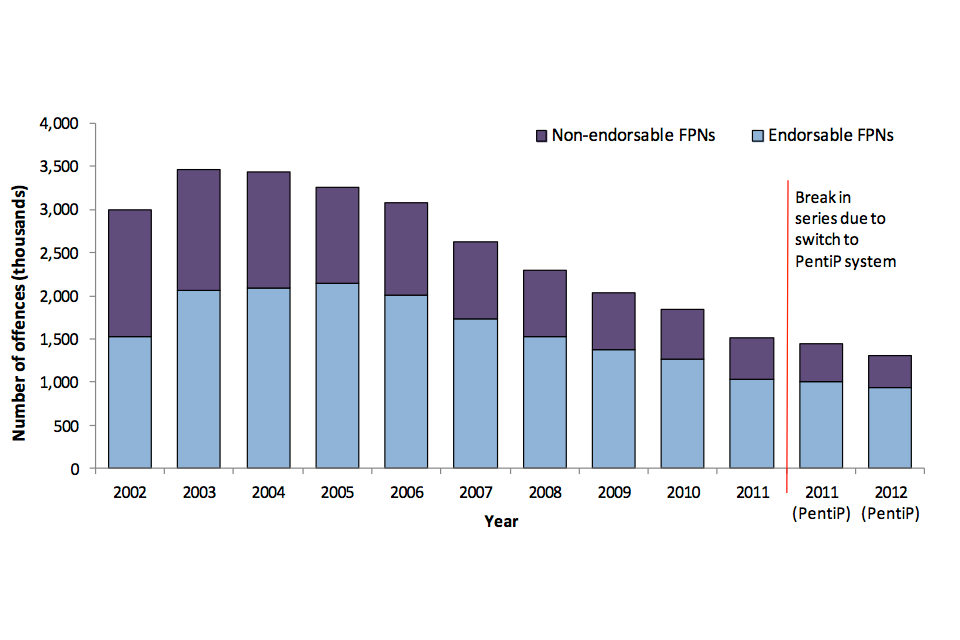
Trend in endorsable and non-endorsable fixed penalty notices, 2002 to 2012.
Chart notes
Source: Home Office, fixed penalty notice table FPN.01.
6.3 Data tables
Data for the 43 police forces in England and Wales can be found in the fixed penalty notice tables. Those in list format cover the years 2007 to 2012 only.
6.4 Additional analysis
In this section data are presented on FPN payment rates and the also the number of FPNs issued as a result of evidence from camera devices. Payment rates figures for 2011 and 2012 taken from PentiP are not directly comparable with data for previous years due to the exclusion of FPNs referred for court proceedings and those for which there were no further action on PentiP.
Ninety-two per cent of the FPNs issued by the police in 2012 were paid, while a fine was automatically registered at court for the remaining 8% (the same payment rates as the previous year). Payment rates have been relatively stable since 2003.
FPNs are more likely to be paid for endorsable offences. In 2012, the payment rate for endorsable FPNs was 97% (the same level as last year), compared with a 79% payment rate for non-endorsable offences issued with the driver present (up 2 percentage points on 2011) and an 86% payment rate for non-endorsable offences issued where the driver was absent (the same level as 2011).
Data on payment rates for FPNs should be seen in the context of large falls in FPNs issued over the last 10 years, which may impact on payment rates. Most notably, the total number of non-endorsable FPNs issued where the driver was absent has fallen by 88% between 2002 and 2011, from 1.1 million FPNs to just over 140,000, and fell an additional 24% between 2011 and 2012 to 101,000. Further information on these trends can be found in Table FPN.05.
While the payment rate for endorsable offences has remained relatively stable since 2002 at around 98%, payment rates for non-endorsable offences have fluctuated more between 2002 and 2012.
Fixed penalty notices by result, 2002 to 2012
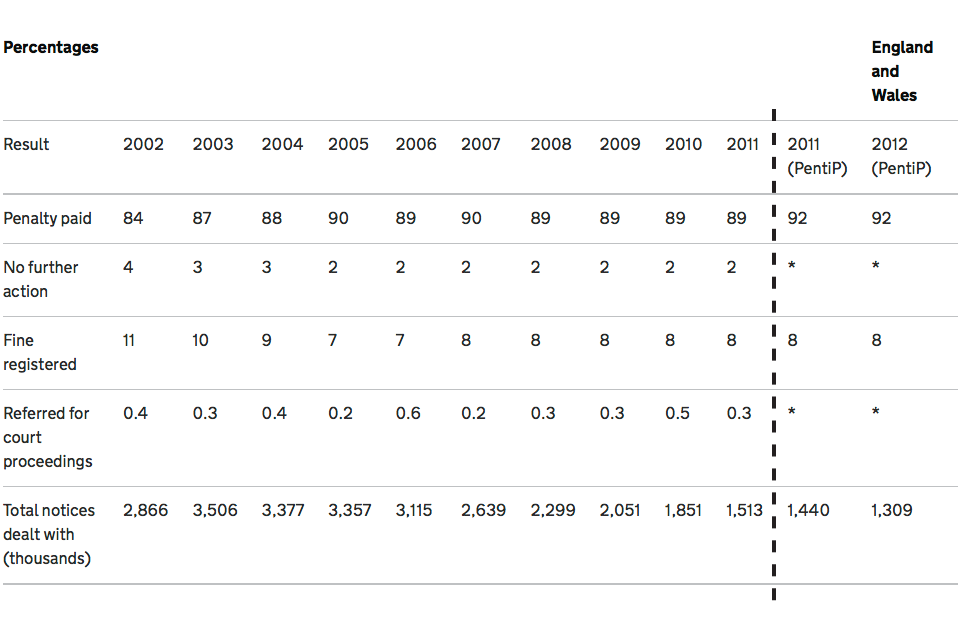
Fixed penalty notices by result, 2002 to 2012.
Source: Home Office, fixed penalty notice table FPN.05
There were 651,401 FPNs issued for camera-detected traffic light and speeding offences in 2012, a 0.3% decrease compared to 2011 (653,400 offences). The majority of these FPNs (94%) were for speeding offences. Cameras provided evidence for 84% of all speeding offence FPNs issued in 2012, up slightly from 81% in 2011.
6.5 Data quality and interpreting the figures
PentiP figures are generally slightly lower than equivalent figures from VP/FPO, and this should be borne in mind when comparing data from the two systems, particularly in relation to FPN payment rates. Further information on the differences between VP/FPO and PentiP can be found in the user guide.
Data relating to the failure to hold an operator’s licence and work record or employment offences (relating to the failure of employers or employees to observe limits on driving time) are presented only for 2011 and 2012. There were 7,500 FPNs issued in relation to these offence groups in 2012; since these represent less than 1% of the total FPNs issued in England and Wales, these categories have been included in long-term trend analysis.
Instead of offering an FPN to those who exceed the speed limit but do not require prosecution, forces can use their discretion to offer a speed awareness course. Those who accept the offer and complete the course, at their own expense, are not subject to any other sanction. The majority of forces in England and Wales now offer such courses. These initiatives should be borne in mind when interpreting changes over time, especially in recent years. In addition, similar initiatives are gradually being introduced for persons found to be committing other offences, for example seatbelt awareness courses. Again, these should be borne in mind when interpreting changes in FPNs over time.
The user guide provides further details relating to definitions, legislation and procedure, and data quality.
6.6 Potential uses of the data
Data on FPNs issued for motoring offences, when analysed alongside data on road traffic collisions and fatalities (collected by the Department for Transport) and data on prosecutions for motoring offences (collected by the Ministry of Justice (MoJ), provide a detailed picture of road safety and levels of road crime enforcement in England and Wales each year. This information allows colleagues in all three departments to inform policy and operational decisions by government ministers. Additionally, these data are used to answer parliamentary questions tabled by members of parliament and members of the House of Lords.
6.7 Other data sources
In addition to FPNs for motoring offences, police officers can also issue FPNs for minor disorder offences under the Penalty Notice for Disorder (PND) scheme, which includes possession of cannabis, alcohol consumption and licensing offences. Data on PNDs are collected and published by the MoJ in its Criminal Statistics: England and Wales quarterly series, which also contains figures on court proceedings for motoring offences.
7. Breath Tests
7.1 Introduction
This section covers the use of police powers, under the Road Traffic Act 1988, to conduct breath tests at the roadside (or similar location) to determine whether motorists are driving with alcohol in their body, beyond the prescribed limit. It looks at the number of tests conducted and motorists who either fail or refuse breath tests, and examines the regional and seasonal use of the powers.
The presented data are drawn from returns from the 43 local police forces in England and Wales, and are on a calendar-year basis (January to December). The Home Office does not receive breath tests data from the British Transport Police. They relate only to preliminary roadside breath tests (hereafter referred to as ‘breath tests’) which are conducted to give an indication whether motorists are driving over the limit, and not the subsequent evidential tests.
Further details relating to definitions, legislation and procedure are given in the user guide.
7.2 Key facts
Police carried out 682,558 breath tests in 2012 compared to 685,992 in 2011. This 1% decrease followed a 7% decrease in the previous year and is down from a peak of 815,290 breath tests in 2009.
The number of positive or refused tests in 2012 decreased by 6%, from 80,761 in 2011 to 75,868 in 2012.
Eleven per cent of breath tests were positive or refused in 2012. Although one percentage point lower than the previous year, the proportion has remained steady since 2009. The higher proportions of positive or refused tests prior to this (between 16% and 18%) may have been due to the under-reporting of negative tests (which indicate that a motorist is not driving over the limit). New electronic reporting systems were introduced in 2008 (see section on [data quality and interpreting the figures]), since when police forces have reported conducting higher numbers of breath tests. Together with a drop in the number of positive or refused tests, this has led to a decrease in the proportion of positive or refused tests.
Trends in breath tests, 2002 to 2012
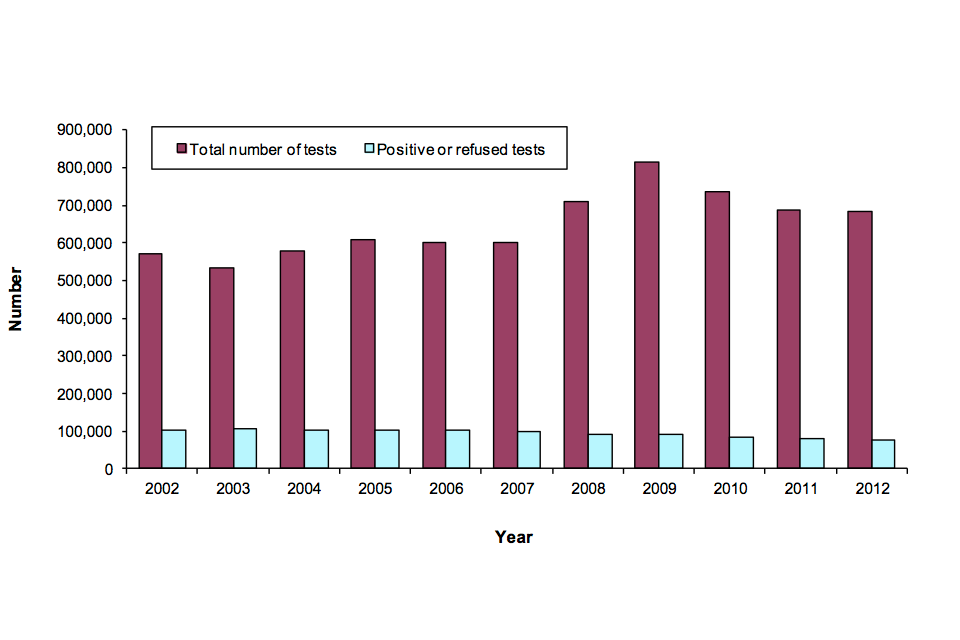
Trends in breath tests, 2002 to 2012.
Chart notes
Source: Home Office, breath tests table BT.01.
7.3 Data tables
Data sourced from statistical returns received from the 43 police forces in England and Wales, can be found in the breath test tables.
7.4 Seasonal variations
The chart below shows the number of breath tests conducted each month in 2012. The highest number were in December when 168,887 breath tests were carried out; these accounted for 25% of all breath tests in 2012 and coincided with the Association of Chief Police Officer’s (ACPO) Christmas 2012 drink and drug driving campaign. The second highest number of breath tests were carried out in June (91,477 tests), which accounted for a further 13% of all breath tests in 2012. This is likely to be due to ACPO’s summer 2012 campaign against drink and drug driving.
Excluding the June and December peaks, the number of breath tests in each month ranged between 37,152 and 49,219 with an average of approximately 42,000 tests.
While there were much higher numbers of breath tests in June and December, there were only small increases in the numbers that were positive or refused. This led to lower proportions of positive or refused tests in June (8%) and December (4%) than the average of the other 10 months (15%).
Number of breath tests each month in 2012
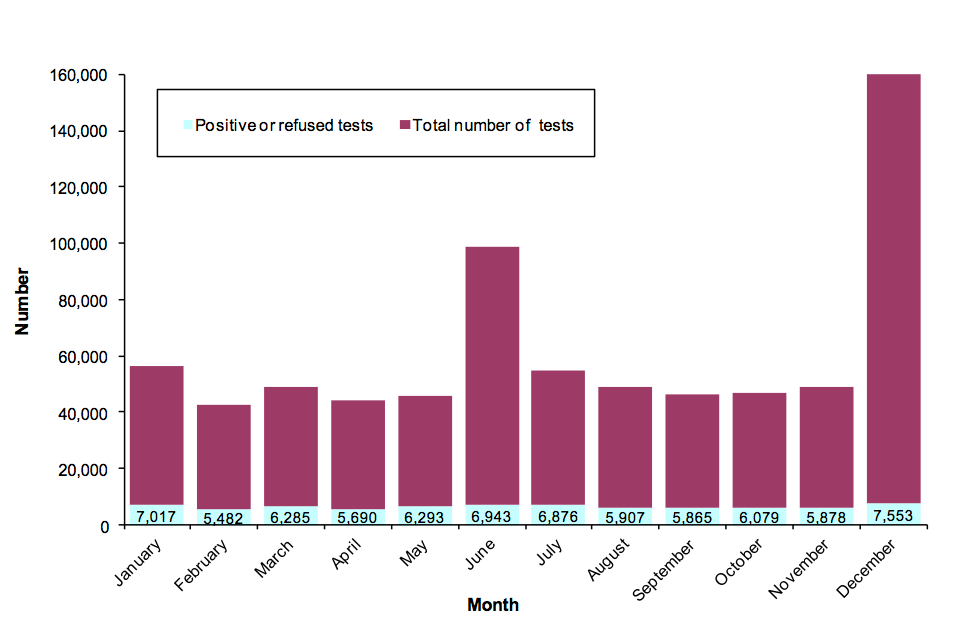
Number of breath tests each month in 2012 .
Chart notes
Source: Home Office, breath tests table BT.01.
7.5 Geographical patterns
In 2012, 12 breath tests were conducted per 1,000 population across England and Wales. The rate for Wales (31 per 1,000 population) was almost three times that for England (11 per 1,000 population). There was a large variation in the number of tests carried out per 1,000 of the population by individual police forces, from 4 per 1,000 population in Avon and Somerset to 43 in Dyfed-Powys and 72 per 1,000 population in North Wales.
The number of breath tests per 1,000 of the population that were positive or refused averaged 1.3 in England and Wales as a whole, though there was not as much variation as for the total number of breath tests at police force level. The rate of positive or refused tests ranged from 0.7 per 1,000 population in Surrey to 5.5 per 1,000 population in North Wales.
7.6 Data quality and interpreting the figures
The figures presented are correct at the time of publication. There were no revisions submitted by forces for the years covered by, and received since the publication of, Police powers and procedures 2011/12.
A breath alcohol screening test can be required when a driver is involved in a collision, is suspected of driving with alcohol in the body or following the commission of a moving traffic offence. Results of breath alcohol screening tests can only be regarded as indicative of the level of alcohol present in a sample of breath and are not used to determine whether a driver was above or below the legal limit to drive. It remains the case that it is only at a police station or hospital that a specimen(s) can be obtained to determine a person’s actual alcohol concentration, using pre-calibrated evidential devices ensuring the sample has not been affected by any interfering substances, or that blood or urine specimens may be taken for subsequent laboratory analysis. These subsequent evidential tests are not included in the breath test statistics.
From April 2008, new digital recording equipment started to be used by forces. The devices are able to record exact breath alcohol readings and the result of individual tests, as well as reason for test, time of day, day of week and age and gender profiles of those tested, and results are downloaded to data systems on a monthly basis and provided to the Department for Transport (DfT).
Data presented here have been sourced from annual statistical returns received from the 43 police forces in England and Wales. By 2011, a large number of police forces in England and Wales had been making greater use of the digital breath test devices. However, manual recording systems are still being used by some police forces. The figures presented here are based on the combined results of both systems. Negative breath tests may previously have been under-reported to the Home Office and it has been previously anticipated that, as more forces used data from the digital devices, it would lead to further improvements in data recording practices by forces. This appears to have been borne out by the decrease in the proportion of positive or refused tests of total breath tests, since 2008.
The user guide provides further details relating to data quality and interpreting the figures.
7.7 Other data sources
Analysis of reported roadside breath alcohol screening tests, based on data from digital breath testing devices, is published by the DfT. Latest figures were included in the DfT’s Reported Road Casualties in Great Britain: 2012 Annual Report.
ACPO runs national drink and drug driving campaigns during the summer and Christmas periods. The results, including the number of persons required to take a test, positive/refused tests and resultant arrests, are published on its website. The latest release relates to its Christmas 2013 campaign. It should be noted that, as ACPO’s data cover the UK, they are not directly comparable with the data in the ‘Police powers and procedures’ series.
8. Feedback
The Home Office is seeking feedback on this publication so that we can assess how well it meets our users’ needs and make improvements where possible. If you have not already done so, please could you complete a short five-minute survey.