Planning and Preparing for Later Life: Technical Report
Updated 8 November 2022

© Crown copyright 2022
This publication is licensed under the terms of the Open Government Licence v3.0 except where otherwise stated. To view this licence, visit nationalarchives.gov.uk/doc/open-government-licence/version/3 or write to the Information Policy Team, The National Archives, Kew, London TW9 4DU, or email: psi@nationalarchives.gov.uk.
Where we have identified any third party copyright information you will need to obtain permission from the copyright holders concerned.
This publication is available at https://www.gov.uk/government/publications/planning-and-preparing-for-later-life/planning-and-preparing-for-later-life-technical-report
Publication June 2022
DWP research report no. 1008.
A report of research carried out by National Centre for Social Research (NatCen) on behalf of the Department for Work and Pensions.
Crown copyright 2022.
You may re-use this information (not including logos) free of charge in any format or medium, under the terms of the Open Government Licence
Or write to:
Information Policy Team
The National Archives
Kew
London
TW9 4DU
Email: psi@nationalarchives.gov.uk
This document/publication is also available on our GOV.UK website
If you would like to know more about DWP research, email: socialresearch@dwp.gov.uk
First published June 2022.
ISBN 978-1-78659-414-3
Views expressed in this report are not necessarily those of the Department for Work and Pensions or any other government department.
Acknowledgements
This research was commissioned by Department for Work and Pensions (DWP) and was carried out by the National Centre for Social Research (NatCen) in collaboration with the Institute for Employment Studies (IES) and Pensions Policy Institute (PPI). The authors would like to thank Hannah McLennan, Sarah Kate O’Grady and Rhian Eveleigh at DWP for their suggestions and encouragement throughout the project.
The successful delivery of the project at NatCen relied on input from a wide range of people, in particular project manager Emma Fenn, survey programmer Nafiis Boodhumeah, data managers Migle Aleksejunaite and Jessica Messling, statistician Rebecca Steinbach, Telephone Unit manager Sonia Shirvington and all the interviewers working on the project. Researchers Alun Humphrey and Shane Howe also worked on the project and Emma Berteen, Jo D’ardenne, Natasha Phillips and Ruxandra Comanaru contributed to questionnaire development and cognitive testing.
Rosie Gloster from the Institute for Employment Studies and Daniela Silcock and Lauren Wilkinson from the Pensions Policy Institute provide invaluable advice at various stages of the project, especially around questionnaire design and reporting. Elizabeth Clery worked closely with NatCen on the design of the questionnaire.
Last but not least, we want to thank our respondents who gave up their time to take part in the survey.
Author Details
Sarah Butt is a Research Director at NatCen and was the lead researcher on this study.
Benjamin Swannell is a Senior Researcher at NatCen.
Eleanor Woolfe is a Research Assistant at NatCen.
James Yarde is a Senior Statistician at NatCen.
1. Introduction
1.1. Background to PPLL
Planning and Preparing for Later Life (PPLL) is a new study commissioned by the Department for Work and Pensions in 2019. It is a nationally representative survey of individuals in Great Britain aged 40-75 and covers all aspects of planning and preparing for retirement including, but not limited to, pension provision.
The question of whether and how people are planning for retirement is one that is becoming increasingly important. First, increasing numbers of people are reaching and living longer beyond retirement age. Second, policy changes around retirement and pensions such as the abolition of the statutory retirement age in 2011 and the introduction of new Pension Freedoms in 2015 give people greater freedom over when and how they retire and take their pension. This in turn puts more onus on individuals to make decisions about their retirement. PPLL contributes to the evidence base around what decisions people make and how they do so.
PPLL builds on a previous series of surveys known as “Attitudes to Pensions” (Clery et al., 2010; McLeod et al, 2012) but is more wide-ranging. It covers behaviour as well as attitudes and, crucially, looks at the experience of work in later life and the transition into retirement as well as financial planning and pensions. Saving for retirement and employment decisions are inextricably linked and it is important to be able to consider the two together. The study was commissioned following a feasibility study which identified evidence gaps around these topics and recommended a bespoke survey to fill those gaps.[footnote 1]
The study was conducted by NatCen Social Research. Expert input on the questionnaire and final report was provided by two organisations: The Pensions Policy Institute (PPI) and the Institute for Employment Studies (IES).
1.2. Aims of PPLL
PPLL had the following aims:
- To understand the impact of the new pensions flexibilities on attitudes and behaviours around pension saving and planning for later life
- To provide evidence to support policy development around income adequacy in retirement
- To gather evidence to inform the Fuller Working Lives agenda, specifically its focus on measures that allow and encourage people to stay in work for longer
- To develop the evidence base around the self-employed and planning for later life
A report on the study’s findings is available. [LINK needed]
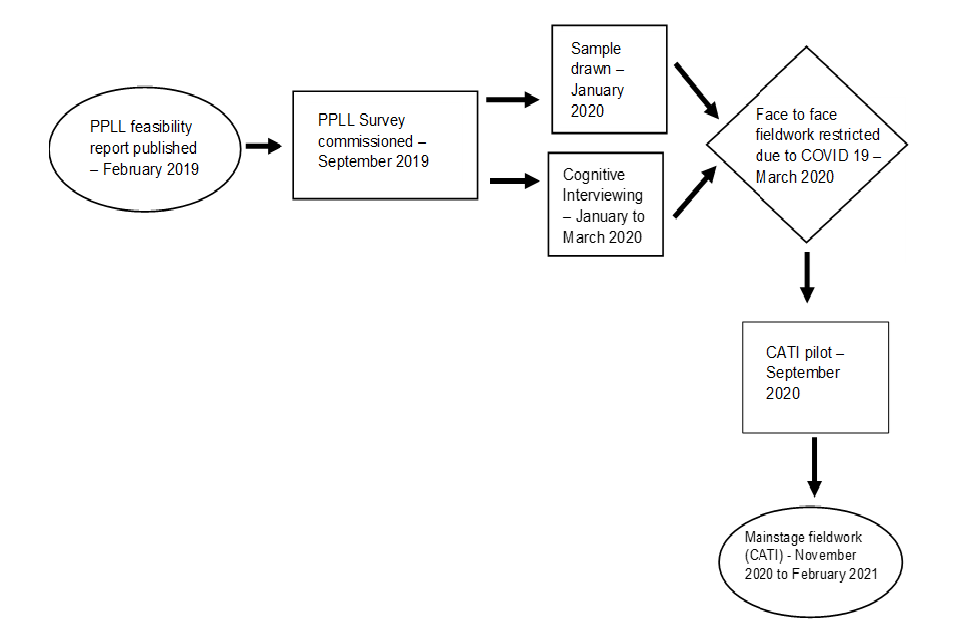
1.3. The impact of COVID-19: Switching from a face to face to a telephone survey
In line with the recommendations of the original Feasibility Report, PPLL was commissioned as a face to face survey. Face to face interviewing was considered the best way to maximise both response and data quality to a survey which would involve a fairly long interview (45 minutes) on topics that would not necessarily be particularly salient to the general public. Fieldwork was originally scheduled for June – October 2020.
However, restrictions on face to face fieldwork in 2020 as a result of the COVID-19 pandemic meant that, in order to deliver survey data in a timely manner, an alternative to face to face interviewing had to be found. Several alternatives were considered including an online survey, telephone interviewing and video interviewing. Computer-Assisted Telephone Interviewing (CATI) was decided on as being the most accessible mode for the target age group and the mode (other than face to face) likely to generate the highest response rate.
Some aspects of the survey design – especially with regards to sampling and questionnaire testing – reflect the fact that the initial stages of the survey lifecycle were completed before the switch to CATI. The approach taken may have been different had the survey been designed for CATI from the outset. Where this is the case, it will be noted in the relevant sections below.
The main changes required to the survey as a result of the move to telephone interviewing were:
- An increase in the size of the starting sample to compensate for the lower expected response rate from telephone interviewing compared with face to face.
- Cuts to the questionnaire to account for the fact that it takes longer to administer a questionnaire over the telephone than it does face to face. This is because the interviewer has to read out more information when interviewing over the telephone, for example, reading out response options rather than the respondent being able to see them on a showcard.
- Changes to the format of questions to make them easier to administer over the telephone. Some of the main changes included reducing the number of response options offered at particular questions and splitting some questions into two parts. For example, to collect information on household income by first asking if income was above or below a particular threshold and then going on to collect more details about the specific amount.
PPLL may become the first in a series of surveys, repeated at regular intervals, to track how people’s knowledge, attitudes and behaviour around planning for retirement changes over time. If the survey is repeated in future years, careful thought will need to be given to whether the survey should continue to be conducted via telephone or “return” to face to face. As this is the first time the survey has been run it is not possible to identify any measurement effects in the data resulting from the move to telephone mode. It should also be borne in mind that, regardless of mode, the fact that the 2020/21 survey was conducted during a global pandemic may mean that the data collected may look somewhat different to what it would have done in the absence of the pandemic.
1.4. Timeline of PPLL
2. Sampling
2.1. Sample design
Planning and Preparing for Later Life (PPLL) was run as a follow-up survey to the Family Resources Survey (FRS) 2017/18. As part of the FRS interview, respondents were asked whether they were “willing to be contacted again” for follow-up studies.[footnote 2] Only those who consented to be recontacted – having responded to the FRS survey – could be approached to take part in PPLL. As PPLL was run as a follow-up survey, the sampling design used for FRS[footnote 3] was a key consideration for the sampling decisions taken on PPLL.
The population of interest for PPLL are those living in Great Britain, aged between 40 and 75. Eligibility for PPLL was determined using data on each FRS respondent’s date of birth and country of residence. Individuals were deemed eligible for PPLL if they were aged between 40-75 (inclusive) on 1 January 2020. Furthermore, only respondents with an address located in Great Britain – at the time they were sampled for FRS17-18 – could be selected. Analysis of FRS respondent data found that 11,691 people met all three of the defined criteria.
In each household in the FRS sample, all adults aged 16+ (except those aged 16-19 who were also classed as dependent children) are approached for the interview. As such, some households were anticipated to contain multiple individuals who met the eligibility criteria for PPLL. As survey outcomes tend to be correlated within households, a maximum of one person per household was sampled for PPLL to minimise the effect of clustering on the achieved sample. After boosting the probabilities of selection for self-employed people (see below) selection of one eligible individual per household was undertaken using simple random sampling).
Of the 11,691 people who responded to FRS 17/18 and met the eligibility criteria for PPLL, 9,312 were selected for the PPLL sample.[footnote 4] Originally PPLL was designed as a face to face survey with a smaller starting sample (N=4,744) predicated on an expected response rate of 55%. However, as a result of the COVID-19 pandemic, interviews had to be conducted by telephone. The sample had to be increased (to 9,312) to account for a lower expected response rate (target 30%) from telephone surveys.
Within Great Britain’s population of 40-75 year olds, the self-employed were identified as being of particular analytic interest. Sampling calculations carried out prior to the PPLL sample being selected suggested that simple random sampling with equal probability of selection was unlikely to result in sufficient numbers of self-employed to carry out survey analysis specific to this group. To maximise the number of self-employed people in the achieved sample for PPLL, employment status at the time of the original FRS interview was used to assign a boosted probability of selection to those who were self-employed. Specifically, someone who was self-employed at the time of their FRS interview had twice the chance of being selected for PPLL compared to another eligible person with a different employment status from the same household.
Of the 9,312 people selected for PPLL, 159 were randomly selected to take part in a survey pilot in order to receive feedback on the survey questions, estimate questionnaire length, and test survey procedures (see Chapter 3, Section 3.2). The remaining 9,153 people, who were not selected for the pilot, were invited to participate in the main PPLL survey. The pilot sample was selected before the PPLL sample was increased to account for the move to telephone interviewing as a result of the COVID-19 pandemic. A consequence of this is that approximately half of the final PPLL sample had no chance of being selected for the pilot. This discrepancy is, however, accounted for in the design of the survey weights.
2.2. Sample management
The sample was drawn by researchers working on the FRS at the Department for Work and Pensions (DWP). The FRS serial number of sampled cases – along with some basic demographic information about the cases selected – were then passed to the FRS team at the Office for National Statistics (ONS) (who conduct FRS fieldwork and retain contact details for sample members). They appended name, address and contact telephone information to the file before making it available to the team at NatCen. Address information was available for all cases. Respondent forename and surname was available for nearly all cases; for the handful of cases (N=56) where a surname was not provided any respondent communications were addressed to “The FRS 2017/18 respondent”. Telephone numbers were missing for 11% of the sample. Further details of how this was handled – by giving these people a chance to opt into the telephone survey – are given in Chapters 4 and 5.
2.2.1. Feed forward data
One advantage of sampling respondents from a previous survey is that it is possible to make use of information collected during the initial interview (in this case FRS 2017/18) and combine this with information collected during the follow-up interview. This makes it possible to avoid re-asking certain information during the follow-up interview and so keep the interview length down.
Information on gender, ethnicity and highest educational qualification – all things which were not expected to change for the age group in question – were carried over from FRS 2017/18 into the final PPLL dataset. Information on age, region and employment status was also available from FRS and used in sampling during fieldwork to monitor response across different groups. However, given the importance of age as a variable in the survey and the fact that region and employment status could have changed, this information was checked or collected again as part of the PPLL interview.
The final PPLL sample file prepared by NatCen replaced the FRS serial number with a newly created PPLL serial number. Permission was not sought from respondents to link their responses at PPLL back to their original FRS 2017/18 responses. Only information on a small number of demographics as mentioned above is available for analysis alongside the PPLL dataset.
3. The questionnaire
The Planning and Preparing for Later Life (PPLL) questionnaire was developed in consultation with the Department for Work and Pensions (DWP) as well as experts at the Institute of Employment and Pensions Policy Institute. Questions underwent two different types of testing to ensure they were fit for purpose.
3.1. Cognitive testing
Selected questions underwent two rounds of cognitive testing. Cognitive testing is a qualitative technique involving a small purposively-selected sample of respondents and in-depth probing and/or “think aloud” techniques to establish: what respondents understood by particular questions, how they arrived at their responses, how confident they were in their answers and any problems caused by the questions. The two rounds of testing allowed any changes implemented following the first round of comments to be re-tested.
Questions on the following topics were cognitively tested:
- Financial dependency
- Self-perceived retirement status, especially people’s understanding of semi-retirement
- Expected/ideal retirement age
- Factors considered when planning for retirement
- Attitudes to self-employment
- Preferred working arrangements as approach retirement
- Employer-provided guidance on retirement
- Level of income expected/expect to need in retirement
- Pension pot size
- Level of pension contributions
- Source of information received about pensions
Respondents were identified from among members of the general public by a specialist recruiter. Quotas were set for each sample to ensure a good spread of ages 40-75, a mix of men and women and respondents of different socio-economic backgrounds and retirement statuses. Further details of the characteristics of the sampled respondents are given in Table 3.1.
Table 3.1 Cognitive interview sample composition
| Screening characteristics | Level of satisfaction |
|---|---|
| Male | 12 |
| Female | 12 |
| Age: 40-54 | 9 |
| Age: 55+ | 15 |
| A-levels or above | 14 |
| GCSEs or below | 10 |
| Fully retired | 9 |
| Semi-retired | 7 |
| In paid work | 8 |
| Self-employed now or in the past: Yes | 12 |
| Self-employed now or in the past: No | 12 |
| Currently receiving a pension: Yes | 13 |
| Currently receiving a pension: No | 11 |
| Type of pension: Workplace pension | 9 |
| Type of pension: Personal pension organised themselves | 4 |
| Type of pension: State Pension | 6 |
Different people were selected for each round of testing. There was a £35 cash payment as a thank you for taking part. Interviews were carried out by researchers specially trained in cognitive techniques using a probe sheet developed with the PPLL research team. Detailed feedback on the interviews was received via debrief sessions after each round of testing.
The first round of testing took place face to face in February 2020 and involved 11 interviews. The second round of testing took place in March 2020 and involved 13 interviews. This was just at the start of the COVID-19 restrictions so some of the interviews took place over the telephone.
The cognitive testing showed that in general, the questions worked well and that respondents were able to answer the questions posed, even quite detailed questions about their pensions. Some changes were implemented following cognitive testing including adjustments to the response options offered and tightening up the question wording, for example, to make it clear whether “retirement” referred to the period after which the respondent fully retired or included semi-retirement as well. Some questions, including those on retirement planning and income needed in retirement, were simplified to allow for fewer response options.
3.2. Pilot
3.2.1. Pilot aims and method
The PPLL pilot served as a dress rehearsal for the mainstage survey and aimed to test all aspects of the survey including participant reactions to the survey and the advance materials, questionnaire length and questionnaire content. PPLL was transitioned from Computer-Assisted Personal Interviewing (CAPI) to Computer-Assisted Telephone Interviewing (CATI) just before the pilot in response to restrictions on face to face fieldwork imposed by the COVID-19 pandemic. An important part of the pilot was therefore to evaluate how well the survey worked over the telephone and whether it was feasible to administer the full face to face questionnaire in a different mode. Some adaptation of the original face to face questionnaire was done ahead of the pilot (for example replacing long showcards with read-out options). However, the questionnaire content was largely retained as originally envisaged pending feedback from the pilot.
The pilot drew upon survey data from respondents as well as feedback from interviewers. The pilot put forward recommendations based on how the survey could be revised prior to the mainstage fieldwork launch in November 2020.
The sample for the pilot was a subset of the mainstage sample, that is 159 named individuals in Great Britain aged 40 to 75 who had previously completed the Family Resources Survey (FRS) in 2017- 2018 and had agreed to participate in further research.
Telephone fieldwork took place between Monday 21 September and Sunday 4th October 2020. Four interviewers from NatCen’s Telephone Unit worked on the pilot. All four interviewers received a virtual briefing on the project from the research team before the start of fieldwork. Interviewers made multiple contact attempts for all cases for which a telephone number was available. Post-fieldwork the interviewers attended a virtual debrief session with researchers from NatCen and DWP to give their feedback on the pilot.
The pilot aimed to achieve 50 interviews. However, only 20 interviews were achieved, limiting what analysis of the pilot data could be conducted. The low response was driven in part by the longer than anticipated interview length reducing the amount of time for recontacting unproductive cases. The pilot did highlight that some groups would likely be more difficult to contact (see next section).
3.2.2. Pilot findings: Contacting respondents
The main source of non-response to the pilot was not being able to contact respondents. Those aged 40-49 were especially hard to contact perhaps as a result of being out at work or more reliant on mobiles. The main reasons for refusal given were being too busy and lack of interest in the survey topic.
It was felt that the longer fieldwork period for the mainstage survey would help to reduce the number of no-contacts and convert unrealised appointments into productive interviews. There were also recommendations for how to make the survey more appealing. These included:
- Spending time during the briefing on how best to approach younger respondents and persuade them that the survey was relevant to them
- Making interviewers aware that the topics covered by the survey could be distressing for some respondents, for example, those with no financial plans or who otherwise do not look forward to the future, so that they could provide appropriate reassurance
- Changing the name of the survey to avoid referring to “later life”. All respondent-facing communications were amended to refer to the survey as “Preparing for the Future”. Copies of the revised materials are available in Appendix B.
- Reducing the length of the questionnaire and restructuring to make it seem less repetitive (see below)
3.2.3. Pilot findings: Questionnaire length
The main finding from the pilot was that the questionnaire was too long and appeared repetitive to respondents. The median interview length was 1 hour, 19 minutes compared with the target length of 45 minutes. The interview was significantly longer for some respondents depending, for example, on the number of pensions they had.
Interviewers, whilst largely positive about the survey, fed back that the survey was too long and potentially repetitive. They explained that the interview duration was highly demotivating, with respondent enthusiasm declining at around the hour mark. The questionnaire’s structure – especially the long batteries of yes/no questions – added to the perception of excessive length.
It was always expected that the pilot would “run long” as it aimed to test a full range of questions, some of which would likely be cut if they were found not to work well with respondents. However, the switch from CAPI to CATI, with long lists of response options which now needed to be read out and the requirement to split some questions into multiple items, also increased the length and may have made the questionnaire seem repetitive.
Different options for reducing the length of the questionnaire were discussed, including cutting questions and modularising the questionnaire (splitting the sample in half so all respondents would be asked a core set of questions and then the remaining content divided between the two samples). However, it was decided not to modularize the questionnaire because one of the key aims of PPLL was intended to be combining data on different aspects of retirement planning for the same respondents.
NatCen worked with DWP to cut questions prior to the main stage and reduce the expected length of the questionnaire to 45-60 minutes. It was agreed to define a cut-off point for “partial interviews” which could be analysed alongside complete interviews if some respondents did not complete the full questionnaire (see Chapter 5 for the definition of a partial interview).
3.2.4. Pilot findings: Questionnaire content
Aside from cuts to the pilot questionnaire to reduce the length, a number of other changes to the questionnaire were made to try and make it more respondent-friendly and less repetitive. Changes were discussed with experts in questionnaire design from NatCen’s Question Design and Testing Hub. Changes mainly focused on how to improve the adaptation of a questionnaire designed for face to face administration for completion over the telephone and included:
- Replacing yes/no batteries with “interviewer read out” questions
- Changing a small number of questions to open-ended “interviewer-code” items rather than having the interviewer read out response options
- Reducing lists of response options to allow for a focus on more high-level answers
- Cutting some heavily routed questions (which would most likely only attract a few responses)
- Restructuring the pensions module to ensure the key information was collected up-front and to reduce the number of repetitive loops respondents had to go through.
3.3. The mainstage questionnaire
The final PPLL questionnaire is broken up into 6 modules with questions covering the following:
1. Demographics
2. Planning for retirement
3. Work and employment
4. Income in retirement
5. Pension level information
6. Financial literacy and household classification
The overall flow of the interview, along with a brief outline of some of the routing, is outlined in Figure 3.1. The full questionnaire is available in Appendix A.
Figure 3.1 Flow chart summarising the flow of the interview
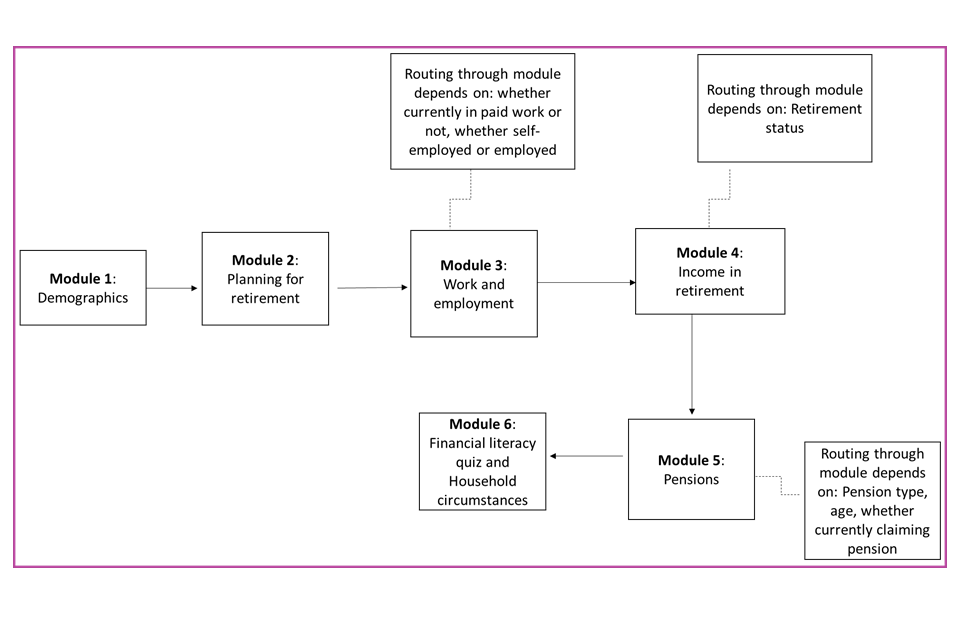
Module 1: Demographics
This module asked/confirmed:
- The age of the respondent
- The marriage status of the respondent
- Their household status (e.g. whether living alone, financial dependents etc.)
- Personal health status
- Carer status
- Their main employment activity
- A derived variable to calculate their retirement status
- A derived variable to calculate their paid work status
- Whether the named respondent returned to work after full retirement
For those individuals living with a partner, many of these questions were repeated to collect information about that partner.
Module 2: Planning for retirement
Topics covered were:
- The information sources used when planning for retirement
- Sources of information that will be used in the future
- Access to the mid-life MOT
- Factors that impact planning for retirement
- Age, when started planning/saving for retirement began
- Planned age for retirement
- Ideal age for retirement
- Self-assessed pension knowledge
- Trust in pension
- Experience and impact of COVID-19 on planning for retirement
The exact wording of the questions varied depending on respondents’ retirement status.
Module 3: Work and employment
This module covered:
- Type of work including industry and occupation
- Experience with self-employment
- Reasons for self-employment
- Whether people had access to flexible working
- Satisfaction with work
- Whether respondent had requested changes to working arrangements in the last 5 years
- Experience of work-related training
- Whether respondents would like to change their level of responsibility in work or amount of work as they approach retirement
- Among those not working, the likelihood of returning to work
- Information provided by an employer to respondent regarding retirement
- What would encourage people to work longer
The module was routed based on respondents’ current employment status.
Module 4: Income in retirement
The topics included in this module were:
- Ideal and expected income in retirement
- Expected proportion of income required to live on in retirement
- Funding sources for retirement
- Confidence that income will be enough to live on in retirement
- Satisfaction with standard of living in retirement
- Whether a respondent has checked the State Pension age and amount (and expected State Pension amount)
The exact wording of the questions varied depending on respondents’ retirement status.
Module 5: Pension provision
This module collected detailed information about any private pensions the respondent held as well as, for those without a private pension, the reasons for this.
The module was constructed as a series of loops with respondents first asked about the number of pensions they had and then asked for details of each of those pensions in turn. Information collected about each pension included:
- Whether the pension was a workplace or personal pension
- Whether the pension was defined benefit or defined contribution
- Whether the respondent was currently saving into the pension
- The value of the pension pot/income expected from the pension
- Future plans for defined contribution pensions not yet accessed
- Whether a respondent was auto-enrolled in a workplace pension scheme
- Level of contributions to workplace pensions
- How easy the respondent found it to keep track of their pensions
- For any pensions accessed since 2015:
- Whether lump sum taken
- Value and uses of any lump sum taken
- Whether pension moved into income drawdown or respondent purchased an annuity
Module 6: Financial literacy and household classification
The final block of questions included six questions to assess respondents’ financial literacy. The remaining questions collected information on household financial circumstances including income, savings and tenure.
4. Mainstage fieldwork procedures
4.1. Fieldwork period
Fieldwork took place between 14th November 2020 and 7th February 2021. Interviews were therefore conducted at the height of the second wave of the COVID-19 pandemic. It is possible that the pandemic may have had an indirect impact on people’s current circumstances and expectations for the future and that some findings may have been different had the survey been conducted 12 months earlier.
Copies of all the fieldwork documents referred to below are available in Appendix B.
4.2 Interviewer briefings All interviewers working on the project were trained members of NatCen’s Telephone Unit or field force. Interviewers received a three hour project briefing conducted by the research team. Briefings were attended by a representative from the Department for Work and Pensions who provided an overview of the aims of the study, why it was important and how the data would be used.
The briefings covered:
- The aims of the study
- An overview of the survey methodology
- A pensions quiz to familiarise interviewers with the content of the study
- Contact procedures including tips for persuading reluctant respondents
- Content of the questionnaire
- End of survey procedures including administration of thank you vouchers
There was also a practice interview guided by the researcher running the briefing to familiarise interviewers with the questionnaire content.
Interviewers completed additional practice interviews before they started calling respondents and had access to a set of project instructions giving details of the project methodology, contact procedures and questionnaire content. Interviewers were also provided with a copy of all respondent communications.
4.3. Making contact
4.3.1. Advance mailing
Before the start of fieldwork, each sample member received through the post:
- An advance letter
This letter covered the purpose of the study, explained why the person was chosen to take part and explained what would happen next i.e. an interviewer would call. The letter also had answers to some potential queries that respondents may have and contained a freephone number and email address that respondents could contact to obtain more information about the study, to opt-out (office refusals) or to tell us about a change in contact details.
In recognition of the fact that the contact phone number available was collected several years ago, at the end of the Family Resources Survey (FRS) interview conducted in 2017/18, and may have changed, the advance letter invited people to contact the freephone team to provide details of the best number on which to contact them. A small number of people did this, but most did not and there was a high level of non-contacts during fieldwork (see Chapter 5).
- A survey purpose leaflet giving some more information about the background of the study. It covered
- What is the Preparing for the Future study?
- Why does the study matter?
- How will we use your information?
- Why did we choose you?
- Who are we?
- Findings from the 2017/18 FRS
- Our responsibility to you
4.3.2. Opt-ins
The sample file obtained from The Department for Work and Pensions (DWP) contained contact telephone numbers for 89% of sample members. The remaining 11% (the “opt-in sample”) were sent an alternative version of the advance letter inviting them to “opt-in” to the survey by getting in touch with the Freephone team and providing a contact telephone number for an interviewer to call.
The first opt-in mailing was sent 10 days before the start of fieldwork to allow time for people to opt-in before interviewers started making contact attempts. A reminder letter was sent on 30th November 2020 to everyone in the opt-in sample who had not yet been in touch.
4.3.3. Interviewer calling protocols
All sample members received multiple telephone contact attempts at different times of day and different days of the week/weekend to try and maximise the chances of contact. Upon making contact, interviewers were able to make appointments to conduct the interview at a time that was convenient for the respondent and/or to complete the interview over multiple sessions if necessary.
If respondents did not recall receiving the advance mailing, they could view this online at the study’s taking part page or request to have a copy mailed to them.
4.3.4. Asking about pension statements
The Planning and Preparing for Later Life (PPLL) survey asked for detailed information about any pensions the respondent had, what type of pensions they are, the value of the pension and, if the respondent has already accessed their pension, how they are taking their pension. To try and maximise the accuracy of this information, respondents were advised prior to the start of the interview that they may want to have their pension statement(s) available. The interview script gave respondents the option of making an appointment to conduct the interview at a later date when they had their statement(s) available or were going to find them and then whilst the interviewer was waiting on the line. However, because it was recognized that not everyone who had a pension would necessarily be able to access their statements, or may be reluctant to because of data confidentiality concerns, it was not compulsory to have statements available before completing the interview. Only one in four pension holders had statements available during the interview. It is possible that this proportion may have been higher had the interviews been conducted face to face.
4.4. The end of the interview
4.4.1. Incentives
A £10 Love2Shop voucher was sent to all respondents on completion of the interview as a thank you. The voucher could be spent at a range of high street shops. Respondents who were willing/able to give an email address were sent an e-voucher which could be redeemed online whilst the remaining respondents received a gift card.
4.4.2. Information sources leaflet
Given the nature of the topics covered in the interview, it was considered possible that respondents may want to find out more information about pensions and retirement planning at the end of the interview. An information sources leaflet containing details of some organisations (and relevant web links) was made available for people to consult. A link to an online version of the leaflet was provided in the email containing the thank you e-voucher whilst a hard copy of the leaflet was sent to respondents receiving a gift card through the post. Interviewers were advised that if a respondent expressed concern or appeared worried about any of the topics covered in the interview, they should mention this leaflet to them. They could also direct them to an online version of the leaflet immediately after the interview.
4.5. Interview length
Interview length was calculated based on time stamps recorded in the Computer-Assisted Telephone Interviewing (CATI) programme and verified by interviewers. Where interviewers’ report of the interview length differed from the time stamp data, the interviewers’ self-report was used. This can happen especially if an interview is split over multiple sessions; the interview length calculated based on the start and end time stamps can lead to an overreporting of the length of time the interview was actually active. Interview length was calculated for fully productive interviews only.
The median length of the interview was 48 minutes. The interview was longest for those individuals currently semi-retired, with a median length of 54 minutes, which perhaps reflects the fact there are unique semi-retired questions, and the shortest interview length was for the fully retired (median length of 45 minutes).
5. Response rates
Table 5.1. gives an overview of the Planning and Preparing for Later Life (PPLL) response rate. Overall, 2,655 interviews were obtained, with a response rate of 29%. Nearly all of these interviewers were fully productive (28.6%) but a small number (34 or 0.4%) were partial completes. To count as a partial interview the respondent had to have reached question PenConsol, part-way through Module 5 in the questionnaire.
The main reason for interviews not being achieved was interviewers not being able to make contact with respondents, either because there was no phone number available (see below) or because the sample member was unreachable. If non-contacts are excluded, the co-operation rate for the survey – that is productive interviews as a proportion of all sample members with whom interviewers made contact – was 53.7%.[footnote 5]
Table 5.1 Response outcomes
Productive
| Response: Productive | Number | Percentage |
|---|---|---|
| Fully completed interview | 2,621 | 28.6 |
| Partial completed interview | 34 | 0.4 |
Unproductive
| Response: Unproductive | Number | Percentage |
|---|---|---|
| Refusal[footnote 6] | 1,560 | 17.0 |
| Broken appointment. Attempted recontact unsuccessful | 489 | 5.3 |
| No phone number | 993 | 10.8 |
| Not possible to identify named respondent at address | 250 | 2.7 |
| No contact with anyone at address | 2,260 | 24.7 |
| Respondent unavailable due to illness | 244 | 2.7 |
| Other unproductive[footnote 7] | 702 | 7.7 |
| Total | 9,153 | 100 |
As noted in chapter 4, 11% of sample cases did not have a phone number provided in the sample frame. These individuals were invited to opt-in to the survey before the start of fieldwork. However, it was anticipated that the response rate for these opt-in cases would be lower than for cases which could be contacted directly by an interviewer. Table 5.2 shows that this was the case; only 4% of the opt-in sample took part in the survey compared with 32% of those for whom telephone numbers were available in the frame.
Table 5.2 Response rate for main and opt-in samples – Percentage
| Response type – % | Main sample (telephone number available in sample frame) – % | Opt-in sample – % | Total – % |
|---|---|---|---|
| Productive | 32 | 4 | 29 |
| Unproductive | 68 | 96 | 71 |
| Number of cases | 8,101 | 1,052 | 9,153 |
As shown in Table 5.3 the profile of the main and opt-in samples was very similar, at least on basic demographics, so the low response rate among the opt-in sample is not anticipated to be a significant source of bias.
Table 5.3 Profile of main and opt-in samples
| Characteristic | Main sample (telephone number available in sample frame) – % | Opt-in sample – % | Total – % |
|---|---|---|---|
| Age: Below 50 | 25 | 23 | 24 |
| Age: 50-64 | 43 | 45 | 43 |
| Age: 65+ | 33 | 33 | 33 |
| Male | 44 | 45 | 44 |
| Female | 56 | 55 | 56 |
| North East | 5 | 5 | 5 |
| North West | 10 | 11 | 10 |
| Yorkshire and Humber | 9 | 8 | 9 |
| East Midlands | 8 | 7 | 8 |
| West Midlands | 9 | 8 | 9 |
| East of England | 10 | 5 | 10 |
| London | 8 | 7 | 8 |
| South East | 12 | 12 | 12 |
| South West | 9 | 9 | 9 |
| Wales | 5 | 6 | 5 |
| Scotland | 15 | 21 | 16 |
| Number of cases issued | 8,101 | 1,052 | 9,153 |
The response rate was comparable across regions and by gender. Younger age groups were less likely to respond to the survey; the response rate was 21% among 40-49 year olds, 29% among 50-64 year olds and 35% among those 65+. The differences in response by age have been corrected for in the weighting (see Chapter 7).
6. Data processing
6.1. Coding
Post-interview coding was carried out by NatCen’s Data Unit. Two types of coding were undertaken.
6.1.1. “Other specify” responses
Coders reviewed the verbatim answers provided to any questions with an “Other – please specify” response option. Where possible answers were back-coded into one of the responses in the original code frame.
The verbatim answers were reviewed to see if it was necessary to add additional codes for any questions (if the same “other” answers recurred multiple times). Additional codes were not added for any questions.
6.1.2. Occupation and socio-economic class
Information on respondents’ job details was used to code occupation using the Standard Occupation Classification (SOC) 2000, industry using the Standard Industry Classification (SIC) 2007 and the National Statistics Socio-Economic Classification (NS-SEC) 2010.
For respondent’s currently in paid work details of their current main job were coded. For respondents who had retired or were not currently in paid work, details of their previous job were coded. For semi-retired respondents, if their job immediately prior to semi-retirement was different from their current job, occupation coding was carried out for both their current and pre-retirement jobs.
6.2. Data management
6.2.1. Data checks and cleaning
Post-fieldwork a series of checks on the data was conducted by NatCen’s Data Management team. The outcome code assigned to each respondent was confirmed and any unproductive cases (including respondents who had started the interview but not reached the cut-off point for a partial interview) were removed from the dataset. The dataset was also checked to ensure that the correct respondents had been routed to each question. There were a few instances where respondents had been routed to questions they should not have been. If this was the case their answers were replaced with a -1 missing code (see below). There were also a few instances where respondents had not been routed to questions they should have answered. If this was the case, they were assigned a -11 missing code.
The raw dataset contained place holders for information on up to 20 different pensions to be collected in Module 5. However, the number of pensions answered about varied between a minimum of three and a maximum of nine across the different pension loops. Any empty pension loops have been removed from the final dataset.
No cleaning of numeric values such as pension amounts, for example, to remove outliers, was conducted. It has been left to the discretion of individual analysts whether and how they would like to make use of these data.
6.2.3. Missing values
Where respondents answered “don’t know” or refused to answer a question, their answers have been assigned -8 and -9 codes respectively. Respondents that were correctly filtered away from a question were given the code -1 “Not applicable” and respondents who were incorrectly filtered away from a question were given the code -11 “Missing answer”.
The PPLL dataset has missing values switched on so that any respondents with missing values on a given question are not included in the analysis of that question.
6.2.3. Person and pension level datasets
The raw data collected by the Planning and Preparing for Later Life (PPLL) questionnaire was used to create two different datasets:
1. Person level data
2. Pension level data
PPLL was designed as an individual level survey and to be representative of the population of 40-75 year olds. The person-level dataset, which contains one record for each respondent who gave a productive interview, should therefore be used by default including for most analysis of pension provision. This dataset allows for analyses including what proportion of 40-75 year olds have a Defined Contribution (DC) pension and what proportion of people who have accessed a DC pension chose to take a lump sum.
The pension level dataset contains one record for each pension about which respondents gave details in Module 5 and has been constructed from the pension loops asked in the questionnaire. This dataset can be used to understand how decisions or circumstances may vary between pensions, for example, to know which pensions or what proportion of pensions were taken as a full cash lump sum. Separate pension-level weights have not been constructed. The dataset should be analysed using the individual-level weights (see Chapter 7).
6.2.4. Derived variables
As well as the questionnaire responses recorded during the interview (see Appendix A for a copy of the questionnaire) the main PPLL dataset contains a number of derived variables computed from the data post-fieldwork. Examples of derived variables include continuous, numeric variables that have been recoded into categorical variables for ease of analysis. A lot of the derived variables relate to Module 5 on pension provision and summarise the information provided across the different pension loops.
Derived variables have “DV” at the start of the variable name. A full list of the derived variables included in the person level dataset is given in Appendix C.
7. Weighting
Weights were constructed to ensure that the Planning and Preparing for Later Life (PPLL) survey data are representative of 40-75 year olds living in Great Britain and that findings from the survey can be generalised to this population of interest.
A key methodological feature of the Family Resources Survey (FRS) is that it is designed to be representative of UK private households. As the sample for PPLL was selected as a random probability sample from a defined sub-group of FRS respondents, the responding sample for PPLL is notionally representative of that sub-group, that is 40-75 year olds living in Great Britain. To ensure that the findings from PPLL could be generalised to the population of interest, survey weights were calculated to account for selection and non-response biases from each of the surveys in turn. In essence, the survey weights address any differences in the likelihood that an individual is selected to take part in FRS and in PPLL, as well as any factors that may be associated with differences in the probability of responding to the two surveys. The weights were constructed in several stages as described below.
7.1. FRS and PPLL selection weights
The first stage of the weighting design for PPLL accounts for the chance of being selected to participate in the FRS. This stage of weighting was constrained by the availability of data relating to the issued sample for FRS. Specifically, NatCen only had access to data for those individuals selected for the PPLL sample.[footnote 8] No data was available relating to addresses from which no FRS survey response was received, nor for those households which responded to FRS but did not contain any respondents who would be eligible for PPLL. It was not, therefore, possible to calculate non-response weights for FRS which account for patterns of response across all addresses in the survey sample.
Instead, a proxy FRS weight was created which accounted for bias with respect to the chance of being selected for the FRS sample, as well as some limited aspects of non-response. The FRS sample was explicitly stratified by country, with each address having a known probability of selection. The design of FRS was such that addresses in Scotland were oversampled relative to those in England and Wales – if unaccounted for, this would be likely to result in Scottish households being over-represented. A selection weight (W1) was therefore calculated as the inverse of each address’ probability of selection, i.e. W1 = 1 / P1, where P1 is the probability of an address selection for FRS 17/18.[footnote 9]
Next, the weighting approach accounts for the selection of eligible FRS respondents within households into the sample frame eligible for selection into PPLL. In instances where there were multiple people who were eligible for PPLL from the same household, a single person was randomly selected to be approached for an interview.[footnote 10] As it was not possible to refer to data on those who were not selected (but otherwise eligible for PPLL), a further selection weight was created prior to adjusting for patterns of non-response to FRS. Those with employment status of self-employed were identified as being of particular analytic interest for the survey, so were assigned a boosted probability of selection. Specifically, individuals who were classed as self-employed when they responded to the FRS were given twice the probability of being selected compared to other eligible individuals in the same household who gave an alternative employment status. The probability of each person in the PPLL sample having been selected was calculated based on the number of eligible individuals in the household and their respective employment statuses. The individual selection weight (W2) was then calculated as the inverse of this probability, i.e. W2 = 1 / P2, where P2 is the probability of each member of the PPLL sample being selected from their respective households. After the two component selection weights had been created, a combined selection weight was calculated as the product of the two (i.e. W3 = W1 * W2).
Due to the aforementioned data constraints, it was not possible to account for systematic differences in the probability of survey response (non-response bias) at an earlier stage. It was also not possible to account for any systematic differences in FRS respondents’ consent to be re-contacted for future surveys. Instead, a simple calibration adjustment was made to create weights that act as a proxy for individual-level weights for the FRS. These, in turn, ensure that the weighted profile of the sample selected for PPLL matches the profile of the population in terms of region and age/sex. The combined selection weights (W3), in this case, were adjusted so that the weighted sample matches the Office for National Statistics (ONS) mid-year population estimates for the population of interest (40-75 year olds, living in Great Britain).[footnote 11] The resulting weight created from this calibration step (W4) acts as a proxy FRS weight for individuals selected for the PPLL sample.
7.2. PPLL pilot selection weight
From the PPLL sample, a small number of cases (159) were randomly allocated to the pilot survey (with a known probability)[footnote 12] . As responses from the pilot survey are not included in the final PPLL data, the probability of selection for the pilot needs to be accounted for in weighting. Again, to help ensure that there were sufficient numbers of self-employed respondents for sub-group analysis in the final achieved sample, different probabilities of selection were used. In this case, the self-employed were selected for the pilot with a lower probability compared to those with a different employment status, and this is reflected in the weights. As with the selection weights in earlier steps, the pilot selection weight (W5) was calculated as the inverse of the probability (on this occasion, of not being selected for the pilot). This was then combined with the proxy FRS weight (W4) by multiplying the two (i.e. W6 = W4 * W5).
7.3. PPLL non-response weight
In the final weighting stage, the combined weight (W6) was applied to a non-response model which was used to estimate the probability of response to the PPLL survey given the known characteristics of those sampled. To this end, logistic regression was used to model the probability of response using a combination of geographic data (inferred from postcode) and individual-level characteristics recorded at the FRS. The final selection of explanatory variables for the model was determined using a stepwise approach, where the incremental effect of either adding or removing variables on the fit of the model is tested. Using this approach, the following were used in the final model to estimate the probability of response to PPLL: age/sex, region, employment status, ethnicity, housing tenure, household composition, highest educational qualification, council tax band, the National Statistics Socio-Economic Classification (NS-SEC) classification and population density (quintile). [footnote 13] The full model output is provided in Appendix D.
Once the probabilities of response had been estimated, the non-response weights were then calculated as the inverse of the estimated probability of response, given each member of the sample’s characteristics (i.e. W7 = 1 / PResponse). The final PPLL weight was then calculated as the product of this and the preceding weight: WPPLL = W6 * W7. These were then scaled so that the mean weight is equal to 1, i.e. the unweighted sample size is equal to the weighted sample size.[footnote 14]
The final PPLL weights account for a range of survey biases. These include not all people having the same probability of being selected for the survey, as well as systematic differences in the propensities of different groups to respond. When applied, the survey weights minimise the effect of these sources of bias and enable us to generalise the survey findings to the population of interest – not just survey respondents.
7.4. Comparison of PPLL vs FRS weighted samples
Given that PPLL Is a follow-up to the 2017/18 FRS - with an achieved sample that contains only a subset of FRS participants who themselves were a subset of the underlying population – there was a concern that PPLL may not be fully representative of the underlying population even after weighting. Participants had several opportunities to drop out of the sample ahead of PPLL including not taking part in FRS, not giving consent to be re-contacted, not being contactable at the follow up or choosing not to take part in PPLL even if selected. Whilst the PPLL weighting aimed to correct for both the original FRS and subsequent non-response (as well as sample design effects), there are limitations to any weighting scheme. The PPLL weights, for example, were limited by the fact that they could not use the original FRS weights as the starting point for the PPLL weights (see Section 7.1 for more on why this was) and so had to rely on proxy weights for the FRS sample selection. Because of the (lack of) data available it was also not possible to model the decision to consent to recontact at the end of the FRS interview. It is expected, therefore, that there would be some differences in the profile of the PPLL and FRS achieved samples.
Nevertheless, one way to get an idea of the representativeness of the PPLL achieved sample is to compare the PPLL achieved sample against the original FRS sample on certain key characteristics. The variables used for comparison were household/individual characteristics as measured in the FRS survey and supplied as part of the PPLL sample file. The FRS figures have been calculated for 40-74 year olds in Great Britain to match the PPLL sample.[footnote 15] Both sets of figures were weighted, by the FRS weight (Gross4) and PPLL weight (ppll_wt) respectively. Whilst we would expect some differences between the two samples (because of the limitations of the PPLL weights described above), to have confidence in the PPLL data we would want the profile of the two samples to be broadly similar and without systematic differences.
As the Tables in Section 7.4.1 show, it is the case that the PPLL and FRS achieved samples (once weighted) are similar on key variables. There are some small differences between the two, most notably PPLL has a higher proportion of single people[footnote 16], but nothing which would lead us to be unduly concerned about the quality of the PPLL achieved sample or limit the validity of conclusions drawn from the data.
It should be noted that the comparison between the two samples is indicative only. Some limitations include:
- The comparison is not exactly comparing like with like: The FRS sample contains respondents aged 40-74 (given the age categories available in the public FRS data files) whereas the PPLL sample included respondents aged 40-75. Whilst 75 year olds make up only 2% of the achieved PPLL sample, it is possible their exclusion may have skewed the profile comparison slightly.
- The FRS sample is itself a sample rather than a measure of the underlying population and so may be subject to some bias.
- There may be other, unobserved, differences in the two samples. It has been possible to compare the FRS and PPLL samples only on a few key variables which were provided as part of the PPLL sample. Furthermore, these were variables included in the weighting models so it is expected that the weights would do a good job of correcting for any under/over representation. There may be unobserved differences in the two samples (given the different subject matters and methodologies plus the additional effort/elapsed time involved in participating in PPLL) which it was not possible to correct for in weighting and which cannot be evaluated.
- Any differences observed between the two samples have not been tested for statistical significance.
7.4.1. PPLL and FRS sample profile tables
Table 7.1 Sex of the respondents in the PPLL achieved sample compared against the FRS achieved sample (weighted)
| Sex of respondents (weighted) – % | PPLL achieved sample – % | FRS achieved sample – % |
|---|---|---|
| Male | 49 | 49 |
| Female | 51 | 51 |
| Unweighted number of cases | 2,655 | 17,463 |
Table 7.2 Government Office Region in the PPLL achieved samples compared against the FRS achieved sample (weighted)
| Government office region (weighted) – % | PPLL achieved sample – % | FRS achieved sample – % |
|---|---|---|
| South East | 15 | 14 |
| London | 11 | 12 |
| North West | 11 | 11 |
| East of England | 11 | 10 |
| South West | 10 | 9 |
| Yorkshire & Humber | 9 | 9 |
| Scotland | 9 | 9 |
| West Midlands | 8 | 9 |
| East Midlands | 8 | 8 |
| Wales | 5 | 5 |
| North East | 4 | 4 |
| Unweighted number of cases | 2,655 | 17,463 |
Table 7.3 Ethnicity in the PPLL achieved samples compared against the FRS achieved sample (weighted)
| Ethnicity of respondents (weighted) – % | PPLL achieved sample – % | FRS achieved sample – % |
|---|---|---|
| White | 91 | 90 |
| Mixed / Multiple ethnic groups | 1 | 1 |
| Asian - Indian | 2 | 3 |
| Asian - Pakistani | 1 | 1 |
| Asian - Bangladeshi | 1 | 1 |
| Asian - Chinese | 0 | 0 |
| Asian - Other | 1 | 1 |
| Black/ African/ Caribbean/ Black British | 2 | 2 |
| Other ethnic group | 1 | 1 |
| Unweighted number of cases | 2,655 | 17,463 |
Table 7.4 Marital status in the PPLL achieved samples compared against the FRS achieved sample (weighted)
| Marital status of respondents (weighted) – % | PPLL achieved sample – % | FRS achieved sample – % |
|---|---|---|
| Married / Civil Partnership | 57 | 65 |
| Single | 14 | 10 |
| Divorced / Civil Partnership dissolved | 11 | 9 |
| Cohabiting | 10 | 10 |
| Widowed | 4 | 4 |
| Separated | 3 | 2 |
| Unweighted number of cases | 2,655 | 17,463 |
Table 7.5 NSSEC in the PPLL achieved samples compared against the FRS achieved sample (weighted)
| NSSEC (weighted) – % | PPLL achieved sample – % | FRS achieved sample – % |
|---|---|---|
| Lower professional/Higher technical occupations | 28 | 27 |
| Semi-routine occupations | 14 | 15 |
| Intermediate occupations | 13 | 13 |
| Higher professional occupations | 11 | 10 |
| Routine occupations | 10 | 11 |
| Employers in small organisations/Own account workers | 10 | 10 |
| Lower supervisory/lower technical | 7 | 7 |
| Higher managerial occupations/Employers in large organisations | 4 | 4 |
| Never worked/long term unemployed | 2 | 3 |
| Full-time student/Not classified | 1 | 0 |
| Unweighted number of cases | 2,655 | 17,463 |
Table 7.6 Qualification level in the PPLL achieved samples compared against the FRS achieved sample (weighted)
| Qualification level of respondents (weighted) – % | PPLL achieved sample – % | FRS achieved sample |
|---|---|---|
| Degree/equivalent | 32 | 28 |
| Other qualification | 55 | 56 |
| No qualifications | 13 | 16 |
| Unweighted number of cases | 2,655 | 17,463 |
Table 7.7 Council tax bands in the PPLL achieved samples compared against the FRS achieved sample (weighted)
| Council tax band (weighted) – % | PPLL achieved sample – % | FRS achieved sample – % |
|---|---|---|
| Band A | 18 | 18 |
| Band B | 18 | 18 |
| Band C | 22 | 20 |
| Band D | 17 | 18 |
| Band E | 12 | 13 |
| Band F | 7 | 8 |
| Band G | 4 | 5 |
| Band H | 0 | 1 |
| Band I | 0 | 0 |
| Household not valued separately | 0 | 0 |
| Unweighted number of cases | 2,655 | 17,463 |
Table 7.8 Tenure type in the PPLL achieved samples compared against the FRS achieved sample (weighted)
| Tenure (weighted) – % | PPLL achieved sample – % | FRS achieved sample – % |
|---|---|---|
| Owned outright | 37 | 40 |
| Owned with a mortgage (includes part rent / part own) | 34 | 34 |
| LA / New Town / NIHE / Council rented | 10 | 7 |
| Housing Association / Co-Op / Trust rented | 8 | 7 |
| Rent-free | 1 | 1 |
| Other private rented unfurnished | 10 | 9 |
| Other private rented furnished | 1 | 1 |
| Unweighted number of cases | 2,655 | 17,463 |
Table 7.9 Age of respondents in the PPLL achieved samples compared against the FRS achieved sample (weighted)
| Age of respondents (weighted) – % | PPLL achieved sample – % | FRS achieved sample – % |
|---|---|---|
| 40-44 | 12 | 15 |
| 45-49 | 16 | 16 |
| 50-54 | 13 | 16 |
| 55-59 | 14 | 16 |
| 60-64 | 18 | 13 |
| 65-69 | 12 | 13 |
| 70-75* | 13 | 11 |
| Unweighted number of cases | 2,655 | 17,463 |
*Please note FRS only includes cases up to 70-74 respondents
Table 7.10 Household composition in the PPLL achieved samples compared against the FRS achieved sample (weighted)
| Household composition (weighted) – % | PPLL achieved sample – % | FRS achieved sample – % |
|---|---|---|
| Single adult | 22 | 16 |
| 2+ adults | 48 | 57 |
| Single adult with children | 4 | 2 |
| 2+ adults with children | 26 | 25 |
| Unweighted number of cases | 2,655 | 17,463 |
Table 7.11 Number of children per household in the PPLL achieved samples compared against the FRS achieved sample (weighted)
| Number of children per household (weighted) – % | PPLL achieved sample – % | FRS achieved sample – % |
|---|---|---|
| None | 70 | 73 |
| 1 child | 13 | 13 |
| 2 children | 13 | 10 |
| 3+ children | 5 | 3 |
| Unweighted number of cases | 2,655 | 17,463 |
Appendix A mainstage questionnaire
The Appendix A mainstage questionnaire is attached as a separate document.
Appendix B Survey materials
See web page for list of survey materials:
- advance letter
- frequently asked questions
- opt-in letter
- opt-in letter reminder
- survey purpose leaflet parts 1 and 2
- information resources leaflet
- thank you letter
Appendix C Derived variables
Derived variables in PPLL person-level dataset
| Variable name | Variable label |
|---|---|
| DVCarerTim | Time spent caring |
| DVGCCare | Time spent looking after grandchildren |
| DVExpAgeRet | Expected age of retirement (all responses banded) |
| DVIdealAgeRet | Ideal age of retirement (all responses banded) |
| DVIdealAgeMet | Whether ideal age of retirement meets expected age of retirement (all responses banded) |
| DVIncNeedAnn | Income needed in retirement – annual amount |
| DVIncNeedRet | Income needed in retirement (annual amount banded) |
| DVIncNeed | Income needed in retirement as a proportion of current income |
| DVIncExp | Income expected in retirement as a proportion of current income |
| DVNeedExp | Whether income needed matches expectations (as a proportion of current income) |
| DVSMAmntOb | State Pension amount – objective knowledge |
| DVSMAmntOb2 | State Pension amount – objective knowledge Y/N |
| DVSPExpBand | Expected State Pension amount on reaching SPA |
| DVSPPropAll | Proportion of total retirement income expected to come from State Pension (including all) |
| DVPrefWrkHrs | Preferred working hours (banded) |
| xDVPartTime | Part-time work (using hours work) |
| TimeSinceWrk | Time since last in paid work (in years) |
| DVPenNumAccess | Number of pensions accessed or drawn from |
| DVPenNumCurr | Number of pensions not accessed |
| DVPenNumTot | Number of pensions – total |
| DVPenNumBan | Number of pensions (banded) |
| DVPennumDC | Number of DC pensions |
| DVPennumDB | Number of DB pensions |
| DVWorplacePenA | Workplace pension – accessed |
| DVWorplacePenT | Workplace pension – pension not accessed |
| DVWpPenTotC | Workplace pension – any |
| DVPpPenAcc | Personal pension – accessed |
| DVPpPenC | Personal pension – pension not accessed |
| DVPpPenTot | Personal pension – any |
| DVDCAcc | Defined contribution pension – accessed |
| DVDCC | Defined contribution pension – pension not accessed |
| DVDCTot | Defined contribution pension – any |
| DVAcconly | Respondent has no other pension except accessed DC pension |
| DVDbAcc | Defined benefit pension – accessed |
| DVDBC | Defined benefit pension – pension not accessed |
| DVDbTot | Defined benefit pension – any |
| DVDcWpAcc | DC - Workplace Pension – accessed |
| DVDcWpSav | DC - Workplace Pension – not accessed |
| DVDcWpTot | DC - Workplace Pension – total |
| DVPenMix | Mix of pensions held (excludes people with hybrid pensions) |
| DVPenLoopSw | Whether had any DC pension which was previous DB |
| DVPenSav | Whether currently saving into a pension (base: all respondents) |
| DVPENLCON_1 | Saving into DC pension manually |
| DVPENLCON_2 | Saving into DC pension automatically |
| DVPenSavDB | Currently saving into a DB pension |
| DVPenSavDC | Currently saving into a DC pension |
| DVDCAcc2015 | DC pension accessed since 2015 |
| DVDCAccpre | DC pension accessed before 2015 |
| DVDBAcc2015 | DB pension accessed since 2015 |
| DVDBAccpre | DB pension accessed before 2015 |
| DVLSumDC | Taken a DC pension as a lump sum |
| DVLSumDB | Taken a DB pension as a lump sum |
| DVLSumUse_1 | Uses of lump sum – saved or invested it (all pensions) |
| DVLSumUse_2 | Uses of lump sum – bought land or property (all pensions) |
| DVLSumUse_3 | Uses of lump sum – made a one-off purchase (all pensions) |
| DVLSumUse_4 | Uses of lump sum – paid off debts (all pensions) |
| DVLSumUse_5 | Uses of lump sum – used it to cover living costs (all pensions) |
| DVLSumUse_6 | Uses of lump sum – used it to support family members (all pensions) |
| DVLSumUse_7 | Uses of lump sum – other use (all pensions) |
| DVLSUMOTH_1 | Uses of pension, apart from lump sum – annuity (all pensions) |
| DVLSUMOTH_2 | Uses of pension, apart from lump sum – income drawdown (all pensions) |
| DVLSUMOTH_3 | Uses of pension, apart from lump sum – whole pension pot as a lump sum (all pensions) |
| DVLSUMOTH_4 | Uses of pension, apart from lump sum – left the rest of the money in pension (all pensions) |
| DVLSUMOTH_5 | Uses of pension, apart from lump sum – other use (all pensions) |
| DVLSUMOTH_6 | Uses of pension, apart from lump sum – none of these (all pensions) |
| DVAnnuity | Used pension to buy an annuity (with or without lump sum) |
| DVDrawD | Used pension for income drawdown (with or without lump sum) |
| DVDrawDY_1 | Reasons why decided to move pension into drawdown – to access tax-free cash lump sum |
| DVDrawDY_2 | Reasons why decided to move pension into drawdown – to be able to make flexible withdrawals from pension pot |
| DVDrawDY_3 | Reasons why decided to move pension into drawdown – to keep earning investment returns on pension pot during retirement |
| DVDrawDY_4 | Reasons why decided to move pension into drawdown – to be able to leave an inheritance |
| DVDrawDY_5 | Reasons why decided to move pension into drawdown – other |
| DVDBIncTotExp | Total income expected to receive from DB pensions |
| DVDBIncTot | Total income receiving from DB pensions |
| DVPenPotSav | Pensions total value saved into |
| DVPenPotSavGrp | Total DC pot size: retained pensions (banded) |
| DVWkpenproGrp | Employee contribution to workplace pension (banded) |
| DVWkpenempGrp | Employee contribution to workplace pension (banded) |
| DVWkpencomGrp | Combined employer/employee contribution to workplace pension (banded) |
| DVAgeCat | Respondent Age (banded) |
| DVEmployStat | Employment status |
| DVRetirestat | Retirement status: updated DV |
| DVHHStat | Household status (financial dependents) |
| DVFinLit1_Ans | Provided correct answer to FinLit1 |
| DVFinLit2_Ans | Provided correct answer to FinLit2 |
| DVFinLit3_Ans | Provided correct answer to FinLit3 |
| DVFinLit4_Ans | Provided correct answer to FinLit4 |
| DVFinLit5_Ans | Provided correct answer to FinLit5 |
| DVFinLit6_Ans | Provided correct answer to FinLit6 |
| DVFinLitScr | Overall financial literacy score (0-6) |
| DVFinLitCat | Financial literacy – high/medium/low |
| DVRIncGrpTot | Respondent income |
| DVPIncGrpTot | Partner income |
| DVHIncGrpTot | Other household members income |
| DVHIncGrpTot2 | Total household income |
| xDVRIncGrpTot | Respondent income (banded) |
| xDVHIncGrpTot2 | Household income (banded) |
| DVSavAmtTot | Value of savings and investments (banded) |
| DVSavGroup | Total savings (banded) |
| DVSRHealth | Self-rated health (bad and very bad categories combined) |
| SOCAll | Current occupation/occupation pre-retirement |
| NSSECALL | Current NSSEC/NSSEC pre-retirement |
| SPAYear | State Pension Age - Year |
| SPAMonth | State Pension Age - Month |
| SPAGrp | State Pension Age - Groups |
| DVActSpa | Whether correctly identified SPa |
| SPADiffOver | Difference between expected SPa and actual SPa amongst those over estimating |
| SPADiffUnder | Difference between expected SPa and actual SPa amongst those under estimating |
| DVPeninfo | whether received pensions information from provider or wake up pack |
Appendix D: Final non-response model
Age and sex
| Age/sex | B | S.E. | Wald | Df | Sig. | Odds |
|---|---|---|---|---|---|---|
| Variable data | – | – | 52.256 | 5 | 0.000 | – |
| Male 40-49 | (baseline) | – | – | – | – | – |
| Male 50-64 | 0.392 | 0.091 | 18.676 | 1 | 0.000 | 1.480 |
| Male 65-75 | 0.774 | 0.120 | 41.405 | 1 | 0.000 | 2.168 |
| Female 40-49 | 0.116 | 0.100 | 1.351 | 1 | 0.245 | 1.123 |
| Female 50-64 | 0.419 | 0.092 | 20.665 | 1 | 0.000 | 1.520 |
| Female 65-75 | 0.755 | 0.124 | 37.077 | 1 | 0.000 | 2.127 |
Region
| Region | B | S.E. | Wald | Df | Sig. | Odds |
|---|---|---|---|---|---|---|
| Variable data | – | – | 11.952 | 10 | 0.288 | – |
| North East | (baseline) | – | – | – | – | – |
| North West | -0.179 | 0.140 | 1.637 | 1 | 0.201 | 0.836 |
| Yorkshire and Humber | -0.187 | 0.147 | 1.622 | 1 | 0.203 | 0.830 |
| East Midlands | -0.115 | 0.147 | 0.613 | 1 | 0.433 | 0.891 |
| West Midlands | -0.250 | 0.146 | 2.920 | 1 | 0.087 | 0.779 |
| East of England | 0.012 | 0.141 | 0.007 | 1 | 0.934 | 1.012 |
| London | -0.211 | 0.153 | 1.898 | 1 | 0.168 | 0.810 |
| South East | -0.086 | 0.136 | 0.396 | 1 | 0.529 | 0.918 |
| South West | 0.002 | 0.142 | 0.000 | 1 | 0.986 | 1.002 |
| Wales | -0.143 | 0.161 | 0.791 | 1 | 0.374 | 0.867 |
| Scotland | -0.179 | 0.145 | 1.516 | 1 | 0.218 | 0.836 |
Employment status
| Employment status | B | S.E. | Wald | Df | Sig. | Odds |
|---|---|---|---|---|---|---|
| Variable data | – | – | 5.491 | 3 | 0.139 | – |
| Self employed | (baseline) | – | – | – | – | – |
| Employed | 0.125 | 0.113 | 1.218 | 1 | 0.270 | 1.133 |
| Retired | 0.085 | 0.134 | 0.406 | 1 | 0.524 | 1.089 |
| Other | 0.240 | 0.119 | 4.086 | 1 | 0.043 | 1.272 |
Ethnicity
| Ethnicity | B | S.E. | Wald | Df | Sig. | Odds |
|---|---|---|---|---|---|---|
| White (any) | (baseline) | – | – | – | – | – |
| Other | -0.355 | 0.101 | 12.302 | 1 | 0.000 | 0.701 |
Tenure
| Tenure | B | S.E. | Wald | Df | Sig. | Odds |
|---|---|---|---|---|---|---|
| Owned (any) | (baseline) | – | – | – | – | – |
| Rent/other | -0.309 | 0.067 | 21.239 | 1 | 0.000 | 0.734 |
Household composition
| Household composition | B | S.E. | Wald | Df | Sig. | Odds |
|---|---|---|---|---|---|---|
| Variable data | – | – | 29.582 | 3 | 0.000 | – |
| Single adult | (baseline) | – | – | – | – | – |
| 2+ adults | -0.259 | 0.065 | 16.054 | 1 | 0.000 | 0.771 |
| Single adult with children | -0.399 | 0.152 | 6.853 | 1 | 0.009 | 0.671 |
| 2+ adults with children | -0.429 | 0.082 | 27.202 | 1 | 0.000 | 0.651 |
Population density
| Population density | B | S.E. | Wald | Df | Sig. | Odds |
|---|---|---|---|---|---|---|
| Variable data | – | – | 10.771 | 4 | 0.029 | – |
| 1 Lowest | (baseline) | – | – | – | – | – |
| 2 | -0.176 | 0.076 | 5.295 | 1 | 0.021 | 0.839 |
| 3 | -0.184 | 0.078 | 5.600 | 1 | 0.018 | 0.832 |
| 4 | -0.192 | 0.080 | 5.714 | 1 | 0.017 | 0.826 |
| 5 Highest | -0.045 | 0.087 | 0.266 | 1 | 0.606 | 0.956 |
Education
| Education | B | S.E. | Wald | Df | Sig. | Odds |
|---|---|---|---|---|---|---|
| Variable data | – | – | 62.490 | 2 | 0.000 | – |
| Degree/equivalent | (baseline) | – | – | – | – | – |
| Other qualification | -0.400 | 0.060 | 45.178 | 1 | 0.000 | 0.670 |
| No qualifications | -0.683 | 0.099 | 48.031 | 1 | 0.000 | 0.505 |
Council tax band
| Education | B | S.E. | Wald | Df | Sig. | Odds |
|---|---|---|---|---|---|---|
| Variable data | – | – | 34.557 | 6 | 0.000 | – |
| Band A | (baseline) | – | – | – | – | – |
| Band B | 0.414 | 0.091 | 20.831 | 1 | 0.000 | 1.513 |
| Band C | 0.387 | 0.091 | 17.920 | 1 | 0.000 | 1.473 |
| Band D | 0.504 | 0.099 | 26.031 | 1 | 0.000 | 1.655 |
| Band E | 0.553 | 0.109 | 25.885 | 1 | 0.000 | 1.738 |
| Band F | 0.515 | 0.123 | 17.568 | 1 | 0.000 | 1.673 |
| Band G-I | 0.606 | 0.137 | 19.537 | 1 0.000 | 1.832 |
NS-SEC
| Education | B | S.E. | Wald | Df | Sig. | Odds |
|---|---|---|---|---|---|---|
| Variable data | – | – | 46.148 | 8 | 0.000 | – |
| 1.1 | (baseline) | – | – | – | – | – |
| 1.2 | 0.213 | 0.129 | 2.707 | 1 | 0.100 | 1.237 |
| 2.0 | 0.183 | 0.119 | 2.346 | 1 | 0.126 | 1.201 |
| 3.0 | 0.100 | 0.132 | 0.576 | 1 | 0.448 | 1.105 |
| 4.0 | 0.125 | 0.159 | 0.618 | 1 | 0.432 | 1.133 |
| 5.0 | -0.183 | 0.151 | 1.459 | 1 | 0.227 | 0.833 |
| 6.0 | -0.180 | 0.137 | 1.730 | 1 | 0.188 | 0.835 |
| 7.0 | -0.195 | 0.147 | 1.751 | 1 | 0.186 | 0.823 |
| 8.0 / 9.0 | -0.710 | 0.224 | 10.081 | 1 | 0.001 | 0.492 |
Constant
| Type | B | S.E. | Wald | Df | Sig. | Odds |
|---|---|---|---|---|---|---|
| Constant | -1.005 | 0.232 | 18.858 | 1 | 0.000 | 0.366 |
Key to variable data
The response is 1 = individual responding to the survey, 0 = non-response
The model R2 is 0.066 (Cox and Snell).
B is the estimate coefficient with standard error S.E.
The Wald-test measures the impact of the categorical variable on the model with the appropriate number of degrees of freedom (df). If the test is significant (sig. < 0.05), then the categorical variable is considered to be ‘significantly associated’ with the response variable
-
Collins, D., Toomse-Smith, M., Comanaru, R., Fenton, C., Silcock, D, and Dodds, T. (2019) Planning and Preparing for Later Life: A Social Survey Feasibility Report Department for Work and Pensions ad hoc research report no. 71. ↩
-
See Family Resources Survey Question Instructions 2017-18, pp. 329-30, for the full question wording. ↩
-
Read further details concerning the sample design of the Family Resources Survey 2017-18 can be obtained in the Background Note and Methodology document ↩
-
In addition to these criteria, a small number of respondents to FRS 2017-18 were ineligible to be selected for PPLL as they had already been sampled for an earlier follow-up study by the Department for Education. As there is little overlap between the population of interest for that study and PPLL this is likely to introduce minimal bias. ↩
-
The co-operation rate excludes anyone not capable of participating due to illness/language barrier. ↩
-
This includes 84 proxy refusals and 43 break-offs during the interview. ↩
-
This includes 52 sample members who had died since they completed the Family Resources Survey (FRS) 2017/18. ↩
-
The grossing weights that are produced for the Family Resources Survey are calculated at the household level. As the PPLL weights needed to be calculated at the person-level, it was not appropriate to use the FRS grossing weights to account for selection and non-response biases at FRS. Further details regarding the FRS weighting methodology are available in the FRS grossing methodology review published in June 2014. ↩
-
The probabilities used are taken directly from Background Note and Methodology for the Family Resources Survey 2017/18 The scaled value of W1 was 1.07 for England and Wales and 0.67 for Scotland. ↩
-
As discussed in the sampling section of this report, this design decision was taken to minimise the effect of clustering on the achieved survey sample. ↩
-
The most recent available update of the estimates was used to create targets for the calibration weighting. These were the mid-year population estimates for 2019 (published April 2020). ↩
-
As detailed in the sampling section, there was a change in survey mode due to the Covid-19 pandemic. As a result, the final PPLL sample was significantly larger than in the initial sampling design to account for the lower rates of response that are observed in push-to-telephone surveys compared to face-to-face interviewing. One of the consequences of the change to the PPLL sampling design is that approximately half of the final PPLL sample had no chance of being selected for the pilot. ↩
-
In addition to the explanatory variables specified in the final version of the non-response model, the following were also tested for inclusion: urban/rural status, output area classification super-group, and index of multiple deprivation rank (grouped). As the methodology for calculating IMD scores differs by country, separate categories were created for addresses in England, Wales and Scotland respectively. ↩
-
Having been scaled to a mean of 1, the minimum weight is 0.16 and the maximum weight is 5.96. The weights have an estimated design effect of 1.50. ↩
-
The PPLL sample is 40-75 year olds. The reason FRS analysis focused on 40-74 year olds is due to the age categories available in the FRS public datasets. ↩
-
This may, in part, be down to the way the PPLL sample was selected. Because only one individual per household was selected (unlike in FRS) single people had more chance of being selected. Although the PPLL design weights correct in part for this, they may not account for all differences. ↩