Parent, pupil and learner voice: June 2026
Updated 10 November 2026
Applies to England

© Crown copyright 2026
This publication is licensed under the terms of the Open Government Licence v3.0 except where otherwise stated. To view this licence, visit nationalarchives.gov.uk/doc/open-government-licence/version/3 or write to the Information Policy Team, The National Archives, Kew, London TW9 4DU, or email: psi@nationalarchives.gov.uk.
Where we have identified any third party copyright information you will need to obtain permission from the copyright holders concerned.
This publication is available at https://www.gov.uk/government/publications/parent-pupil-and-learner-voice-omnibus-surveys-for-2025-to-2026/parent-pupil-and-learner-voice-june-2026
Introduction
The Department for Education (DfE) commissioned Verian to recruit and maintain a panel of parents, pupils and learners in England, known as the parent, pupil and learner voice (PPLV). The PPLV is designed to collect robust evidence to help DfE understand the perspectives of parents, carers, pupils and learners. This allows the department to make more effective policy.
The PPLV works as a series of short surveys across the academic year, covering a range of new and longstanding policy issues. This report is about the findings from the June 2026 survey wave of the PPLV.
Methodology
The June 2026 PPLV survey included secondary school pupils in years 7 to 13, learners in further education (years 12 and 13) and parents of primary, secondary and special school pupils (years 1 to 11) who have agreed to participate in short, regular research surveys on topical education issues.
We select parents and pupils randomly using records from the National Pupil Database (NPD) and invite them to take part in an online survey. For the first survey of the academic year, we send invitation letters to households. For other surveys in that same academic year, we send the invitation by email and text message to the parents and pupils who agreed to join the panel in the first survey.
Midway through the academic year, we randomly select pupils and learners in years 12 and 13 and invite them to join the panel in the same way. We select learners (those studying in a college setting) from the individualised learner record (ILR) and we select pupils (those studying in a school setting) from the NPD. In this report, pupils and learners in years 12 and 13 are referred to as “16 to 19 pupils and learners”.
We ran the survey which is the main focus of this report between 30 June and 14 July 2026. The respondents were:
| Audience | Responses |
|---|---|
| Primary school parents | 858 |
| Secondary school parents | 1040 |
| Special school parents | 494 |
| Secondary school pupils | 1565 |
| 16 to 19 pupils and learners | 1440 |
Questions with fewer than 30 responses (before weighting) are not included in this report, and base sizes of below 100 should be treated with caution. Complete findings can be found in the published data tables, which include more detail on how different groups answered each question.
The report makes some comparisons to previous surveys conducted in previous academic years, for example the Parent, pupil and learner panel omnibus surveys for 2024 to 2025. These comparisons are helpful to understand how trends may be changing. However, the survey methodology changes over time and so comparisons to previous years are not as reliable as survey findings within each academic year. We introduced parents of pupils attending special schools in the 2023 to 2024 academic year, so any comparisons from earlier academic years do not include these audiences.
In this report, we round figures to the nearest whole number.
We use consistent terminology to describe percentages that fall within specific bands, as follows:
- very few – 0% to 10%
- a small minority – 11% to 32%
- a minority – 33% to 47%
- about half – 48% to 52%
- the majority – 53% to 66%
- a large majority – 67% to 89%
- almost all – 90% to 100%
We do not describe 0% and 100% as ‘none’ and ‘all’ because figure rounding may mean this is not accurate. For instance, 100% may be 99.6% of respondents, rounded to the nearest whole number. Data are rounded to the nearest percentage point. This means that when categories are combined, the rounded total figure may differ slightly from the sum of the rounded constituent figures.
Unless otherwise stated, when we refer to the ‘average’, we are reporting the arithmetic mean. Non-response categories such as ‘don’t know’ and ‘prefer not to say’ are not typically presented in our tabulations and charts when their value rounds to zero.
Wherever data have been ranked in descending order, the data are generally ordered according to the ‘Total’ column in the accompanying published data tables. As such, the order for individual sub-groups within a table or chart may not appear in strict descending order. Small sub-groups will have less influence on the overall ranking than larger sub-groups.
Further information on the survey methodology is available in the accompanying technical report.
Topics covered in this survey
The survey included questions about:
- mobile phones
- behaviour
- school suspensions and exclusions
- bullying
- wellbeing
- post-16 options
- school belonging
Mobile phones
We asked school pupils in years 7 to 13 how often pupils in their school followed the rules on mobile phones in the past week of term.
Figure 1: How often other pupils in their school followed the rules on mobile phones in the past week
| Key stage | All of the time | Most of the time | Some of the time | Rarely | Never | Don’t know | Total |
|---|---|---|---|---|---|---|---|
| Key stage 3 | 23% | 40% | 21% | 9% | 4% | 2% | 100% |
| Key stage 4 | 8% | 40% | 24% | 17% | 6% | 5% | 100% |
| 16 to 19 pupils | 9% | 41% | 30% | 15% | 3% | 2% | 100% |
Base: Key stage 3 pupils (n = 883), key stage 4 pupils (n = 682) and 16 to 19 pupils (n = 707). Data table reference = “phones_followrules”.
The majority of key stage 3 pupils (63%) and around half of key stage 4 pupils (48%) and 16 to 19 pupils (50%) said that pupils in their school had followed the rules on mobile phones all or most of the time in the past week. When the question was asked previously, in June 2025, a lower proportion of key stage 3 pupils (39%) and key stage 4 pupils (31%) said that pupils in their school had followed the rules on mobile phones all or most of the time. However, the proportion of 16 to 19 learners who said pupils in their school had followed the rules on phones was higher in June 2025 (56%) than in June 2026.
We asked parents if they were aware of their child’s school mobile phone policy.
Figure 2: Whether parents were aware of their child’s school mobile phone policy
| Phase | I am familiar with the detail of the policy | I know a bit about the policy | I am aware there is a policy but know nothing else | I have not heard of this policy | Don’t know | Total |
|---|---|---|---|---|---|---|
| Primary parents | 42% | 20% | 12% | 21% | 5% | 100% |
| Secondary parents | 70% | 22% | 5% | 2% | 1% | 100% |
| Special school parents | 44% | 15% | 11% | 23% | 8% | 100% |
Base: All primary parents (n = 858), secondary parents (n = 1040) and special school parents (494). Data table reference = “phones_policyawareness”.
Overall, 74% of primary parents, 97% of secondary parents and 69% of special school parents were aware of their child’s school having a mobile phone policy. When this question was last asked in June 2025, the figures for primary parents and secondary parents were broadly similar. However, the proportion of special school parents who were aware of their child’s school mobile phone policy was lower in June 2025 (62%).
We then asked parents who knew at least a bit about their child’s school mobile phone policy what their child’s school mobile phone policy said about how pupils are allowed to use mobile phones whilst at school.
Figure 3: Mobile phone policies that parents said are in place at their child’s school
| Response | Primary parents | Secondary parents | Special school parents |
|---|---|---|---|
| They can bring their mobile phone to school but it must be kept out of sight, and they are not allowed to use it | 13% | 62% | 13% |
| They must hand their mobile phone in or leave it in a secure place that they cannot access during the school day | 50% | 23% | 47% |
| They are not allowed to bring their mobile phone onto school grounds | 30% | 4% | 23% |
| They are only allowed to use their mobile phone when a teacher says they can during lessons | 0% | 5% | 2% |
| They are allowed to use their mobile phone during break and lunch time | 0% | 3% | 3% |
| They can use their mobile phone at any time in school | 2% | 0% | 2% |
| Other | 1% | 2% | 4% |
| Don’t know | 4% | 1% | 5% |
Base: Primary parents (n = 554), secondary parents (n = 952) and special school parents (286) who knew at least a bit about their child’s school mobile phone policy. Data table reference = “phones_content”.
The proportion of secondary parents who said their child must hand their mobile phone in or leave it in a secure place that they cannot access during the school day was higher in June 2026 (23%) than in June 2025 when the question was previously asked (9%).
Conversely, the proportion of secondary parents who said their child was not allowed to bring their mobile phone onto school grounds was lower in June 2026 (4%) than in June 2025 (9%). The proportion of secondary parents who said their child was only allowed to use their mobile phone when the teacher said they could during lessons was also lower in June 2026 (5%) than in June 2025 (10%).
For primary parents and special school parents, the figures were broadly similar to when this question was last asked in June 2025.
We also asked parents who knew at least a bit about their child’s school mobile phone policy the extent to which they agreed or disagreed that they were supportive of it.
Figure 4: The extent to which parents were supportive of their child’s school mobile phone policy
| Phase | Strongly agree | Agree | Neither agree nor disagree | Disagree | Strongly disagree | Don’t know | Total |
|---|---|---|---|---|---|---|---|
| Primary parents | 64% | 26% | 6% | 3% | 0% | 1% | 100% |
| Secondary parents | 47% | 30% | 10% | 8% | 3% | 0% | 100% |
| Special school parents | 60% | 26% | 9% | 3% | 1% | 2% | 100% |
Base: Primary parents (n = 554), secondary parents (n = 952) and special school parents (286) who knew at least a bit about their child’s school mobile phone policy. Data table reference = “phones_policyeffective”.
Overall, 90% of primary parents, 78% of secondary parents and 85% of special school parents agreed or strongly agreed that they were supportive of their child’s school mobile phone policy. This was broadly in line with June 2025 when the question was asked previously.
Behaviour
We asked school pupils in years 7 to 13 how they would rate the behaviour of pupils at their school over the past week of term.
Figure 5: Pupil rating of behaviour over the previous week of term
| Key stage | Very good | Good | Neither good nor poor | Poor | Very poor | Don’t know | Prefer not to say | Total |
|---|---|---|---|---|---|---|---|---|
| Key stage 3 | 10% | 45% | 25% | 13% | 4% | 2% | 1% | 100% |
| Key stage 4 | 18% | 50% | 20% | 9% | 1% | 2% | 0% | 100% |
| 16 to 19 pupils | 22% | 51% | 18% | 6% | 1% | 2% | 1% | 100% |
Base: Key stage 3 pupils (n = 883), key stage 4 pupils (n = 682) and 16 to 19 pupils (n = 707). Data table reference = “behaviour_rating”.
Overall, 55% of key stage 3 pupils, 68% of key stage 4 pupils and 72% of 16 to 19 pupils rated the behaviour of pupils at their school as good or very good in the previous week of term.
When previously asked in May 2025, a lower proportion of key stage 3 pupils (39%), key stage 4 pupils (44%) and 16 to 19 pupils (67%) rated behaviour as good or very good.
We also asked school pupils in years 7 to 13 how often they thought their school had been calm and orderly over the past week of term.
Figure 6: How often pupils thought their school was calm and orderly over the previous week of term
| Key stage | Every day | Most days | Some days | Never | Don’t know | Total |
|---|---|---|---|---|---|---|
| Key stage 3 | 16% | 43% | 33% | 7% | 2% | 100% |
| Key stage 4 | 13% | 57% | 21% | 7% | 3% | 100% |
| 16 to 19 pupils | 24% | 52% | 19% | 3% | 2% | 100% |
Base: Key stage 3 pupils (n = 883), key stage 4 pupils (n = 682) and 16 to 19 pupils (n = 707). Data table reference = “behaviour_calm”.
Overall, 59% of key stage 3 pupils, 70% of key stage 4 pupils and 76% of 16 to 19 pupils said that their school had been calm and orderly on every day or most days in the previous week of term.
When previously asked in May 2025, a lower proportion of key stage 3 pupils (53%) and key stage 4 pupils (56%) said that their school had been calm and orderly on every day or most days in the previous week of term. The figure for 16 to 19 pupils in May 2025 (74%) was broadly in line with June 2026.
We also asked school pupils in years 7 to 13 how often, if at all, misbehaviour of other pupils had interrupted the lesson or stopped them doing their work in the past week of term.
Figure 7: How often misbehaviour of other pupils stopped or interrupted the lesson or stopped them doing their work in the previous week of term
| Key stage | All lessons | Most lessons | Some lessons | Rarely | Never | Don’t know | Total |
|---|---|---|---|---|---|---|---|
| Key stage 3 | 6% | 19% | 44% | 26% | 3% | 2% | 100% |
| Key stage 4 | 4% | 13% | 32% | 39% | 9% | 2% | 100% |
| 16 to 19 pupils | 2% | 6% | 23% | 46% | 21% | 2% | 100% |
Base: Key stage 3 pupils (n = 883), key stage 4 pupils (n = 682) and 16 to 19 pupils (n = 707). Data table reference = “behaviour_misbehaviour”.
A large majority of key stage 3 pupils (70%) said that misbehaviour had interrupted all, most or some lessons in the previous week of term. Half of key stage 4 pupils (50%) and 31% of 16 to 19 pupils said the same.
When previously asked in May 2025, a similar proportion of key stage 3 pupils (68%) and 16 to 19 pupils (27%) said that misbehaviour had interrupted all, most or some lessons in the previous week of term. However, the proportion of key stage 4 pupils experiencing lesson disruption was higher in May 2025 (64%) than in June 2026.
For those who reported that misbehaviour of other pupils had stopped or interrupted the lesson or them doing their work, we asked how quickly their teachers were able to address this so learning could continue.
Figure 8: How quickly teachers addressed misbehaviour
| Key stage | Very quickly | Fairly quickly | Not very quickly | Not quickly at all | Not sure | Varies too much to say | Total |
|---|---|---|---|---|---|---|---|
| Key stage 3 | 13% | 59% | 15% | 7% | 2% | 4% | 100% |
| Key stage 4 | 15% | 51% | 24% | 5% | 2% | 4% | 100% |
| 16 to 19 pupils | 23% | 57% | 10% | 4% | 2% | 4% | 100% |
Base: Key stage 3 pupils (n = 820), key stage 4 pupils (n = 595) and 16 to 19 pupils (n = 518) who reported misbehaviour of other pupils which stopped or interrupted the lesson or them doing their work. Data table reference = “behaviour_addressed”.
Overall, 72% of key stage 3 pupils, 65% of key stage 4 pupils and 80% of 16 to 19 pupils said that misbehaviour had been addressed fairly or very quickly.
When this question was previously asked in May 2025, similar proportions of key stage 3 pupils (70%), key stage 4 pupils (67%) and 16 to 19 pupils (83%) said misbehaviour had been addressed fairly or very quickly.
We asked all school pupils in years 7 to 13 how often, if at all, they had experienced different types of pupil misbehaviour during lessons or classes they had attended in the past week of term.
Figure 9: How often pupils experienced different types of pupil misbehaviour during lessons or classes they attended during the past week of term
| Statement | All lessons | Most lessons | Some lessons | Rarely | Never | Don’t know | Total |
|---|---|---|---|---|---|---|---|
| Pupils talking | 28% | 35% | 27% | 6% | 1% | 3% | 100% |
| Pupils arriving to lessons late | 8% | 21% | 41% | 23% | 4% | 3% | 100% |
| Pupils shouting out | 12% | 23% | 34% | 23% | 7% | 2% | 100% |
| Pupils answering back or challenging instructions | 6% | 16% | 38% | 27% | 10% | 2% | 100% |
| Pupils using mobile devices when not supposed to | 6% | 12% | 23% | 28% | 27% | 4% | 100% |
Base: All school pupils in years 7 to 13 (n = 2272). Data table reference = “pupilbehaviour_talking”, “pupilbehaviour_shouting”, “pupilbehaviour_challenge”, “pupilbehaviour_phones”, “pupilbehaviour_late”.
Overall, 90% of pupils reported that some lessons, most lessons or all lessons in the past week had been interrupted by pupils talking, 70% reported interruption due to pupils arriving late and 68% reported interruption due to pupils shouting out. Pupils answering back or challenging instructions had interrupted lessons for 60% of pupils and 41% reported interruption due to pupils using mobile devices when they were not supposed to.
The proportion of pupils who reported lessons had been interrupted by pupils arriving late to lessons was higher when this question was previous asked in June 2025 (76%). The proportion whose lessons had been interrupted by pupils shouting out was also higher in June 2025 (74%). Similarly, the proportion whose lessons had been interrupted by pupils using mobile devices when they were not supposed to was higher in June 2025 (58%). The prevalence of the other forms of interruption remained broadly unchanged comparing June 2025 and June 2026.
We also asked school pupils in years 7 to 13 how much, if at all, they would say they were motivated to learn.
Figure 10: How motivated pupils were to learn
| Key stage | Very motivated | Fairly motivated | Not very motivated | Not at all motivated | Don’t know | Total |
|---|---|---|---|---|---|---|
| Key stage 3 | 19% | 55% | 16% | 5% | 4% | 100% |
| Key stage 4 | 20% | 54% | 18% | 5% | 2% | 100% |
| 16 to 19 pupils | 23% | 57% | 15% | 3% | 2% | 100% |
Base: Key stage 3 pupils (n = 883), key stage 4 pupils (n = 682) and 16 to 19 pupils (n = 707). Data table reference = “motivation_learn”.
A large majority of key stage 3 pupils (74%), key stage 4 pupils (75%) and 16 to 19 pupils (80%) said they were very or fairly motivated to learn.
When previously asked, in May 2025, a similar proportion of key stage 3 pupils (72%), and a lower proportion of key stage 4 pupils (67%) and 16 to 19 pupils (75%) said they were very or fairly motivated to learn.
We also asked school pupils in years 7 to 13 how often they thought their school’s rules on behaviour were applied fairly to all pupils. Fair treatment was defined as treating everyone in a way that was reasonable and appropriate to their circumstances.
Figure 11: How often school rules were applied fairly to all pupils
| Key stage | All of the time | Most of the time | Some of the time | Never | Don’t know | Total |
|---|---|---|---|---|---|---|
| Key stage 3 | 21% | 42% | 26% | 5% | 5% | 100% |
| Key stage 4 | 18% | 47% | 27% | 5% | 2% | 100% |
| 16 to 19 pupils | 22% | 48% | 21% | 5% | 3% | 100% |
Base: Key stage 3 pupils (n = 883), key stage 4 pupils (n = 682) and 16 to 19 pupils (n = 707). Data table reference = “behave_fair”.
Overall, 64% of key stage 3 pupils, 65% of key stage 4 pupils and 70% of 16 to 19 pupils said school rules were applied fairly to all pupils, either all or most of the time.
When previously asked, in May 2025, a lower proportion of key stage 4 pupils (58%) said school rules were applied fairly to all pupils, either all or most of the time. The equivalent proportions for key stage 3 pupils (61%) and 16 to 19 pupils (73%) in May 2025 were broadly the same as in June 2026.
We asked parents how easy their child found their school’s rules on behaviour to follow.
Figure 12: How easy pupils found their school’s behaviour rules to follow, according to parents
| Phase | Very easy | Fairly easy | Not very easy | Not easy at all | Don’t know | Total |
|---|---|---|---|---|---|---|
| Primary | 55% | 37% | 5% | 1% | 1% | 100% |
| Secondary | 46% | 41% | 8% | 4% | 1% | 100% |
| Special | 25% | 43% | 15% | 7% | 9% | 100% |
Base: All primary parents (n = 858), secondary parents (n = 1040) and special school parents (494). Data table reference = “behaviour_easy”.
Overall, 92% of primary parents, 87% of secondary parents and 68% of special school parents said their child found it very or fairly easy to follow their school’s behaviour rules.
When previously asked, in March 2025, a similar proportion of primary parents (92%), secondary parents (85%) and special school parents (69%) said their child found it easy to follow their school’s behaviour rules.
We also asked parents to what extent they agreed or disagreed that their child understood what would happen if they didn’t meet the expected standards of behaviour.
Figure 13: Extent to which parents agreed or disagreed that their child understood what would happen if they didn’t meet the expected standards of behavior
| Phase | Strongly agree | Agree | Neither agree nor disagree | Disagree | Strongly disagree | Don’t know | Total |
|---|---|---|---|---|---|---|---|
| Primary | 47% | 45% | 5% | 2% | 1% | 1% | 100% |
| Secondary | 53% | 39% | 5% | 1% | 1% | 0% | 100% |
| Special | 19% | 35% | 17% | 11% | 12% | 5% | 100% |
Base: All primary parents (n = 858), secondary parents (n = 1040) and special school parents (494). Data table reference = “behaviour_expectations”.
Almost all primary parents (92%) and secondary parents (92%) agreed or strongly agreed that their child understood what would happen if they didn’t meet the expected standards of behaviour. Among special school parents, 54% agreed or strongly agreed their child understood what would happen if they didn’t meet the expected standards of behaviour.
When previously asked, in March 2025, a similar proportion of primary parents (90%), secondary parents (94%) and special school parents (51%) agreed or strongly agreed that their child understood what would happen if they didn’t meet the expected standards of behaviour.
We asked parents to what extent they agreed or disagreed that they were supportive of the behaviour rules at their child’s school.
Figure 14: Extent that parents agreed or disagreed that they were supportive of behaviour rules at their child’s school
| Phase | Strongly agree | Agree | Neither agree nor disagree | Disagree | Strongly disagree | Don’t know | Total |
|---|---|---|---|---|---|---|---|
| Primary | 49% | 42% | 6% | 2% | 0% | 1% | 100% |
| Secondary | 44% | 39% | 10% | 5% | 1% | 1% | 100% |
| Special | 43% | 40% | 10% | 2% | 2% | 3% | 100% |
Base: All primary parents (n = 858), secondary parents (n = 1040) and special school parents (494). Data table reference = “behaviour_supportive”.
A large majority of primary parents (91%), secondary parents (83%) and special school parents (84%) agreed or strongly agreed that they were supportive of the behaviour rules at their child’s school.
When previously asked, in March 2025, a similar proportion of primary parents (89%), secondary parents (79%) and special school parents (81%) agreed or strongly agreed that they were supportive of their child’s school’s behaviour rules.
We also asked parents to what extent they agreed or disagreed that they were supportive of how the school’s behaviour rules were implemented.
Figure 15: Extent to which parents agreed or disagreed that they were supportive of how the school’s behaviour rules were implemented
| Phase | Strongly agree | Agree | Neither agree nor disagree | Disagree | Strongly disagree | Don’t know | Total |
|---|---|---|---|---|---|---|---|
| Primary | 36% | 44% | 12% | 6% | 1% | 1% | 100% |
| Secondary | 33% | 42% | 14% | 8% | 2% | 1% | 100% |
| Special | 35% | 41% | 14% | 4% | 2% | 4% | 100% |
Base: All primary parents (n = 858), secondary parents (n = 1040) and special school parents (494). Data table reference = “behaviour_implemented”.
Overall, 80% of primary parents, 75% of secondary parents and 75% of special school parents agreed or strongly agreed that they were supportive of how the behaviour rules at their child’s school were implemented.
When previously asked, in March 2025, a similar proportion of primary parents (79%), secondary parents (72%) and special school parents (75%) agreed or strongly agreed that they were supportive of how their child’s school’s behaviour rules were implemented.
We then asked parents whether their child’s school communicated with them about their child’s behaviour.
Figure 16: Whether the school communicated with parents about their child’s behaviour
| Phase | I receive regular updates | Only if there are issues with behaviour | No | Don’t know | Total |
|---|---|---|---|---|---|
| Primary | 27% | 58% | 13% | 2% | 100% |
| Secondary | 42% | 47% | 10% | 2% | 100% |
| Special | 54% | 38% | 6% | 2% | 100% |
Base: All primary parents (n = 858), secondary parents (n = 1040) and special school parents (494). Data table reference = “behaviour_communicate”.
A large majority of primary parents (85%), secondary parents (89%) and special school parents (92%) said the school communicated with them about their child’s behaviour, either through regular updates or on an ad hoc basis if there were issues with behaviour.
When last asked, in March 2025, a similar proportion of primary parents (85%), secondary parents (87%) and special school parents (91%) said the school communicated with them about their child’s behaviour.
School suspensions and exclusions
We asked parents if their child had been suspended, excluded, or both suspended and excluded from school for any reason, since the start of the school year in September 2025. Overall, 4% said their child had been suspended and 1% said their child had been permanently excluded.
More specifically, 2% of primary parents, 6% of secondary parents and 5% of special school parents said their child had been suspended from school since the start of the school year. Over the same period, 0% of primary parents, 1% of secondary parents, and 1% of special school parents said their child had been permanently excluded.
We asked parents whose child had been suspended whether the school held a reintegration meeting following the suspension. A reintegration meeting was defined as a meeting arranged by their child’s school to support their return to school life and full-time education following a suspension.
Figure 17: Whether schools held a reintegration meeting
| Audience | Yes, I attended | Yes, but I didn’t attend | No | Don’t know | Prefer not to say | Total |
|---|---|---|---|---|---|---|
| Parents | 72% | 3% | 24% | 0% | 0% | 100% |
Base: Parents whose child had been suspended from school since the start of the school year (n = 171). Data table reference = “exclusion_reintegrate”.
We asked parents whose child had been suspended or excluded since the start of the school year whether they had challenged their child’s suspension or permanent exclusion at the governing board exclusion review. A governing board exclusion review was defined as being a meeting where parents could ask the school’s governing board to reconsider a decision to suspend or permanently exclude their child. Overall, 23% of parents said they did challenge the suspension or exclusion.
We asked parents who said they did not challenge their child’s suspension or exclusion what was their main reason for not making a challenge at the governing board exclusion review.
Figure 18: Main reason why parents did not challenge their child’s suspension or exclusion at governing board exclusion review
| Response | Parents |
|---|---|
| I agreed with the decision | 28% |
| I wasn’t aware I could challenge | 25% |
| I didn’t feel I would be successful | 20% |
| I didn’t understand the process to challenge | 9% |
| Another reason | 11% |
| Don’t know | 5% |
| Prefer not to say | 3% |
Base: Parents whose child had been suspended or excluded from school since the start of the school year and who did not challenge the suspension or exclusion (n = 132). Data table reference = “exclusions_challengewhy”.
Bullying
We asked school pupils in years 7 to 13 whether they were happy to answer questions about bullying and their school’s response to it. Overall, 95% of pupils agreed to answer questions on this topic.
We asked pupils who consented to answering questions about bullying whether they had been a victim of bullying for any reason in the past 12 months. They were asked to include both online bullying (cyber-bullying) and bullying in person. Overall, 20% of pupils said they had been bullied, either by pupils at their school (18%) or by someone else (2%).
More specifically, 25% of key stage 3 pupils, 16% of key stage 4 pupils and 8% of 16 to 19 pupils said they had been a victim of bullying in the last 12 months.
In May 2025, when the question was previously asked, similar proportions of key stage 3 pupils (25%), key stage 4 pupils (19%) and 16 to 19 pupils (11%) said they had been a victim of any kind of bullying in the previous 12 months.
We also asked parents if their child had been a victim of online or in-person bullying in the previous 12 months. Overall, 26% of parents said their child had been a victim of bullying, either by pupils at their school (24%) or by someone else (3%).
More specifically, 26% of primary parents, 25% of secondary parents and 18% of special school parents said their child had been a victim of bullying in the previous 12 months.
When previously asked, in May 2025, a similar proportion of primary parents (25%), secondary parents (24%) and special school parents (21%) said their child had been a victim of bullying in the previous 12 months.
We asked pupils who had been a victim of bullying where the bullying had taken place. A large majority (88%) said they had been bullied in person and 31% said they had been bullied online.
We also asked parents whose children had been a victim of bullying where the bullying had taken place. Almost all parents (94%) said bullying had occurred in person and 20% said that bullying had taken place online.
When previously asked, in May 2025, a similar proportion of pupils (87%) and parents (94%) said bullying had occurred in person, and a similar proportion of pupils (29%) and parents (19%) said that the bullying had taken place online.
We asked pupils who had been bullied in person in the past 12 months why they had been bullied in person. Similarly, we asked parents whose child had been bullied in person why that was. They were shown a list of reasons and asked to select all that applied, if any.
Figure 19: Reasons why pupils had been bullied in person in the previous 12 months, as reported by pupils and parents
| Response | Pupils | Parents |
|---|---|---|
| The way they look | 43% | 34% |
| A disability or special educational need | 18% | 20% |
| Their sexual orientation | 11% | 3% |
| Their race or ethnicity | 8% | 8% |
| Their sex | 7% | 5% |
| Their nationality | 5% | 5% |
| Their religion or belief | 4% | 2% |
| I don’t know the reason | 23% | 22% |
| Other | 28% | 35% |
| Prefer not to say | 5% | 1% |
Base: Pupils who had been bullied in person in the past 12 months (n = 434). Parents who said their child had been a victim of in person bullying in the past 12 months. (n = 636). Data table reference = “bullying_inpersonreason”.
The stated reasons for in-person bullying were broadly the same as in May 2025 when the question was previously asked.
We asked pupils who had been bullied online in the past 12 months why they had been bullied online. Similarly, we asked parents whose child had been bullied online why that was. They were shown a list of reasons and asked to select all that applied, if any.
Figure 20: Reasons why pupils had been bullied online in the previous 12 months, as reported by pupils and parents
| Response | Pupils | Parents |
|---|---|---|
| The way they look | 36% | 43% |
| Their race or ethnicity | 15% | 4% |
| A disability or special educational need | 13% | 19% |
| Their nationality | 12% | 2% |
| Their sexual orientation | 6% | 7% |
| Their sex | 5% | 4% |
| Their religion or belief | 5% | 2% |
| I don’t know the reason | 26% | 22% |
| Other | 33% | 38% |
| Prefer not to say | 0% | 1% |
Base: Pupils who had been bullied online in the past 12 months (n = 167). Parents who said their child had been a victim of online bullying in the past 12 months (n = 168). Data table reference = “bullying_onlinereason”.
The stated reasons for online bullying were generally similar to May 2025 when the question was previously asked. However, the proportion of pupils who said the reason for their bullying was because of their race or ethnicity was higher in June 2026 (15%) than in May 2025 (8%). The proportion of pupils who said the reason for their online bullying was because of their nationality was also higher in June 2026 (12%) than in May 2025 (4%). The proportion of parents who said the online bullying was because of their child’s sex was lower in June 2026 (4%) than in May 2025 (10%).
Wellbeing
We asked pupils a series of questions about personal wellbeing validated by the Office for National Statistics (ONS). These questions are known as the ‘ONS4’ personal wellbeing measures and are answered using a scale from 0 to 10. For happiness, life satisfaction and the sense of things you do in life being worthwhile, a higher score is indicative of better personal wellbeing. For anxiety, a lower score is indicative of better personal wellbeing.
In surveys conducted across this academic year and the previous academic year, the average scores for year 7 to 11 pupils’ wellbeing measures were:
Figure 21: Pupils’ average wellbeing scores over time, as reported by pupils in years 7 to 11
| Wave | Happiness | Worthwhile | Life satisfaction | Anxiety |
|---|---|---|---|---|
| June 2026 | 7.2 | 7.3 | 7.3 | 3.7 |
| March 2026 | 7.3 | 7.3 | 7.4 | 3.5 |
| October 2025 | 7.2 | 7.5 | 7.4 | 3.2 |
| May 2025 | 7.2 | 7.2 | 7.3 | 3.7 |
| March 2025 | 7.1 | 4.0 | ||
| February 2025 | 7.2 | 7.1 | 7.1 | 3.6 |
| September 2024 | 7.1 | 7.4 | 7.3 | 3.2 |
Base: Pupils in years 7 to 11 in June 2026 (n = 1565), March 2026 (n = 2323), October 2025 (n = 3531), May 2025 (n = 2592), March 2025 (n = 1493), February 2025 (n = 906) and September 2024 (n = 3402). Data have been rebased on pupils in years 7 to 11. Specific wellbeing measures were not asked of year 7 to 11 pupils in any waves where a value is not shown. Data table reference = “wellbeing_happy”, “wellbeing_worthwhile”, “wellbeing_satisfied” and “wellbeing_anxious”.
Figure 22: Pupils’ average happiness scores over time, as reported by pupils in years 7 to 11
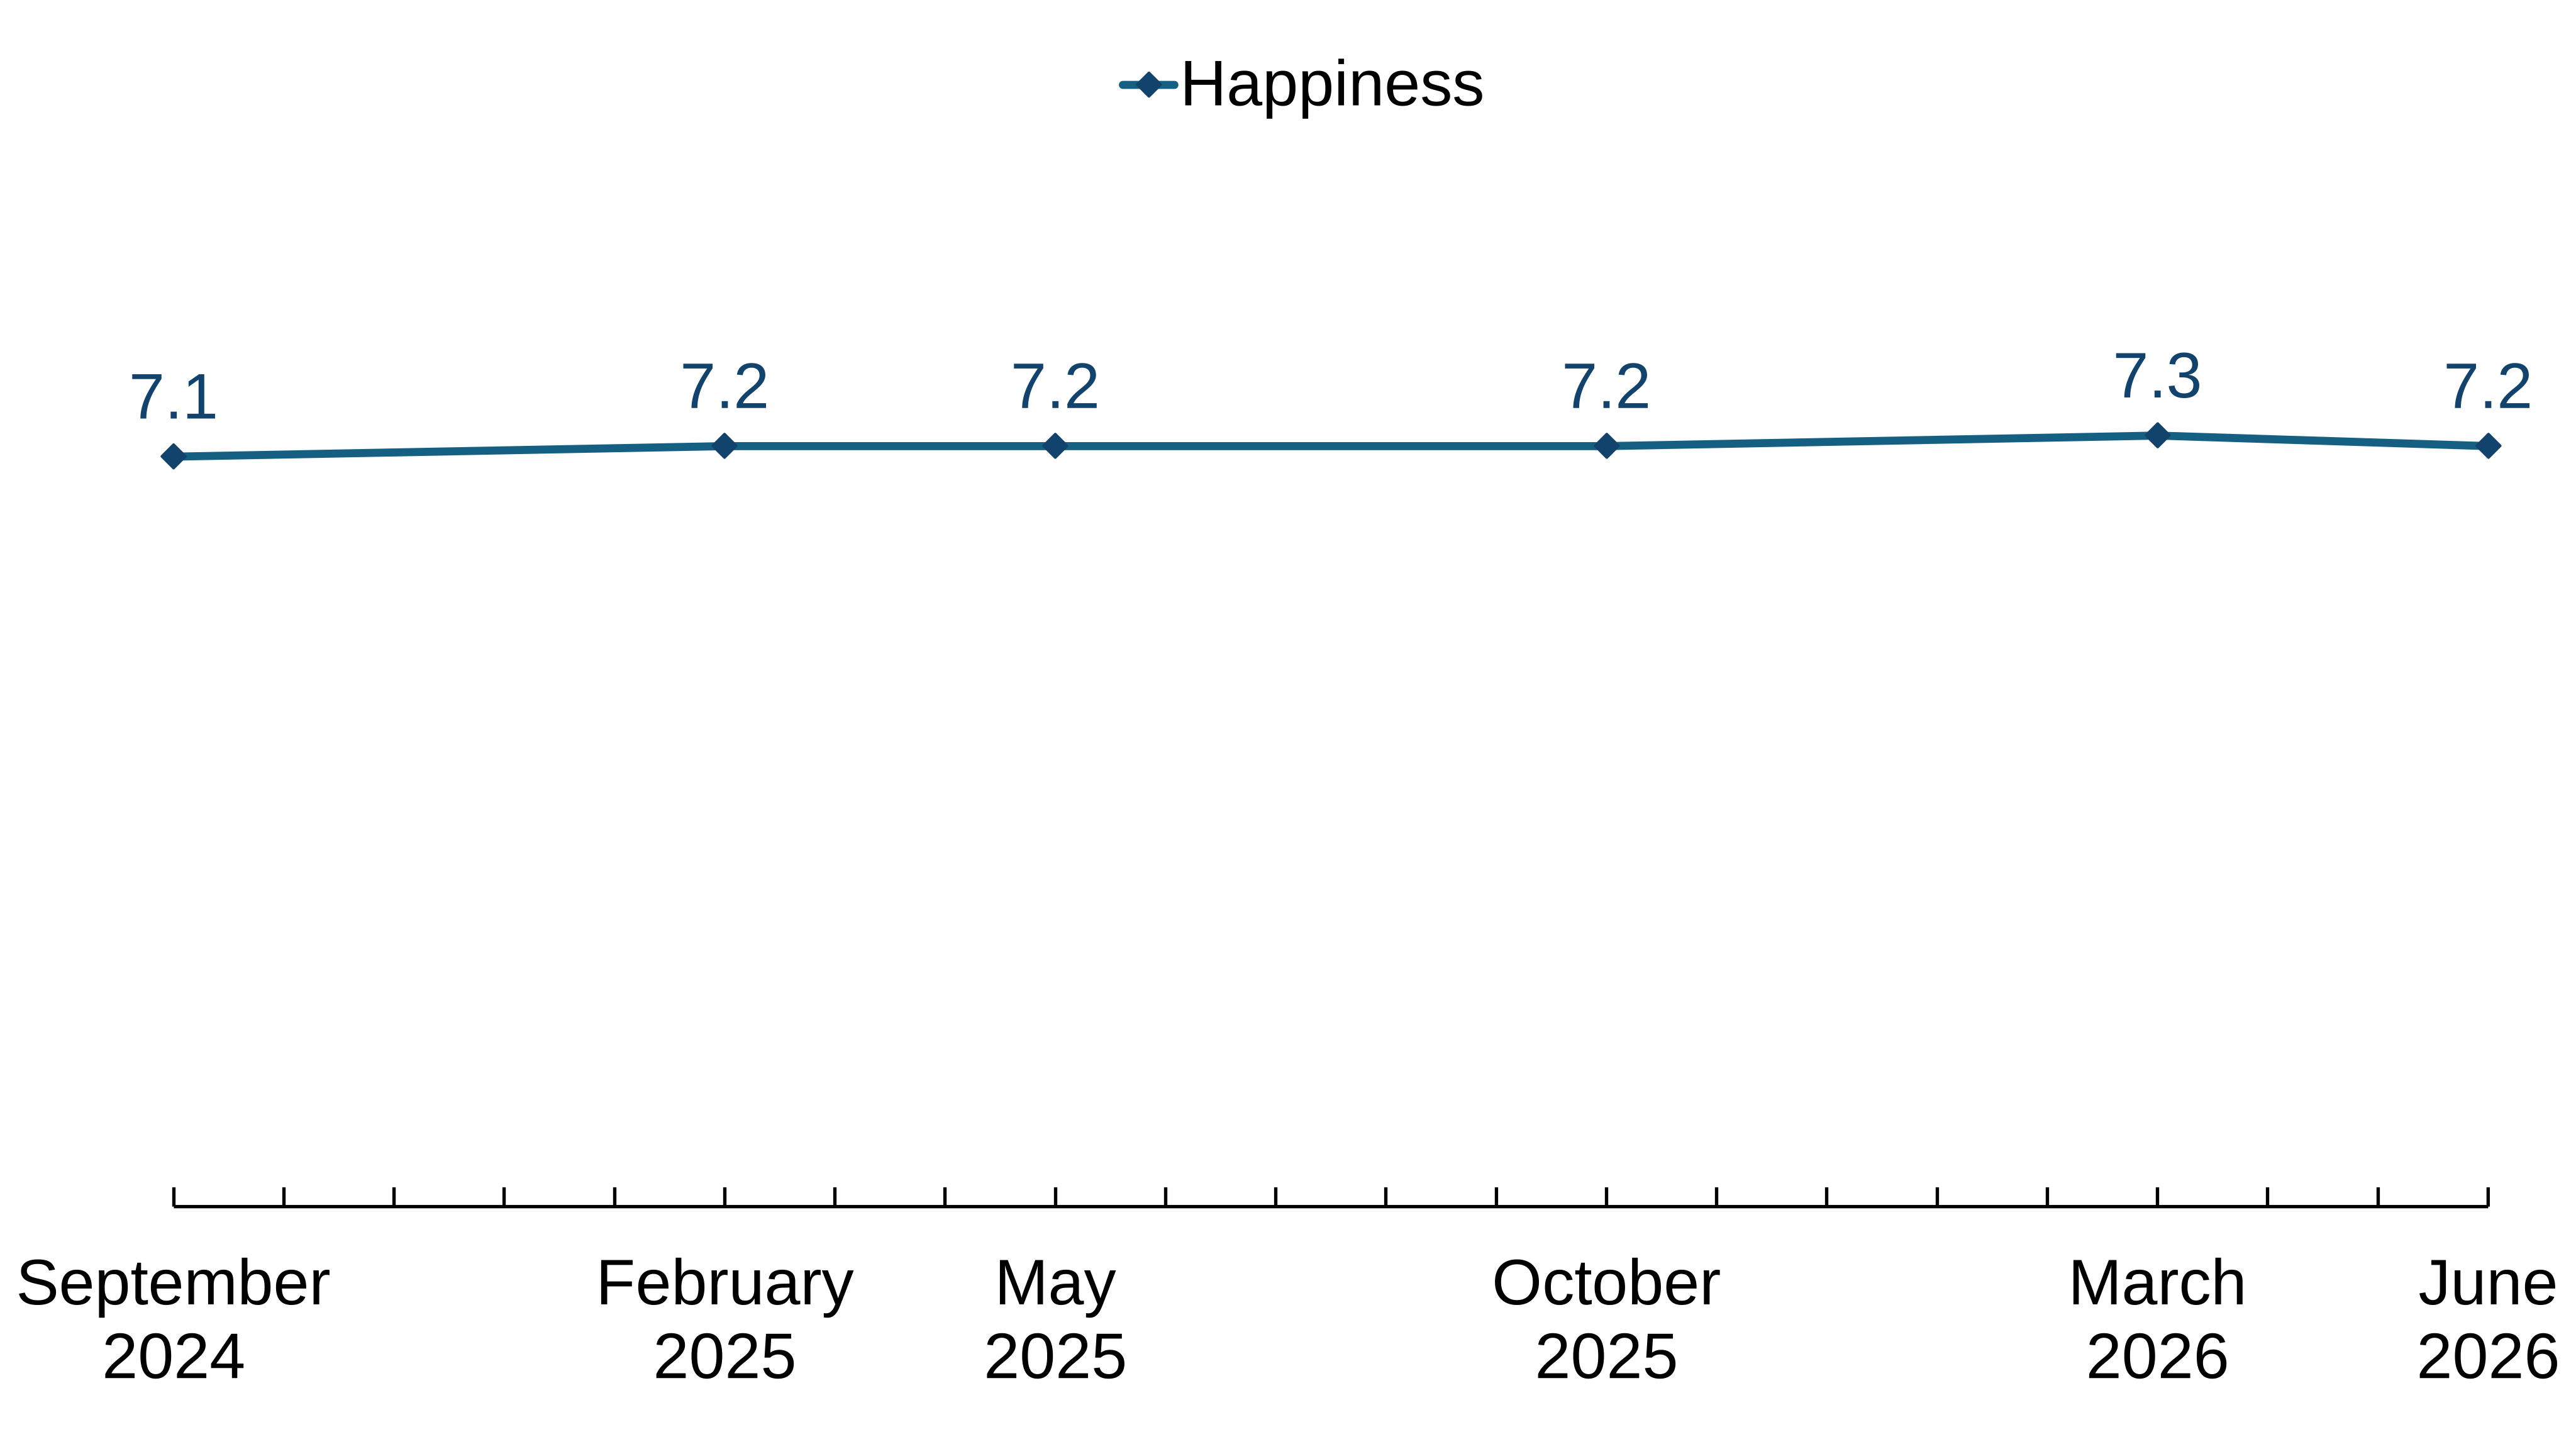
Base: Pupils in years 7 to 11 in June 2026 (n = 1565), March 2026 (n = 2323), October 2025 (n = 3531), May 2025 (n = 2592), February 2025 (n = 906) and September 2024 (n = 3402). Data table reference = “wellbeing_happy”.
Figure 22 visualises some of the ONS wellbeing data in Figure 21. It shows average happiness scores over time for pupils in years 7 to 11, based on data reported by the pupils themselves. The data span waves of research conducted between September 2024 and June 2026. Over this period, the mean happiness scores ranged from a minimum of 7.1 in September 2024 and a maximum of 7.3 in March 2026.
Figure 23: Pupils’ average ‘worthwhile’ scores over time, as reported by pupils in years 7 to 11
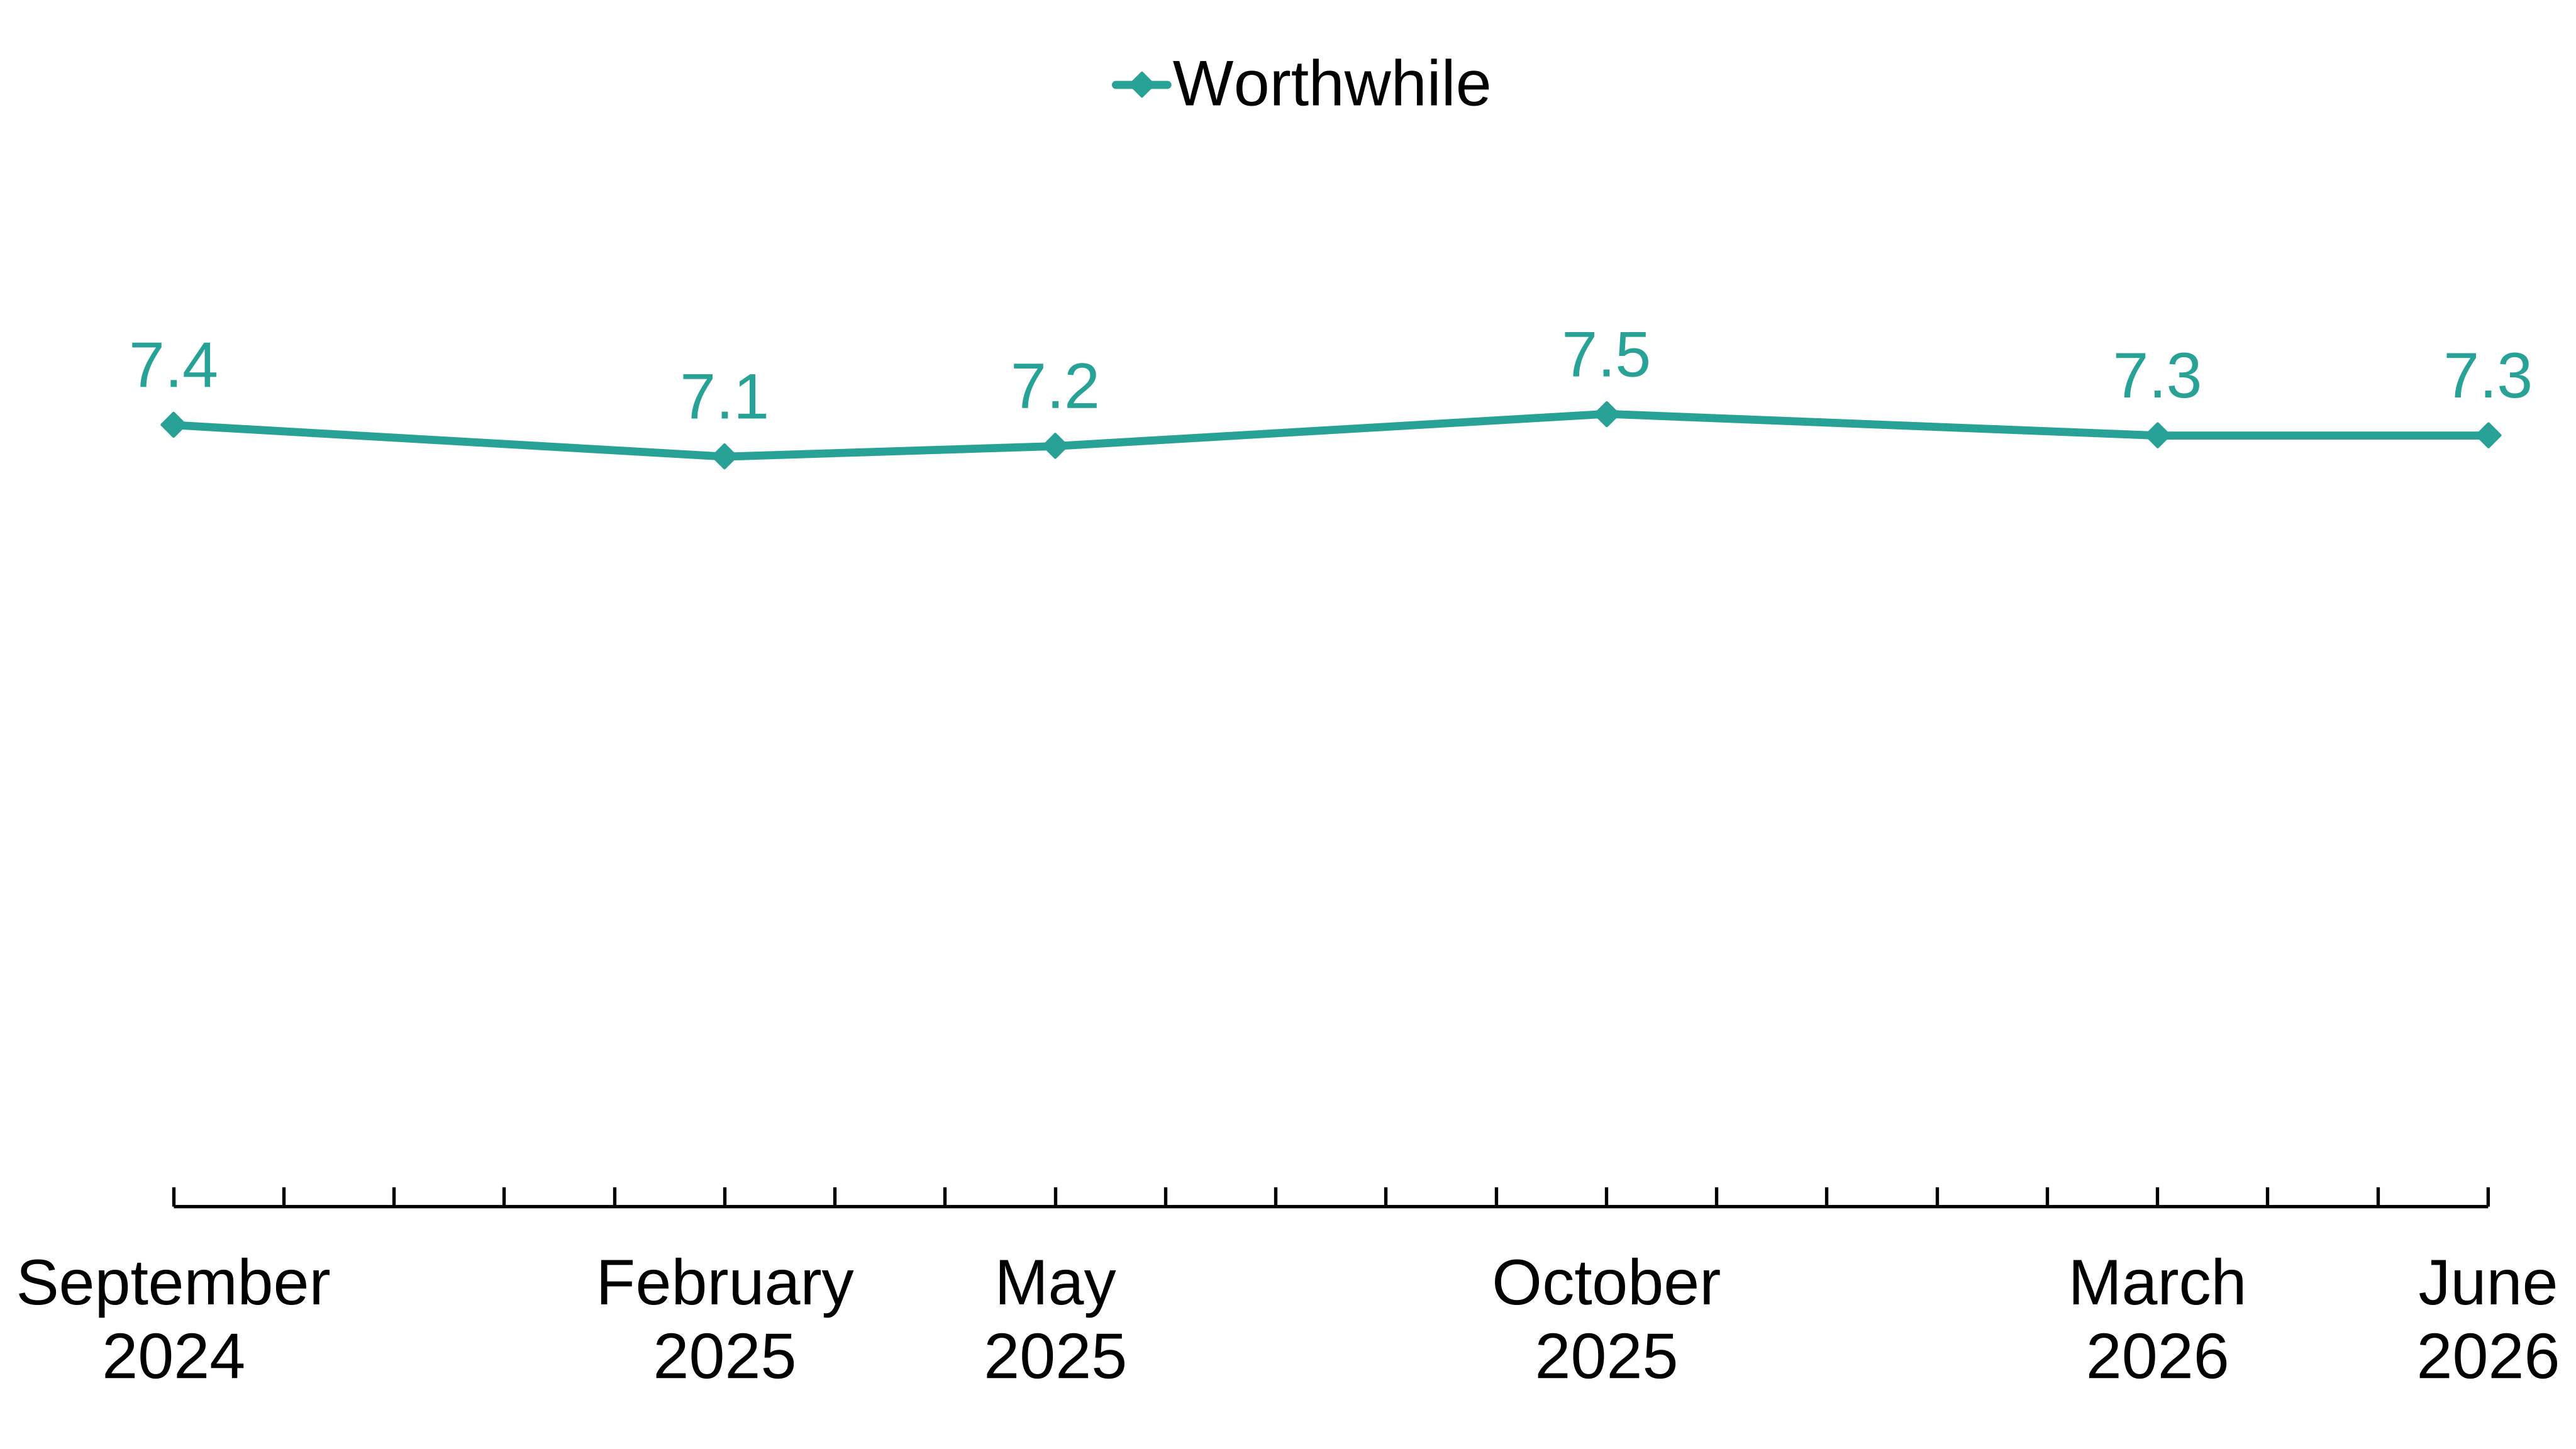
Base: Pupils in years 7 to 11 in June 2026 (n = 1565), March 2026 (n = 2323), October 2025 (n = 3531), May 2025 (n = 2592), February 2025 (n = 906) and September 2024 (n = 3402). Data table reference = “wellbeing_worthwhile”.
Figure 23 visualises some of the ONS wellbeing data in Figure 21. It shows average ‘worthwhile’ scores over time for pupils in years 7 to 11, based on data reported by the pupils themselves. The data span waves of research conducted between September 2024 and June 2026. Over this period, the mean worthwhile scores ranged from a minimum of 7.1 in February 2025 to a maximum of 7.5 in October 2025.
Figure 24: Pupils’ average life satisfaction scores over time, as reported by pupils in years 7 to 11
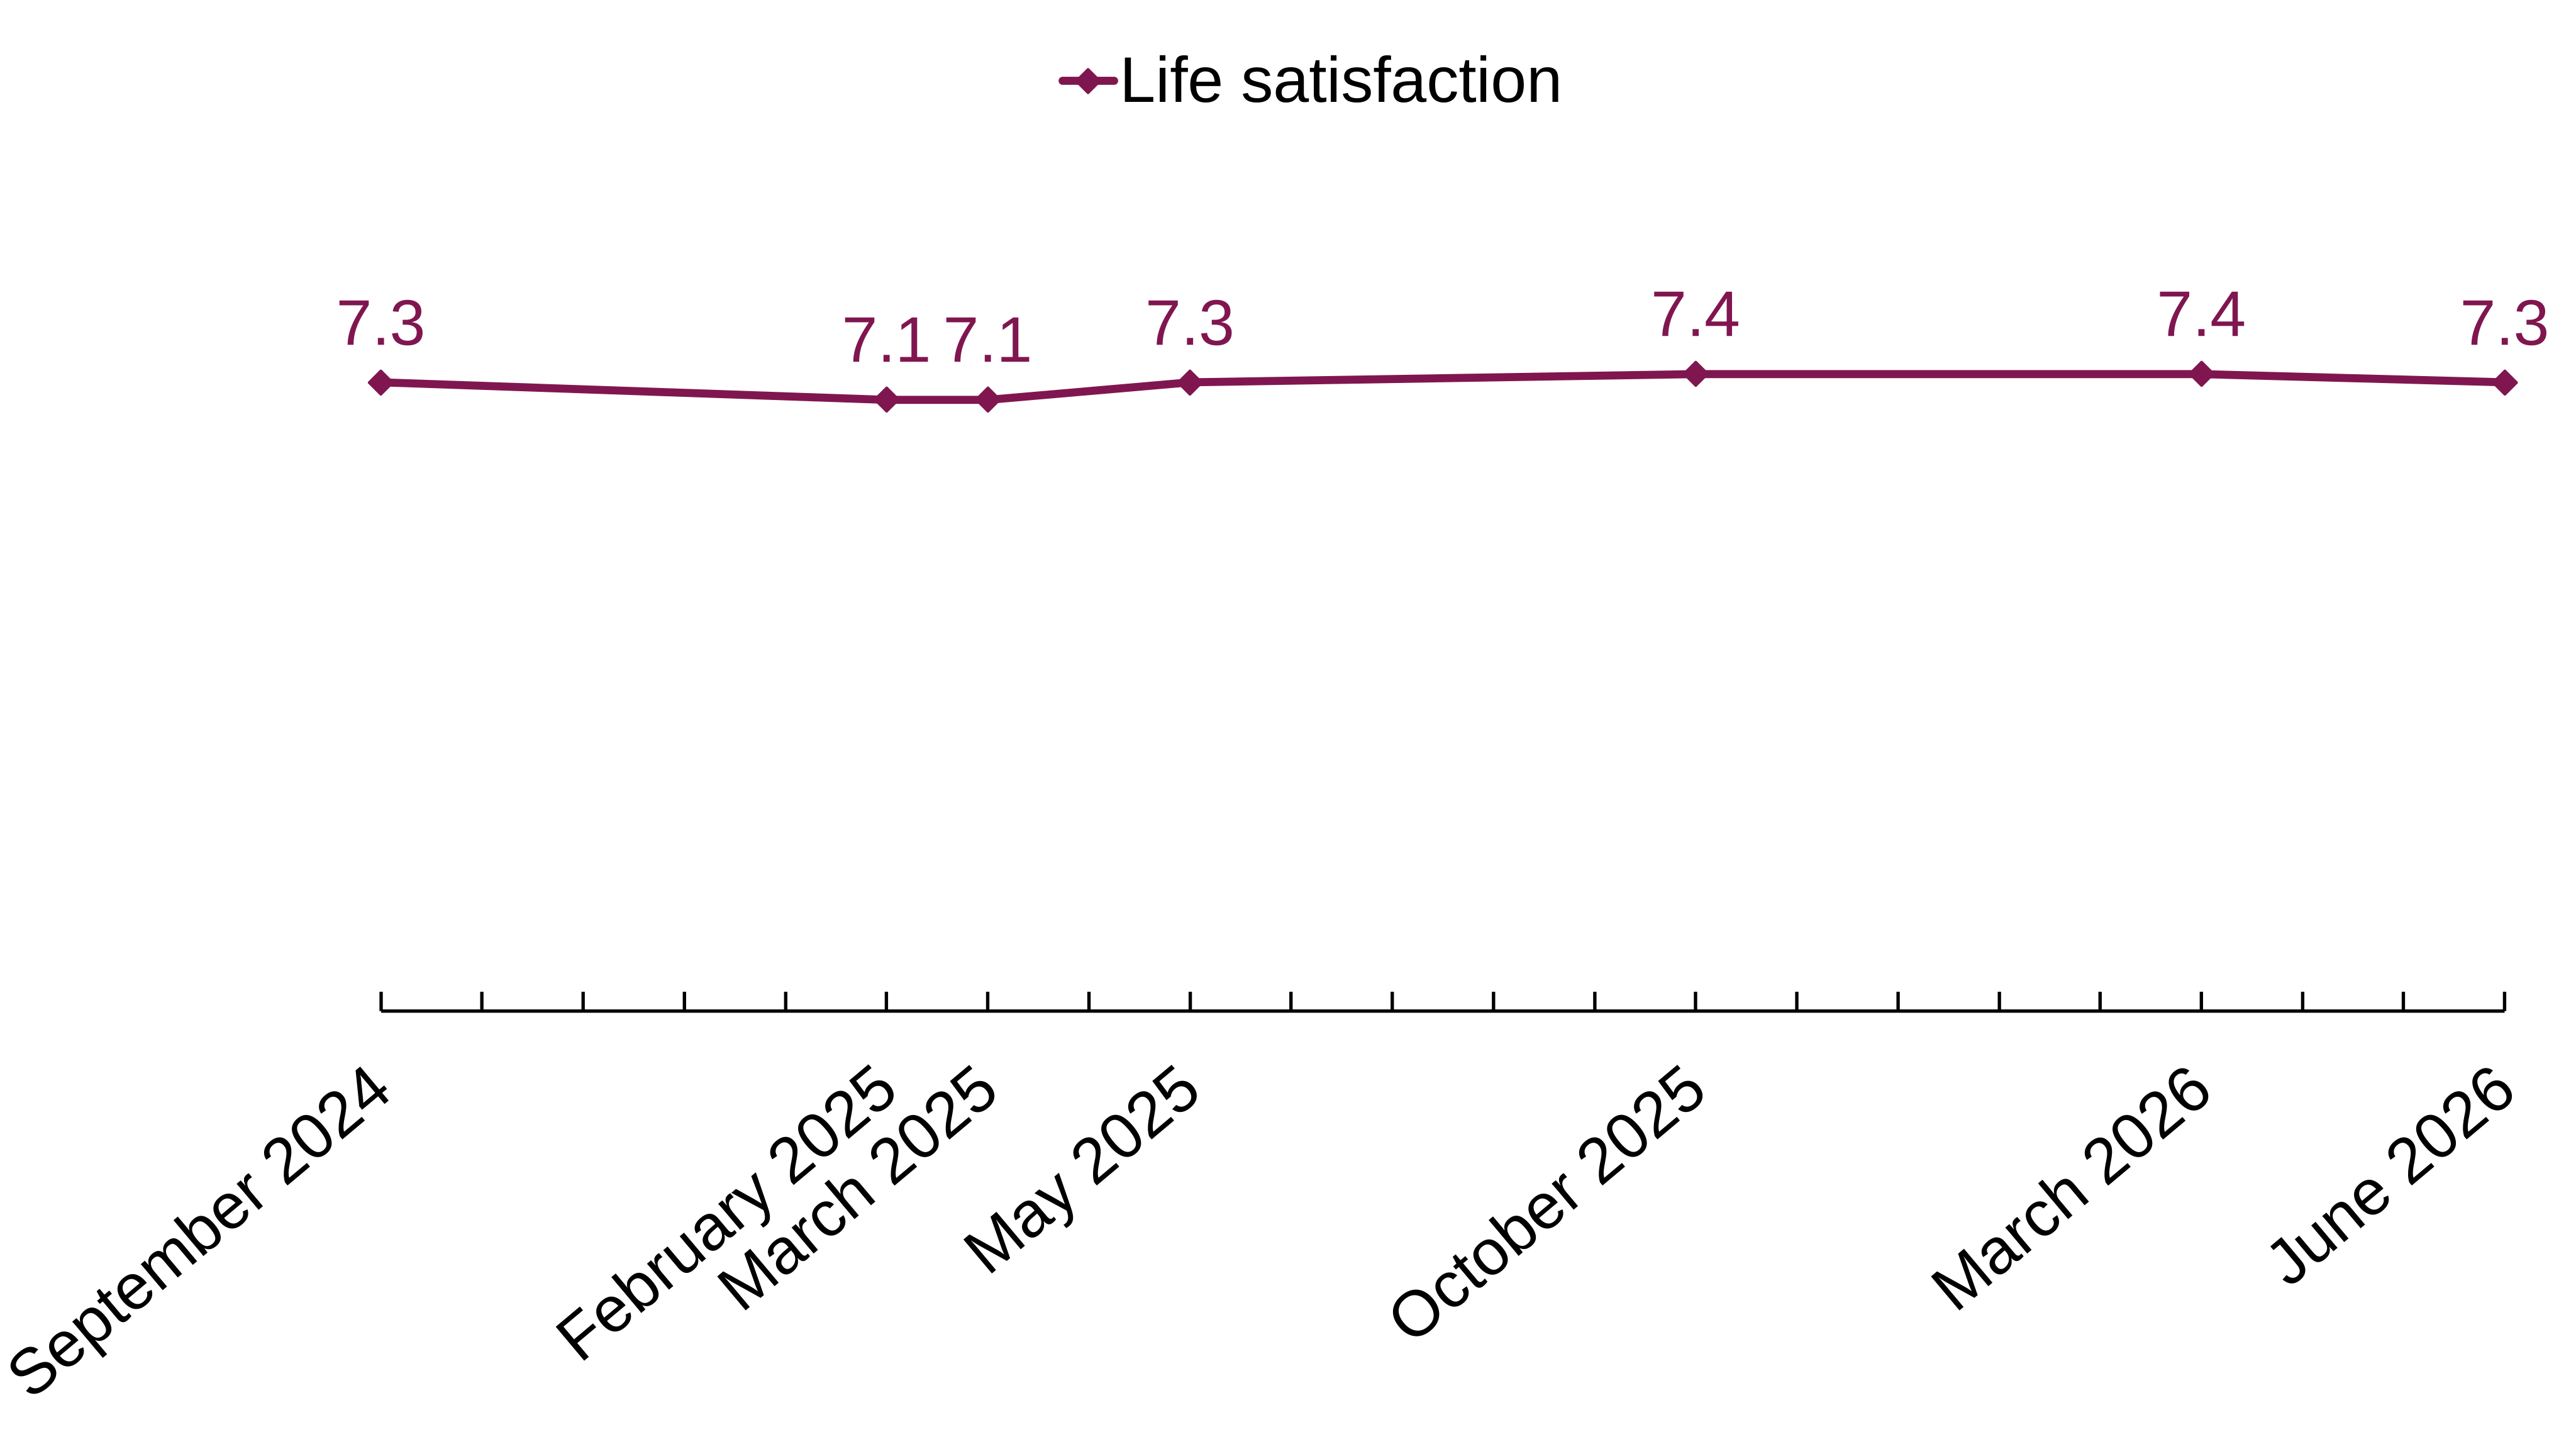
Base: Pupils in years 7 to 11 in June 2026 (n = 1565), March 2026 (n = 2323), October 2025 (n = 3531), May 2025 (n = 2592), March 2025 (n = 1493), February 2025 (n = 906) and September 2024 (n = 3402). Data table reference = “wellbeing_satisfied”.
Figure 24 visualises some of the ONS wellbeing data in Figure 21. It shows average life satisfaction scores over time for pupils in years 7 to 11, based on data reported by the pupils themselves. The data span waves of research conducted between September 2024 and June 2026. Over this period, the mean life satisfaction scores ranged from a minimum of 7.1 in February 2025 and March 2025 to a maximum of 7.4 in October 2025 and March 2026.
Figure 25: Pupils’ average anxiety scores over time, as reported by pupils in years 7 to 11
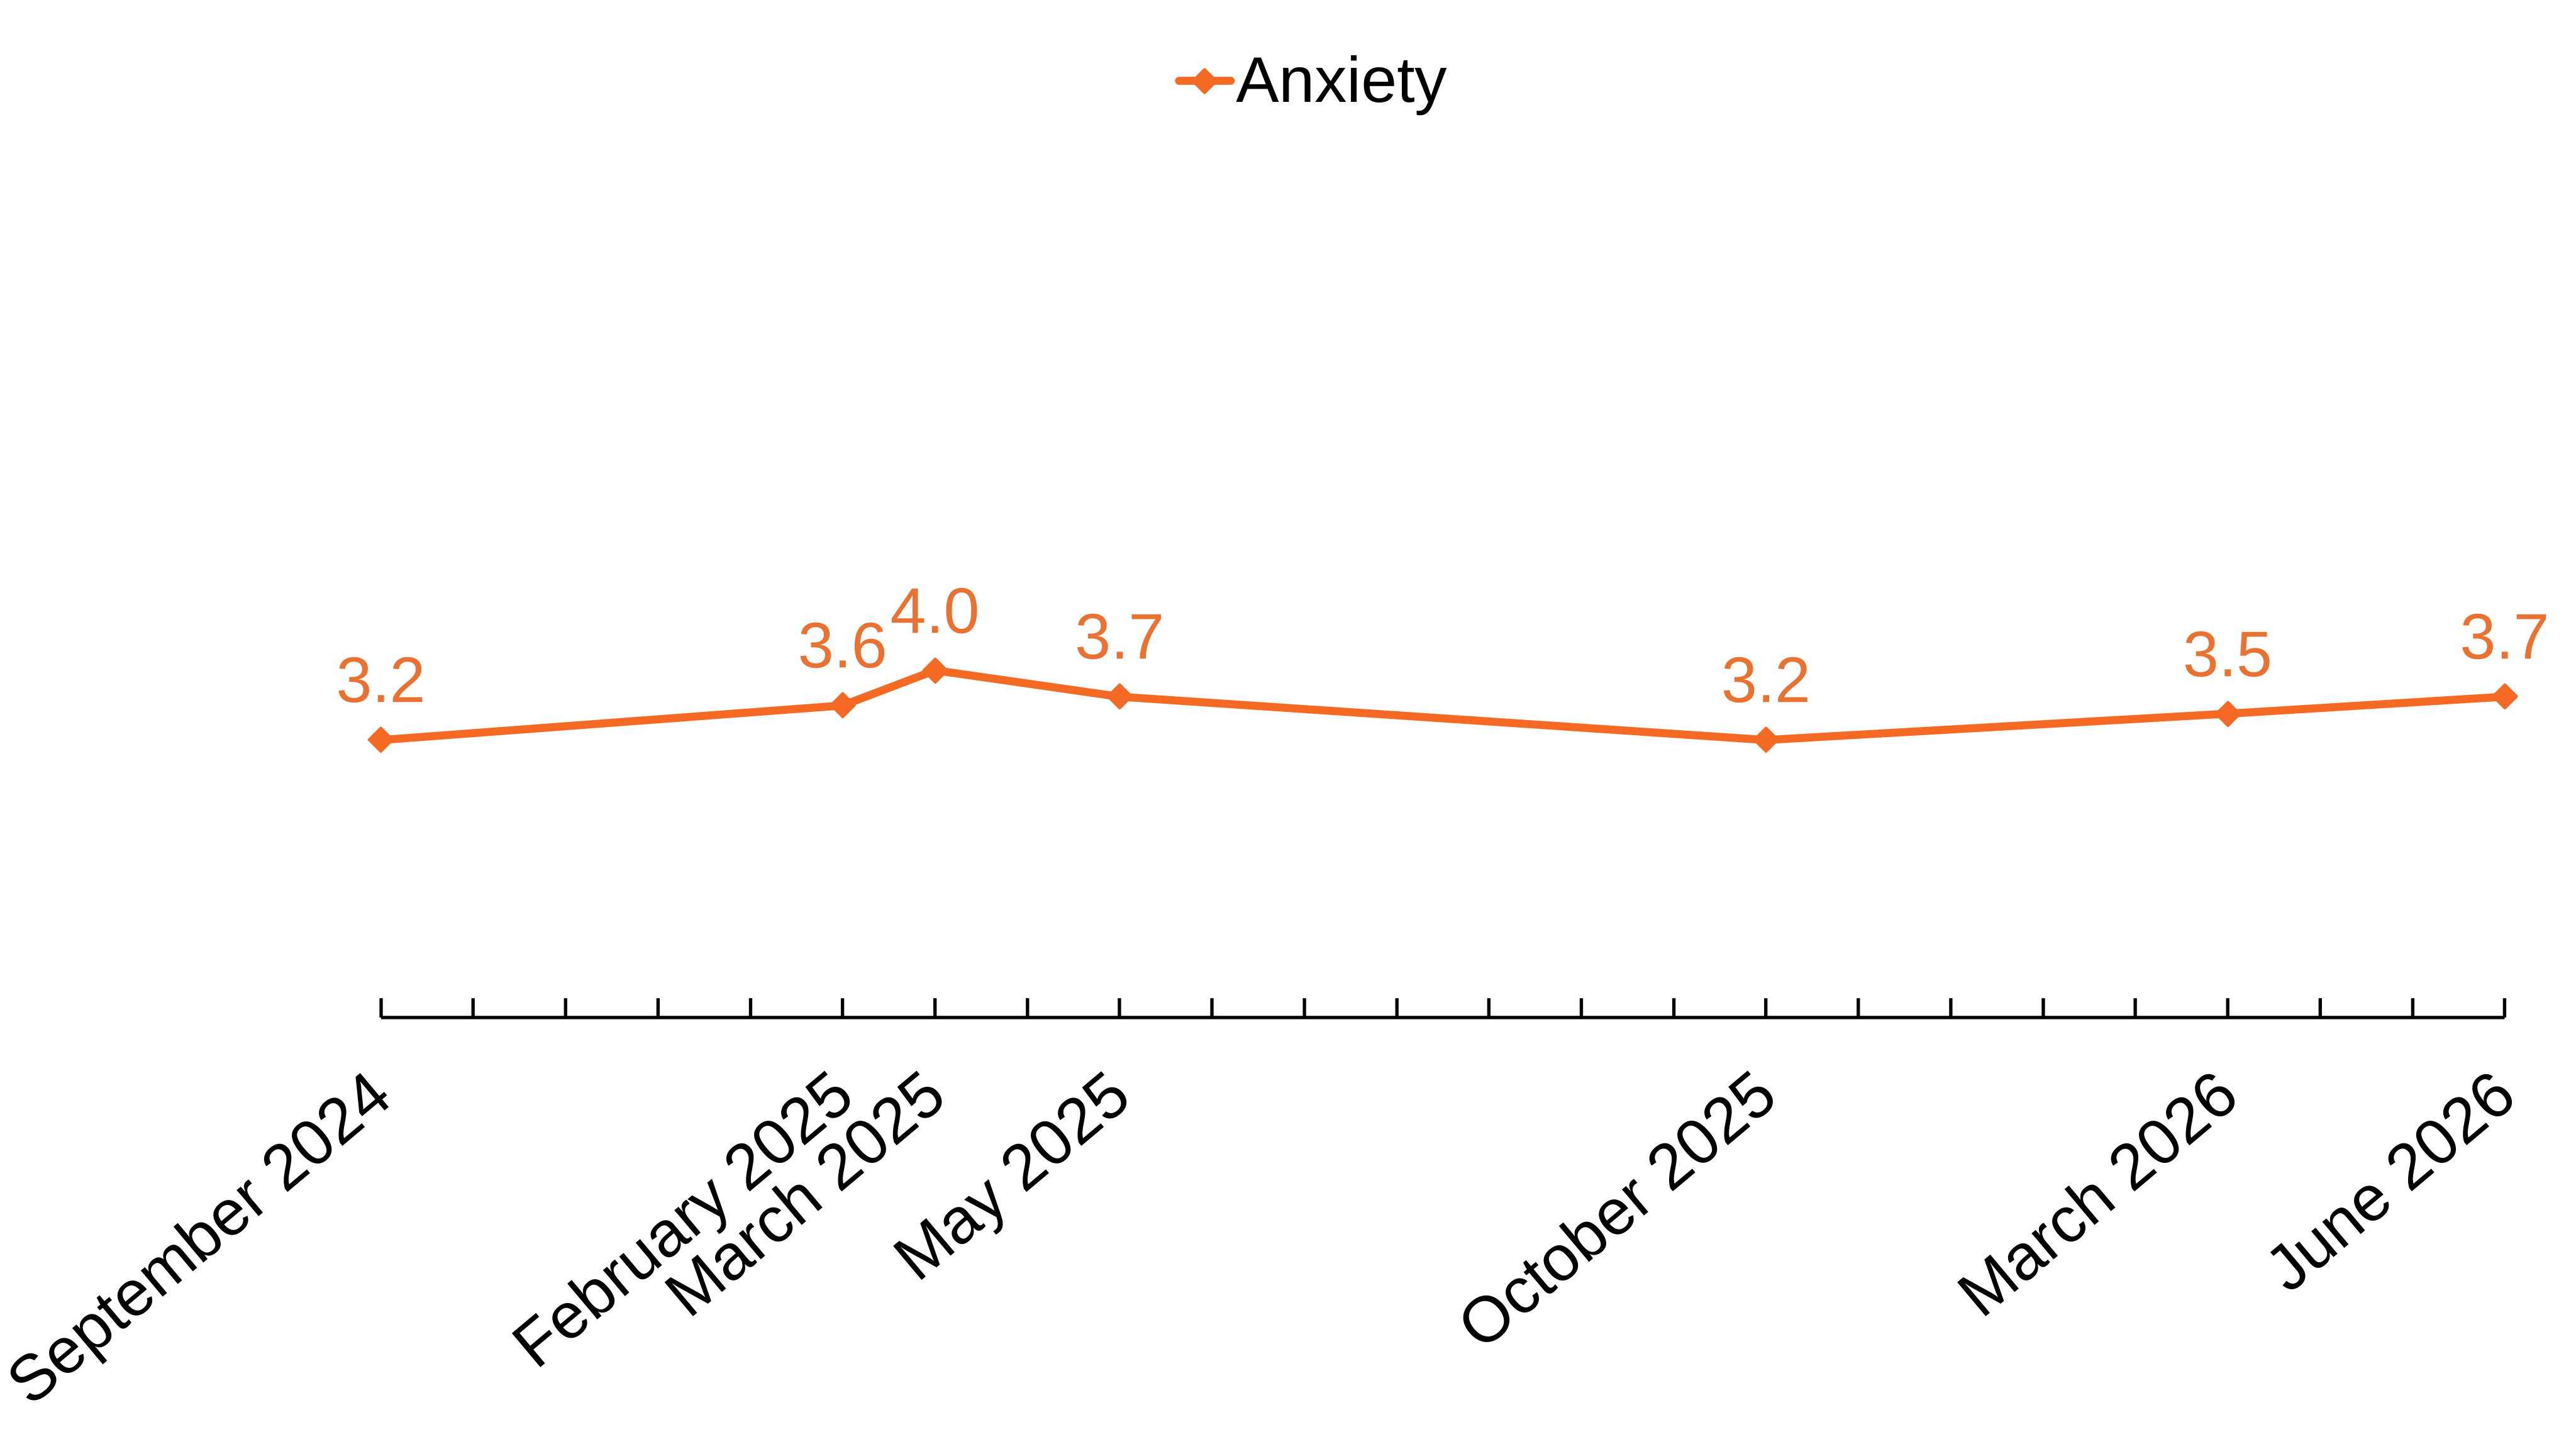
Base: Pupils in years 7 to 11 in June 2026 (n = 1565), March 2026 (n = 2323), October 2025 (n = 3531), May 2025 (n = 2592), March 2025 (n = 1493), February 2025 (n = 906) and September 2024 (n = 3402). Data table reference = “wellbeing_anxious”.
Figure 25 visualises some of the ONS wellbeing data in Figure 21. It shows average anxiety scores over time for pupils in years 7 to 11, based on data reported by the pupils themselves. The data span waves of research conducted between September 2024 and June 2026. Over this period, the mean anxiety scores ranged from a minimum of 3.2 in September 2024 and October 2025 to a maximum of 4.0 in March 2025.
ONS wellbeing measures were also asked of 16 to 19 pupils and learners in some waves, as summarised in the Figure 26.
Figure 26: 16 to 19 pupils’ and learners’ average wellbeing scores over time
| Wave | Happiness | Worthwhile | Life satisfaction | Anxiety |
|---|---|---|---|---|
| June 2026 | 7.1 | 6.7 | 6.7 | 4.1 |
| March 2026 | 6.9 | 6.7 | 6.5 | 4.0 |
| May 2025 | 6.4 | 6.4 | 6.2 | 4.6 |
| March 2025 | 6.6 | 6.6 | 6.2 | 4.2 |
Base: 16 to 19 pupils and learners in June 2026 (n = 1440), March 2026 (n = 3575), May 2025 (n = 1015) and March 2025 (n = 2497). Data table reference = “wellbeing_happy”, “wellbeing_worthwhile”, “wellbeing_satisfied” and “wellbeing_anxious”.
We also asked parents a subset of the ‘ONS4’ personal wellbeing measures, in relation to their child’s personal wellbeing. In surveys conducted across this academic year and the previous academic year, the average scores for parents’ views on their child’s personal wellbeing were:
Figure 27: Pupils’ average wellbeing scores over time, as reported by parents
| Wave | Happiness | Anxiety |
|---|---|---|
| June 2026 | 7.9 | 2.7 |
| March 2026 | 7.9 | 2.8 |
| October 2025 | 8.2 | 2.5 |
| May 2025 | 8.2 | 2.6 |
| March 2025 | 7.8 | 2.8 |
| February 2025 | 8.1 | 2.4 |
| September 2024 | 8.2 | 2.5 |
Base: All parents in June 2026 (n = 2392), March 2026 (n = 3208), October 2025 (n = 4153), May 2025 (n = 3423), March 2025 (n = 2347), February 2025 (n = 808) and September 2024 (n = 4167). Data table reference = “wellbeing_happy” and “wellbeing_anxious”.
Figure 28: Pupils’ average happiness scores over time, as reported by parents
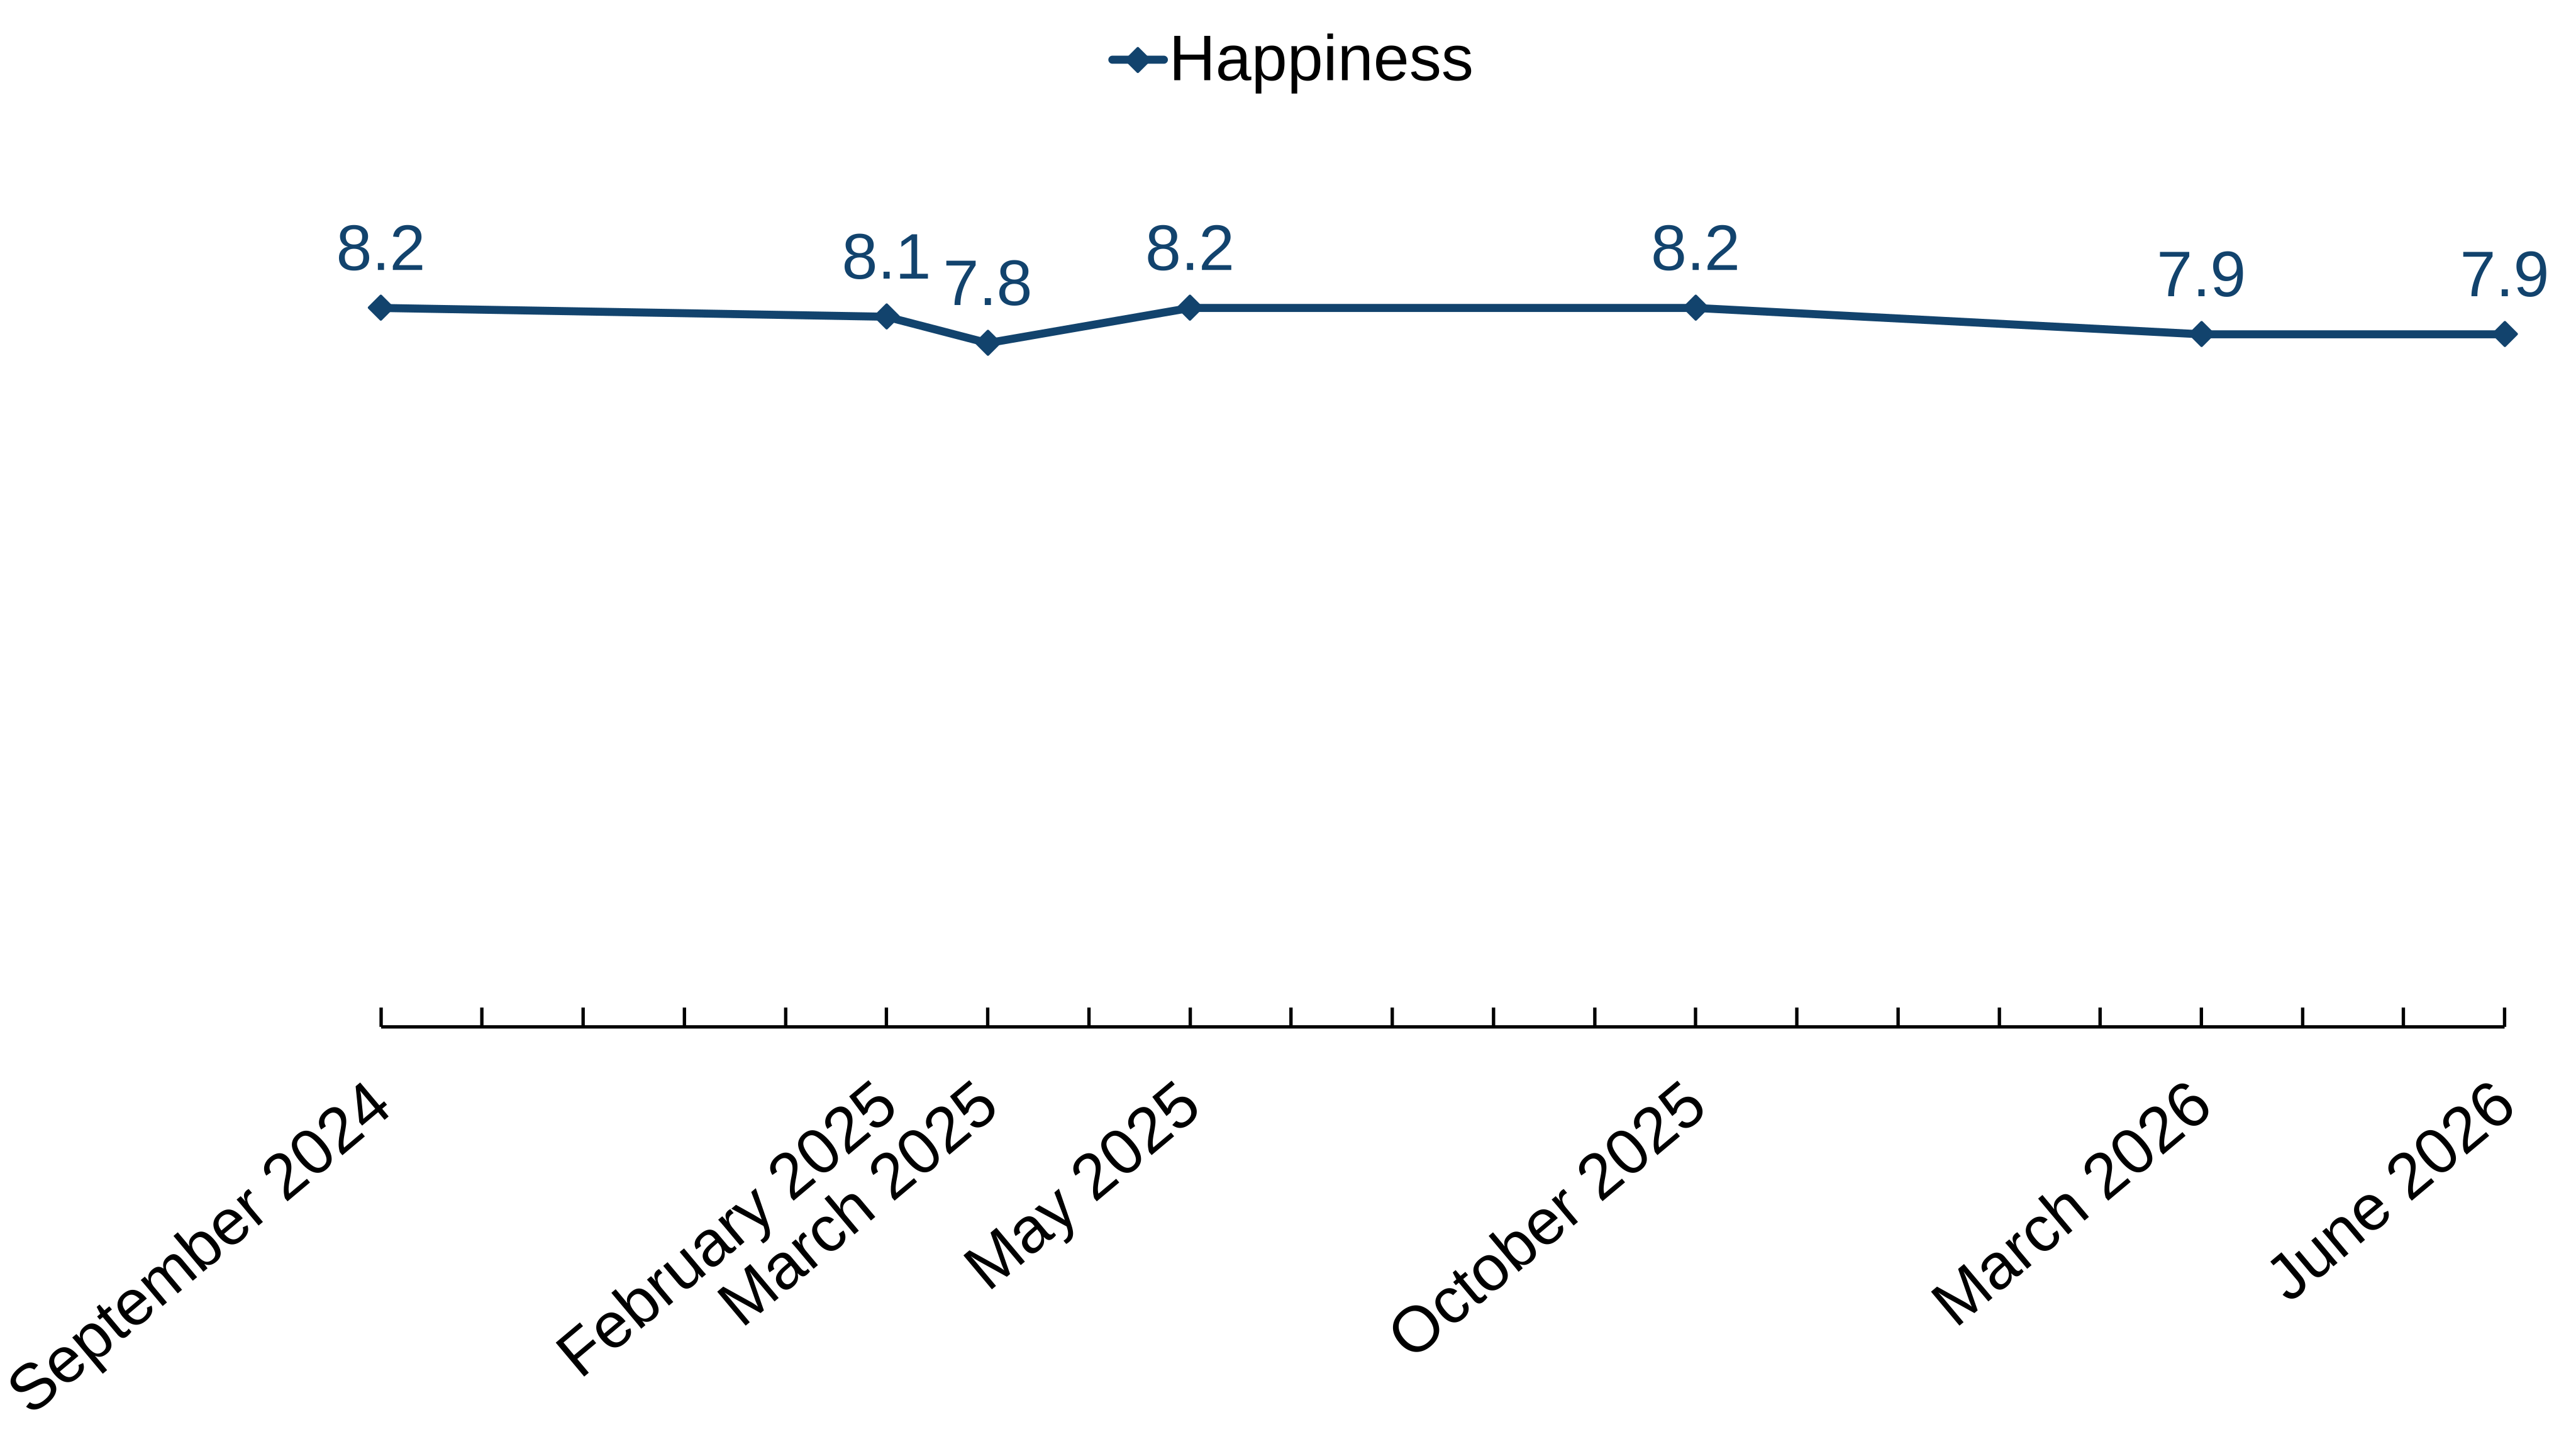
Base: All parents in June 2026 (n = 2392), March 2026 (n = 3208), October 2025 (n = 4153), May 2025 (n = 3423), March 2025 (n = 2347), February 2025 (n = 808) and September 2024 (n = 4167). Data table reference = “wellbeing_happy”.
Figure 28 visualises some of the ONS wellbeing data in Figure 27. It shows average happiness scores over time for pupils, based on data reported by their parents. The data span waves of research conducted between September 2024 and June 2026. Over this period, the mean happiness scores ranged from a minimum of 7.8 in March 2025 to a maximum of 8.2 in September 2024, May 2025 and October 2025.
Figure 29: Pupils’ average anxiety scores over time, as reported by parents
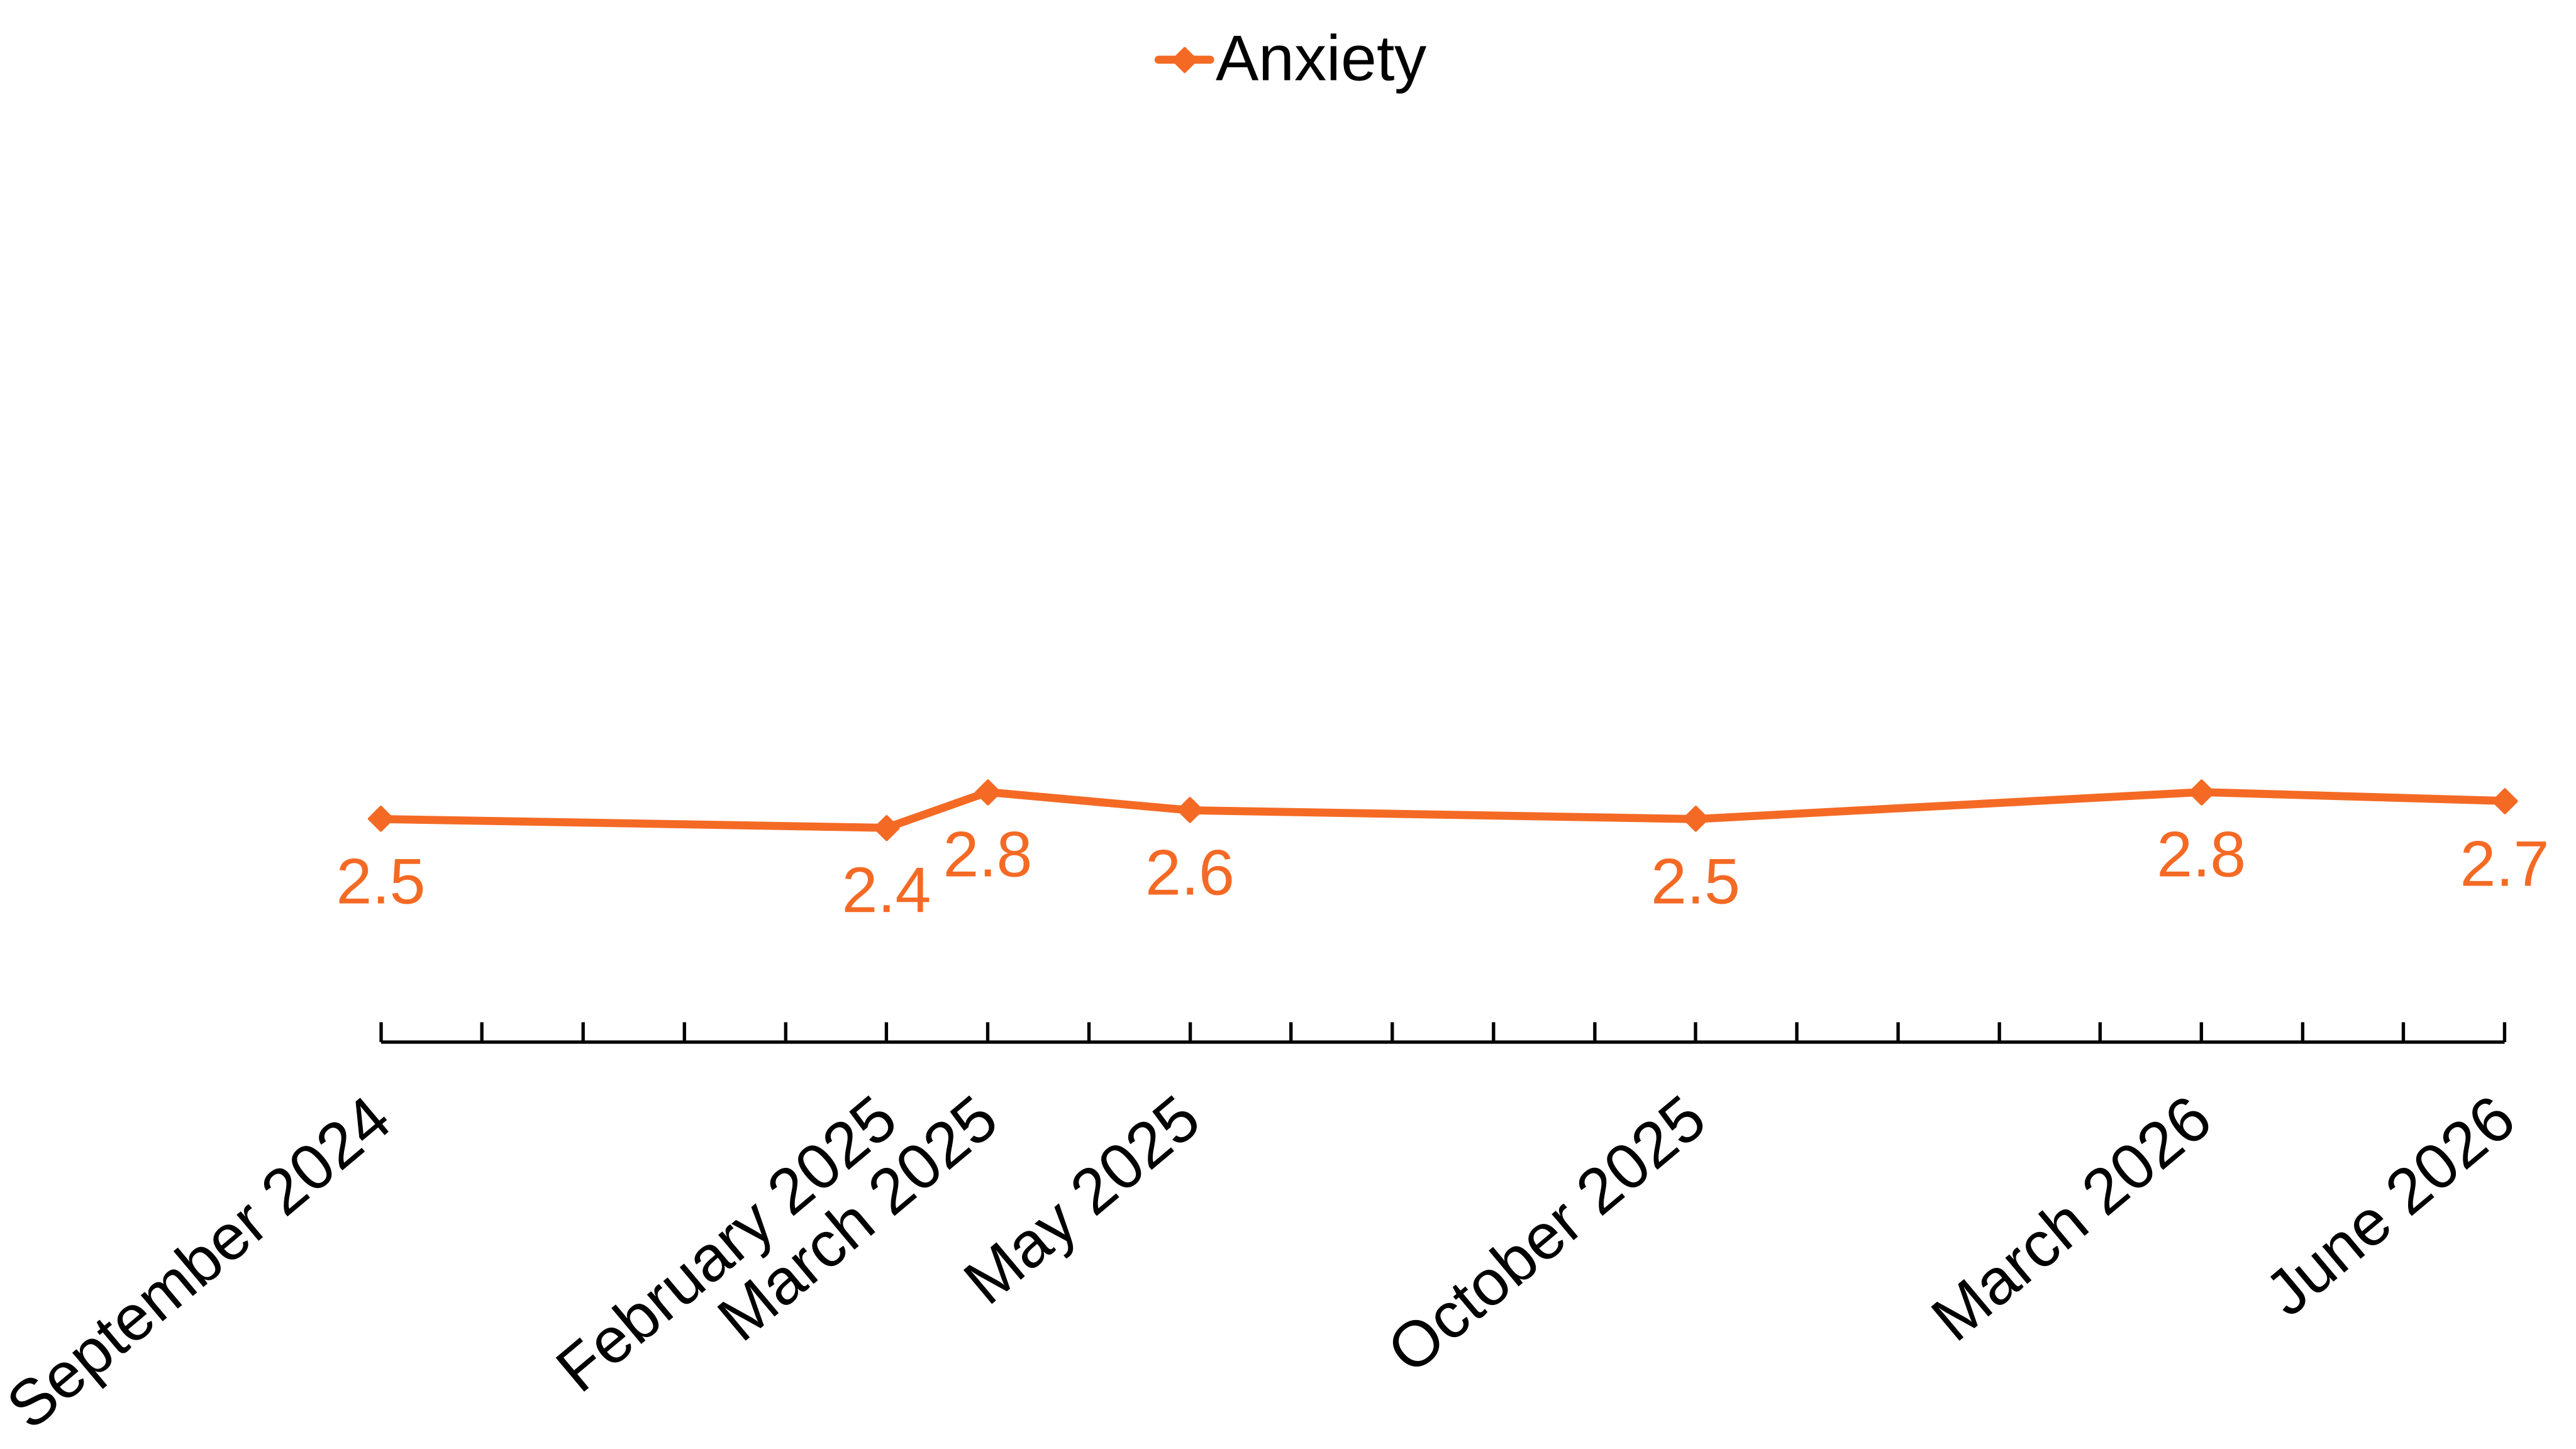
Base: All parents in June 2026 (n = 2392), March 2026 (n = 3208), October 2025 (n = 4153), May 2025 (n = 3423), March 2025 (n = 2347), February 2025 (n = 808) and September 2024 (n = 4167). Data table reference = “wellbeing_anxious”.
Figure 29 visualises some of the ONS wellbeing data in Figure 27. It shows average anxiety scores over time for pupils, based on data reported by their parents. The data span waves of research conducted between September 2024 and June 2026. Over this period, the mean anxiety scores ranged from a minimum of 2.4 in February 2025 to a maximum of 2.8 in March 2025 and March 2026.
Figure 30: Pupils’ average wellbeing scores, as reported by parents
| Wave | Happiness | Anxiety |
|---|---|---|
| Primary parents | 8.1 | 2.5 |
| Secondary parents | 7.6 | 2.9 |
| Special school | 7.7 | 3.5 |
Base: All primary parents (n = 858), secondary parents (n = 1040) and special school parents (494). Data table reference = “wellbeing_happy” and “wellbeing_anxious”.
We also asked pupils how often they felt lonely. Data for key stage 3 pupils, key stage 4 pupils and 16 to 19 pupils and learners are shown in separate figures.
Levels of loneliness among key stage 3 pupils in surveys conducted across this academic year and the previous academic year were:
Figure 31: How often key stage 3 pupils felt lonely
| Wave | Hardly ever or never | Some of the time | Often | Prefer not to say | Total |
|---|---|---|---|---|---|
| June 2026 | 50% | 36% | 10% | 4% | 100% |
| March 2026 | 51% | 35% | 9% | 5% | 100% |
| October 2025 | 54% | 33% | 9% | 3% | 100% |
| May 2025 | 49% | 36% | 12% | 3% | 100% |
| September 2024 | 50% | 37% | 10% | 3% | 100% |
Base: Key stage 3 pupils in June 2026 (n = 883), March 2026 (n = 1319), October 2025 (n = 1980), May 2025 (n = 1481), February 2025 (n = 524) and September 2024 (n = 1989). Data table reference = “wellbeing_lonely”.
Levels of loneliness among key stage 4 pupils in surveys conducted across this academic year and the previous academic year were:
Figure 32: How often key stage 4 pupils felt lonely
| Wave | Hardly ever or never | Some of the time | Often | Prefer not to say | Total |
|---|---|---|---|---|---|
| June 2026 | 33% | 41% | 23% | 4% | 100% |
| March 2026 | 39% | 45% | 14% | 3% | 100% |
| October 2025 | 40% | 44% | 13% | 3% | 100% |
| May 2025 | 38% | 38% | 19% | 4% | 100% |
| September 2024 | 39% | 43% | 15% | 4% | 100% |
Base: Key stage 4 pupils in June 2026 (n = 682), March 2026 (n = 1004), October 2025 (n = 1551), May 2025 (n = 1111), February 2025 (n = 382) and September 2024 (n = 1413). Data table reference = “wellbeing_lonely”.
The proportion of key stage 4 pupils who said that they often felt lonely was higher in June 2026 (23%) than in March 2026 (14%).
Levels of loneliness among pupils aged 16 to 19 in surveys conducted across this academic year and the previous academic year were:
Figure 33: How often 16 to 19 pupils and learners felt lonely
| Wave | Hardly ever or never | Some of the time | Often | Prefer not to say | Total |
|---|---|---|---|---|---|
| June 2026 | 28% | 47% | 19% | 5% | 100% |
| March 2026 | 31% | 47% | 17% | 5% | 100% |
| May 2025 | 28% | 46% | 22% | 4% | 100% |
| March 2025 | 29% | 45% | 21% | 5% | 100% |
Base: 16 to 19 pupils and learners in June 2026 (n = 1440), March 2026 (n = 3575), May 2025 (n = 1015) and March 2025 (n = 2497). Data table reference = “wellbeing_lonely”.
We asked school pupils in years 7 to 13 what, if anything, had made them feel worried, anxious or depressed in the last two weeks. They were shown a list of potential causes and asked to select all that applied.
Figure 34: Reasons pupils felt worried, anxious or depressed in the past two weeks
| Response | Key stage 3 | Key stage 4 | 16 to 19 pupils |
|---|---|---|---|
| Concerns about school work | 31% | 33% | 42% |
| The news and global issues | 14% | 20% | 25% |
| Issues with teachers or staff at school | 14% | 7% | 4% |
| Other young people showing negative or hateful attitudes towards women and girls | 10% | 10% | 12% |
| Bullying, violence or feeling unsafe (in your school or local area) | 14% | 7% | 3% |
| Problems at home | 10% | 8% | 15% |
| Social media | 4% | 10% | 11% |
| Nothing | 35% | 24% | 22% |
| Other | 14% | 23% | 19% |
| Prefer not to say | 7% | 10% | 7% |
Base: Key stage 3 pupils (n = 883), key stage 4 pupils (n = 682) and 16 to 19 pupils (n = 707). Data table reference = “wellbeing_mentalhealth”.
We asked pupils who said that social media had made them feel worried, anxious or depressed what it was about social media that made them feel that way. They were shown a list of potential reasons and asked to select all that applied.
Figure 35: Reasons why social media had made pupils feel worried, anxious or depressed
| Response | Pupils |
|---|---|
| Content on body image | 43% |
| Feeling confused about what is real or accurate online (for example, AI generated content, fake news) | 41% |
| Seeing sexist content about women and girls | 39% |
| Seeing hateful content (for example, racism or homophobia) | 33% |
| Unkind or hurtful content from my peers at school | 32% |
| Not knowing who or what to trust online (for example, scammers) | 25% |
| Seeing violent content | 22% |
| Constant notifications | 20% |
| Adverts and feeling pressure to buy things I see online | 16% |
| Strangers trying to message me | 15% |
| Content that feels inappropriate for my age | 14% |
| Feeling pressure to post or get likes or comments | 13% |
| Other | 11% |
| Prefer not to say | 4% |
Base: Pupils who said that social media had made them feel worried, anxious or depressed in the last two weeks (n = 241). Data table reference = “wellbeing_socialmedia”.
Post-16 options
We asked 16 to 19 learners in colleges whether they had heard of different post-16 options.
Figure 36: Learners’ awareness of post-16 options
| Response | 16 to 19 learners |
|---|---|
| Apprenticeships | 97% |
| A Levels | 96% |
| BTECs | 88% |
| T Levels | 81% |
Base: 16 to 19 learners (n = 733). Data table reference = “tlevelawareness_tlevels”, “tlevelawareness_apprenticeship”, “tlevelawareness_alevels”, “tlevelawareness_btecs”.
We asked 16 to 19 learners in colleges who had heard of any of the four post-16 options whether they were currently taking any of those courses.
Figure 37: Courses currently taken by 16 to 19 learners
| Response | 16 to 19 learners |
|---|---|
| BTECs | 28% |
| A Levels | 20% |
| T Levels | 9% |
| Apprenticeships | 3% |
| None of the above | 40% |
Base: 16 to 19 learners who had heard of any of the four post-16 options (n = 730). Data table reference = “tlevel_currentstudy_y12_y13”.
We asked learners in colleges who were aware of T Levels but were not taking them, whether they had considered taking T Levels. Overall, 15% of those who were aware of T Levels but not taking them said that they had considered taking T Levels.
Similarly, we asked learners in colleges who were aware of apprenticeships but were not taking them, whether they had considered taking an apprenticeship. Overall, 51% of those who were aware of apprenticeships but not taking them said that they had considered taking an apprenticeship.
We asked learners in colleges who had considered but not taken T Levels what made them decide not to take T Levels.
Figure 38: Reasons why learners considered but did not take T Levels
| Response | 16 to 19 learners |
|---|---|
| I did not know what job I wanted to do | 26% |
| I did not meet the entry requirements | 19% |
| I wanted to study several different subjects | 16% |
| Concern that the qualification wouldn’t be recognised (for example, by a University) | 11% |
| I don’t know enough about T Levels | 8% |
| Other qualifications have a better reputation | 8% |
| The course is not available in my local area | 7% |
| I was recommended against it | 7% |
| I do not need it for my future career plans | 6% |
| Concerns over industry placement | 3% |
| Other | 15% |
| Don’t know | 17% |
Base: 16 to 19 learners who had considered but not taken T Levels (n = 91). The base is lower than 100 and the data should therefore be treated with caution. Data table reference = “tlevel_whynot_y12_y13_t_levels”.
We asked learners who had considered but not taken an apprenticeship what made them decide not to take one.
Figure 39: Reasons why learners considered but did not take an apprenticeship
| Response | 16 to 19 learners |
|---|---|
| I did not know what job I wanted to do | 27% |
| There wasn’t a vacancy available related to a job in my preferred career | 25% |
| I don’t know enough about apprenticeship | 15% |
| I did not meet the entry requirements | 12% |
| Other qualifications have a better reputation | 9% |
| The course is not available in my local area | 8% |
| I wanted to study several different subjects | 5% |
| Concerns over industry placement | 5% |
| Did not want to study English or maths as part of the course | 4% |
| I was recommended against it | 3% |
| I do not need it for my future career plans | 3% |
| The pay is too low | 2% |
| Other | 15% |
| Don’t know | 16% |
Base: 16 to 19 learners who had considered but not taken an Apprenticeship (n = 315). Data table reference = “tlevel_whynot_y12_y13_apprentic”.
School belonging
We asked pupils and parents a series of questions about how they, or their child, felt about school over the previous week of term. Firstly, we asked about how often they, or their child, had enjoyed going to school over the previous week of term.
Figure 40: How often pupils enjoyed going to school during the past week, as reported by pupils and parents
| Audience | Every day | Most days | Some days | Never | Don’t know | Total |
|---|---|---|---|---|---|---|
| Key stage 3 pupils | 16% | 40% | 31% | 13% | 1% | 100% |
| Key stage 4 pupils | 14% | 35% | 36% | 13% | 2% | 100% |
| 16 to 19 pupils | 18% | 40% | 31% | 9% | 2% | 100% |
| Primary parents | 42% | 39% | 14% | 4% | 0% | 100% |
| Secondary parents | 23% | 43% | 22% | 10% | 1% | 100% |
| Special school parents | 38% | 37% | 16% | 7% | 2% | 100% |
Base: Key stage 3 pupils (n = 883), key stage 4 pupils (n = 682), 16 to 19 pupils (n = 707), primary parents (n = 858), secondary parents (n = 1040) and special school parents (n = 494). Data table reference = “belonging_enjoy”.
The proportion of key stage 3 pupils who said they had enjoyed going to school on every day or most days of the past week was lower in June 2026 (56%) than in May 2025 (61%). The proportion of key stage 4 pupils who said they had enjoyed going to school on every day or most days was also lower in June 2026 (49%) than in May 2025 (54%). Similarly, a lower proportion of 16 to 19 pupils said they had enjoyed going to school in June 2026 (58%) compared with May 2025 (64%).
Overall, 81% of primary parents, 66% of secondary parents and 75% of special school parents said their child had enjoyed going to school on every day or most days in the past week. The proportion of secondary parents who said their child had enjoyed going to school was higher in May 2025 (73%) when the question was previously asked. The proportion of primary and special school parents who said their child had enjoyed going to school in May 2025 was broadly similar to June 2026.
We also asked parents how often their child had felt safe at school during the past week of term.
Figure 41: How often pupils felt safe at school during the past week, as reported by parents
| Phase | Every day | Most days | Some days | Never | Don’t know | Total |
|---|---|---|---|---|---|---|
| Primary parents | 67% | 24% | 6% | 2% | 2% | 100% |
| Secondary parents | 51% | 34% | 9% | 3% | 3% | 100% |
| Special school parents | 54% | 27% | 9% | 4% | 6% | 100% |
Base: All primary parents (n = 858), secondary parents (n = 1040) and special school parents (n = 494). Data table reference = “behaviour_safe”.
Overall, 91% of primary school parents, 85% of secondary school parents and 81% of special school parents said their child felt safe every day or most days at school. The proportion of parents reporting that their child had felt safe at school was broadly similar in May 2025 when the question was previously asked.
We asked school pupils in years 7 to 13 how often they had felt they belonged at their school during the past week of term.
Figure 42: How often pupils felt they belonged at their school during the past week
| Key stage | Every day | Most days | Some days | Never | Don’t know | Total |
|---|---|---|---|---|---|---|
| Key stage 3 | 30% | 36% | 24% | 6% | 3% | 100% |
| Key stage 4 | 25% | 41% | 24% | 7% | 3% | 100% |
| 16 to 19 pupils | 28% | 38% | 23% | 9% | 3% | 100% |
Base: Key stage 3 pupils (n = 883), key stage 4 pupils (n = 682) and 16 to 19 pupils (n = 707). Data table reference = “belonging_belong”.
The proportion of key stage 3 pupils who said they felt that they had belonged at their school, on every day or most days of the past week, was lower in June 2026 (66%) than in May 2025 (72%). The proportion of 16 to 19 pupils who felt they had belonged at their school was also lower in June 2026 (65%) than in May 2025 (71%). The proportion of key stage 4 pupils who felt they had belonged at school was broadly unchanged from May 2025 (64%) to June 2026 (65%).
We asked pupils and learners in years 7 to 13 a series of questions about how often there was an adult at school who offered them different types of support. For each question they were asked to rate how often there was an adult who offered that type of support, using a scale from 1 to 5 where 1 was ‘never’ and 5 was ‘always’.
First, we asked how often they felt there was an adult at school or college who really cared about them.
Figure 43: How often pupils and learners felt there was an adult at school or college who really cared about them
| Key stage | 1 – Never | 2 | 3 | 4 | 5 - Always | Total |
|---|---|---|---|---|---|---|
| Key stage 3 | 6% | 11% | 26% | 32% | 24% | 100% |
| Key stage 4 | 6% | 13% | 20% | 33% | 28% | 100% |
| 16 to 19 pupils and learners | 7% | 12% | 30% | 23% | 27% | 100% |
Base: Key stage 3 pupils (n = 883), key stage 4 pupils (n = 682) and 16 to 19 pupils and learners (n = 1440). Data table reference = “belonging_care”.
When asked how often they felt there was an adult at school or college who really cared for them, the proportion of key stage 4 pupils that gave a score of 4 or 5 was higher in June 2026 (61%) than in May 2025 (55%) when the question was previously asked. The equivalent proportion among 16 to 19 pupils was lower in June 2026 (51%) than in May 2025 (58%). Among key stage 3 pupils the proportion that gave a score of 4 or 5 was broadly similar in June 2026 (56%) and May 2025 (59%).
We also asked how often they felt there was an adult at school or college who told them when they did a good job.
Figure 44: How often pupils and learners felt there was an adult at school or college who told them when they did a good job
| Key stage | 1 – Never | 2 | 3 | 4 | 5 - Always | Total |
|---|---|---|---|---|---|---|
| Key stage 3 | 7% | 11% | 26% | 31% | 26% | 100% |
| Key stage 4 | 7% | 12% | 29% | 33% | 20% | 100% |
| 16 to 19 pupils and learners | 6% | 11% | 25% | 31% | 26% | 100% |
Base: Key stage 3 pupils (n = 883), key stage 4 pupils (n = 682) and 16 to 19 pupils and learners (n = 1440). Data table reference = “belonging_praise”.
When asked how often they felt there was an adult at school or college who told them when they did a good job, the proportion of key stage 3 pupils that gave a score of 4 or 5 was lower in June 2026 (57%) than in May 2025 (62%). The equivalent proportion among key stage 4 pupils was broadly stable between May 2025 (54%) and June 2026 (52%), as was the proportion among 16 to 19 pupils and learners (60% in May 2025 compared with 57% in June 2026).
We also asked how often they felt there was an adult at school or college who listened to them when they had something to say.
Figure 45: How often pupils and learners felt there was an adult at school or college who listened to them when they had something to say
| Key stage | 1 – Never | 2 | 3 | 4 | 5 - Always | Total |
|---|---|---|---|---|---|---|
| Key stage 3 | 5% | 10% | 27% | 33% | 25% | 100% |
| Key stage 4 | 4% | 9% | 24% | 31% | 31% | 100% |
| 16 to 19 pupils and learners | 4% | 7% | 24% | 30% | 35% | 100% |
Base: Key stage 3 pupils (n = 883), key stage 4 pupils (n = 682) and 16 to 19 pupils and learners (n = 1440). Data table reference = “belonging_listen”.
When asked how often they felt there was an adult at school or college who listened to them when they had something to say, 58% of key stage 3 pupils, 62% of key stage 4 pupils and 65% of 16 to 19 pupils and learners gave a score of 4 or 5. These figures were broadly stable compared with May 2025 when the question was previously asked.
Finally, we asked how often they felt there was an adult at school or college who believed they would be a success.
Figure 46: How often pupils and learners felt there was an adult at school or college who believed they would be a success
| Key stage | 1 – Never | 2 | 3 | 4 | 5 - Always | Total |
|---|---|---|---|---|---|---|
| Key stage 3 | 6% | 10% | 23% | 31% | 31% | 100% |
| Key stage 4 | 5% | 9% | 21% | 33% | 32% | 100% |
| 16 to 19 pupils and learners | 5% | 8% | 26% | 24% | 36% | 100% |
Base: Key stage 3 pupils (n = 883), key stage 4 pupils (n = 682) and 16 to 19 pupils and learners (n = 1440). Data table reference = “belonging_success”.
When asked how often they felt there was an adult at school or college who believed they would be a success, 62% of key stage 3 pupils, 65% of key stage 4 pupils and 60% of 16 to 19 pupils and learners gave a score of 4 or 5. These figures were broadly stable compared with May 2025 when the question was previously asked.
Glossary of terms
Individualised learner record (ILR)
The primary data collection about further education and work-based learning in England. It is requested from learning providers in England’s further education system.
National Pupil Database (NPD)
A register data set of all pupils in state schools in England, compiled by DfE. It contains attainment data as children progress through school, as well as information on pupil background, absences and exclusions from school.
Special educational needs and disability (SEND)
A child or young person has SEND if they have a learning difficulty or disability which calls for special educational provision to be made for them. A child of compulsory school age or a young person has a learning difficulty or disability if they have a:
- significantly greater difficulty in learning than the majority of others of the same age
- disability that prevents or hinders them from making use of facilities of a kind generally provided for others of the same age in mainstream schools or mainstream post-16 institutions
Some children and young people who have SEND may also have a disability under the Equality Act 2010 – that is ‘… a physical or mental impairment which has a long-term and substantial adverse effect on their ability to carry out normal day-to-day activities’. Where a disabled child or young person requires special educational provision, they will also be covered by the SEND definition.
Special schools
Schools that provide an education for children with a special educational need or disability. Almost all pupils in special schools have an education, health and care plan (EHCP), which are plans for children and young people aged up to 25 who need more support than is available through special educational needs support. EHC plans identify educational, health and social needs and set out the additional support to meet those needs.