Palliative and end of life care: hospital deaths 2006 to 2017
Published 12 August 2019

© Crown copyright 2019
This publication is licensed under the terms of the Open Government Licence v3.0 except where otherwise stated. To view this licence, visit nationalarchives.gov.uk/doc/open-government-licence/version/3 or write to the Information Policy Team, The National Archives, Kew, London TW9 4DU, or email: psi@nationalarchives.gov.uk.
Where we have identified any third party copyright information you will need to obtain permission from the copyright holders concerned.
This publication is available at https://www.gov.uk/government/publications/palliative-and-end-of-life-care-hospital-deaths-2006-to-2017/palliative-and-end-of-life-care-hospital-deaths-2006-to-2017
1. Introduction
Approximately half a million people die in England each year. The total number of deaths in England has increased over the last 10 years, yet the number and proportion of hospital deaths have decreased.
It is recognised that, for some people, hospital is the correct place for care, especially those who have an uncertain prognosis or difficult to manage symptoms.
The population is increasing and the number of deaths is projected to increase by roughly 25% between 2017 and 2040. This has important implications for the provision of end of life care. The NHS Long Term Plan recognises the importance of end of life care and has introduced a number of initiatives to improve the availability and quality of end of life care services.
This report is part of a series presenting significant statistics about palliative and end of life care in England. This considers differences across causes of death, age group and geographical location.
2. Main findings
Principle findings in this report:
- the overall proportion of hospital deaths steadily decreased between 2006 and 2017
- those aged 85 years and older had the lowest proportion of hospital deaths after 2013
- the degree of variation in the proportion of hospital deaths across Clinical Commissioning Groups (CCGs) decreased between 2006 and 2017
- for each cause of death group, with the exception of pneumonia, the proportion of hospital deaths decreased between 2006 and 2017
- for each cause of death group, with the exception of COPD and dementia, the number of deaths in hospital fell between 2006 and 2017
3. Overview
In 2017, there were 495,088 adult deaths, compared to 465,367 in 2006. The number of deaths occurring in hospital settings is decreasing, despite the total number of deaths increasing over time. The proportion of adult deaths that occurred in hospital has decreased from 56.9% in 2006 to 45.9% in 2017. The number of deaths in hospital decreased from 264,566 to 227,272 for this same time period.
Table 1: Overall mortality statistics including the proportion of people who die in hospital, who are female and who live in the most deprived deciles in England by year and age group, 2006 and 2017
| Age | Proportion of deaths in hospital (2006) | Proportion of deaths who are female (2006) | Proportion of all deaths in that year (2006) | Proportion of deaths from the most deprived decile (2006) | Total number of deaths (2006) | Proportion of deaths in hospital (2017) | Proportion of deaths who are female (2017) | Proportion of all deaths in that year (2017) | Proportion of deaths from the most deprived decile (2017) | Total number of deaths (2017) |
|---|---|---|---|---|---|---|---|---|---|---|
| 18-64 | 51.6 | 38.5 | 16.5 | 15.8 | 76,989 | 43.9 | 39.3 | 14.4 | 16.8 | 71,412 |
| 65-74 | 58 | 41.4 | 16.7 | 13.6 | 77,762 | 48.7 | 41.5 | 16.6 | 12.3 | 82,056 |
| 75-84 | 60.8 | 49.8 | 32.8 | 11.1 | 152,676 | 49.7 | 46.9 | 28.3 | 10 | 140,168 |
| 85+ | 55.1 | 66.5 | 33.9 | 8.4 | 157,940 | 42.8 | 61.5 | 40.7 | 7.4 | 201,452 |
| Adult Total | 56.9 | 52.2 | 100 | 11.4 | 465,367 | 45.9 | 50.9 | 100 | 10.3 | 495,088 |
Table 1 displays a number of differences between 2006 and 2017 across age groups. The oldest age group (85 years or older) included the highest proportion of females (66.5% in 2006 and 61.5% in 2017). The younger adult age group (18 to 64) included the highest proportion of people from the most deprived communities (defined using the index of multiple deprivation deciles).
The proportion of people who died that were aged 75 years and older remained static between 2006 and 2017 (66.7% to 69%). However, within this group, the number aged 85 years and older has increased while those aged between 75 and 84 years has decreased. People aged 85 years and over account for the largest number of deaths in both 2006 and 2017 with 157,940 and 201,452 deaths respectively. This age group accounted for an increasing number and proportion of total deaths over time, accounting for 33.9% of total deaths in 2006 compared to 40.7% in 2017.
Figure 1: The percentage of deaths occurring in a hospital by age, 2006 to 2017
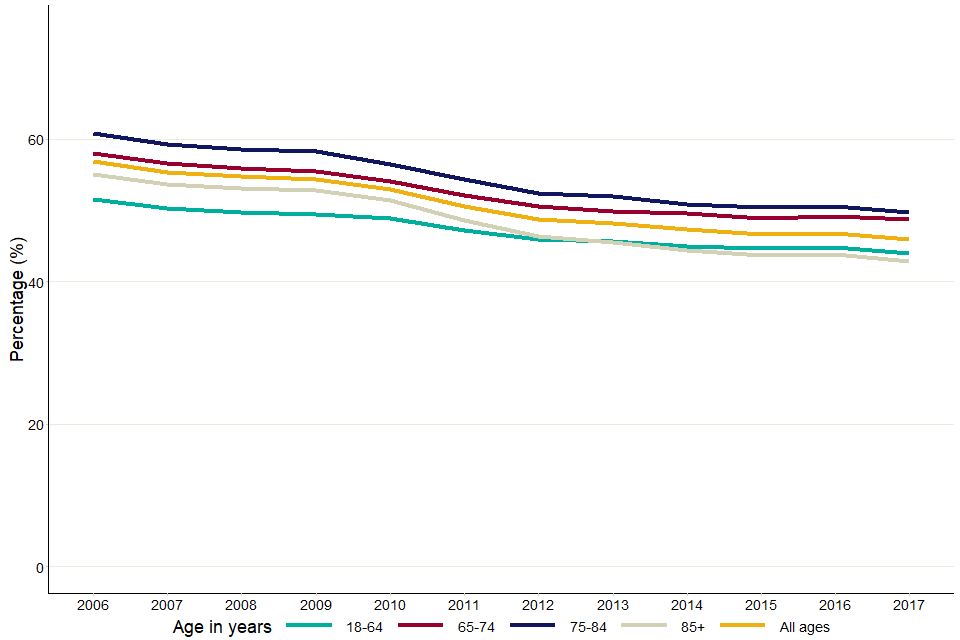
Figure 1 is a line graph with calendar years from 2006 to 2017. There are five trend lines plotted on the graph which follow the proportion of hospital deaths across four different age groups and a final one for all ages combined.
Figure 1 shows the decreasing proportion of hospital deaths across all age groups in England. The ‘85 and older’ age group has seen a large proportional decrease in hospital deaths from 2009 onwards from 52.8% to 42.8% and, since 2013, the lowest proportion of hospital deaths despite having the highest total number of deaths.
4. Variation in hospital deaths across CCGs
CCGs are clinically led statutory NHS bodies which are responsible for the planning and commissioning of health care services for their local area. CCGs commission most of the hospital and community NHS services in the local areas for which they are responsible. Examining variance across CCGs helps to understand whether mortality (and subsequently hospital-based mortality) differs over geographical location.
In England, 45.6% of adults aged 75 years and older died in a hospital in 2017. There was variation across CCGs, ranging from 27.6% to 75.9% in 2006 and 34.5% to 62.9% in 2017. 57.9% of those who died in hospital were 85 years and older in 2017, and this varied across CCGs from 30.4% to 60.3%. The proportion of people in this age group dying in hospital has decreased from 55.1% to 43.7% between 2006 and 2017, illustrated in Figure 1.
Figure 2: Variation in proportion of hospital deaths in CCGs by age group, 2006 to 2017
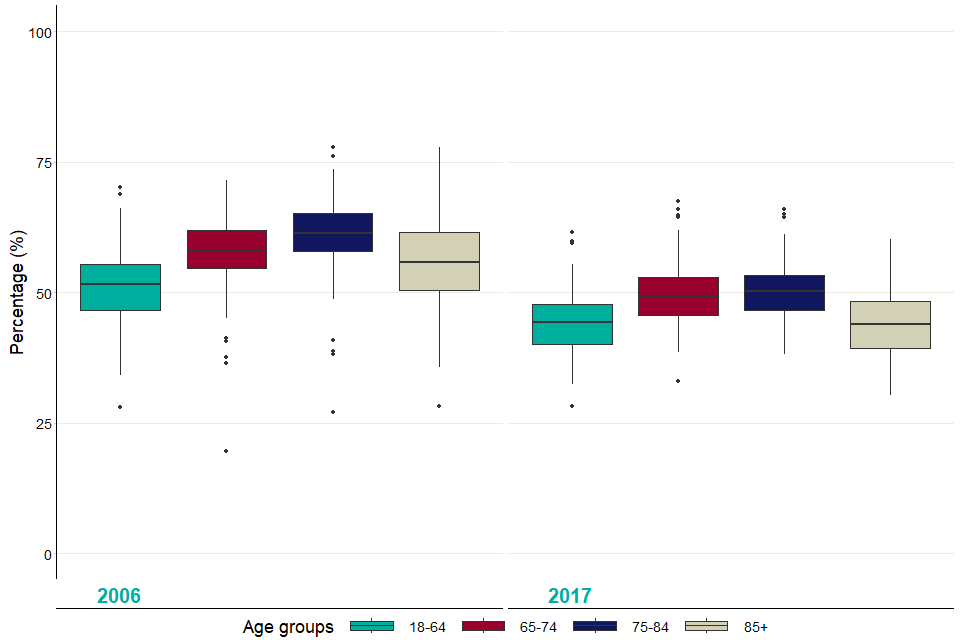
Figure 2 displays the proportion of all adults who died in hospital for each CCG for 2006 and 2017. This series of boxplots extend to the lowest/highest value of no more 1.5 times the interquartile range, outlier CCGs fall outside of these ranges.
Figure 2 is a box plot displaying the medians, outliers and interquartile ranges (IQR) for the proportion of all adults who died in hospital for each CCG for 2006 and 2017.
The length of the ‘whiskers’ on this series of box plots extend to the lowest or highest value of no more 1.5 times the interquartile range. Outlier CCGs fall outside of these ranges. This graphic shows that, collectively, CCGs are seeing a decrease in those dying in hospitals, particularly in the ‘85 and older’ age group (median proportion decreased from 55.9% to 43.9%).
There is a general narrowing of the IQR between these 2 years, suggesting the amount of variation in each age group is decreasing, particularly in the 85 and older age group, where the IQR fell from 11 to 8.9. This information is displayed in the following table.
Table 2: The median, minimum, maximum and interquartile ranges of the proportion of hospitals deaths for CCGs in England, 2006 and 2017
| Year | Age group (years) | Median proportion of hospital deaths of CCGs | Lowest proportion of hospital deaths (CCG) | Highest proportion of hospital deaths (CCG) | Interquartile Range (IQR) |
|---|---|---|---|---|---|
| 2006 | 18-64 | 51.5 | 28.0 | 70.2 | 8.6 |
| 2006 | 65-74 | 57.9 | 19.6 | 71.5 | 7.2 |
| 2006 | 75-84 | 61.3 | 27.0 | 77.8 | 7.2 |
| 2006 | 85+ | 55.9 | 28.2 | 77.8 | 11.0 |
| 2017 | 18-64 | 44.4 | 28.3 | 61.5 | 7.6 |
| 2017 | 65-74 | 49.0 | 32.9 | 67.4 | 7.3 |
| 2017 | 75-84 | 50.2 | 38.1 | 65.9 | 6.7 |
| 2017 | 85+ | 43.9 | 30.4 | 60.3 | 8.9 |
5. Variation in hospital deaths by cause of death
Cause of death is an important factor in determining where an individual dies, and the care that they require before death. Detailed values used in this section can be found in the supporting data file accompanying this report.
ICD (International Classification of Diseases) is the foundation for the identification of health trends and statistics globally, and the international standard for reporting diseases and health conditions.
These are the specific ICD-10 categories used to classify the following cause of death for this analysis (number of total deaths in 2017 in brackets):
- cancer (136,702): C00-C97
- dementia (92,688): F00-F04, G30-G31
- acute heart disease (AHD) (62,825): I20-I25, I39, I40-I41, I46-I49, I51
- chronic obstructive pulmonary disorder (COPD) (54,483): J40-J44
- pneumonia (24,976): J12-J18
- stroke (29,674): I60-I69
- chronic heart disease (CHD) (17,814): I05-I11, I13, I31, I34-I36, I38, I42, I50, I70, I95
- liver disease (12,604): B15-19, K70-77, C22
These categories are the most common causes of death in England in adults. Deaths in the dementia and COPD categories were counted if these conditions were recorded as underlying or contributory causes of death.
Deaths were counted in the pneumonia, cancer, chronic heart disease, acute heart disease, stroke and liver disease if these conditions were recorded as underlying cause of death. For this reason, some deaths may fall into multiple categories (for example, if a person’s underlying cause of death was cancer, but dementia was also a contributory cause of death).
Deaths from ‘other’ causes are deaths which did not fall into any other category. Liver cancer (ICD code C22) is counted in both the liver disease and the cancer categories.
These categories have been applied to figures 3 to 6.
Figure 3: Proportion of deaths in hospital for each age group and cause of death category, 2017
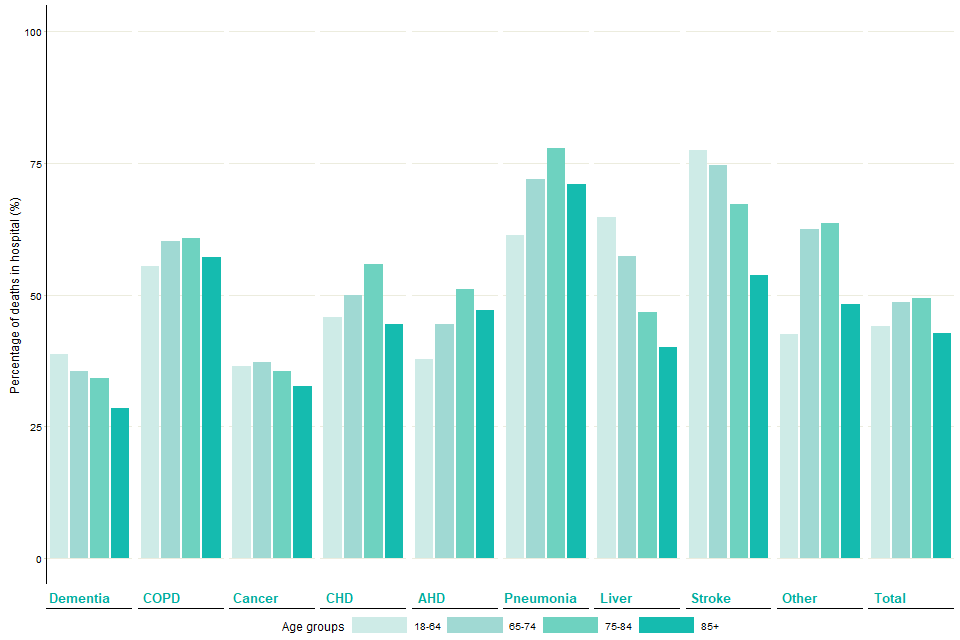
Figure 3 shows how the proportion of hospital deaths in different age groups within cause of death group. The age groups are grouped by cause of death groups, each cause of death group having four age group bars.
Figure 3 shows how the proportion of hospital deaths in different age groups within cause of death categories, differs. COPD and pneumonia show slight variation across age groups but liver disease and stroke show large variation. Chronic heart disease, acute heart disease, pneumonia and COPD are linked to a larger proportion of hospital deaths in older age groups, whereas liver disease, stroke and dementia follow an opposite trend.
Figure 4: Numbers of deaths by cause of death and place of death, 2017
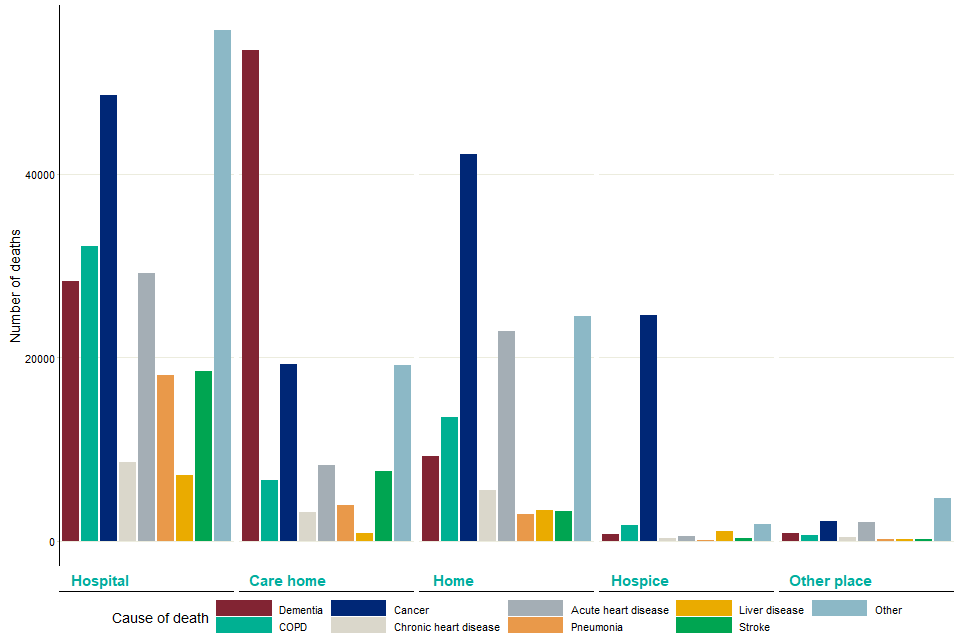
Figure 4 is a bar graph with number of deaths in 2017 along the vertical axis. Along the horizontal axis deaths are grouped primarily by place of death, and for each place of death there is a bar for each cause of death.
The distribution of cause of death varied between place of death as seen in Figure 4, which examines the totals of different causes of death by place of death. Hospitals see a high number of deaths related to cancer, pneumonia and other causes. Care homes had a higher number of deaths related to dementia, while hospices and home settings had a high number of cancer-related deaths.
Figure 5: Trend in proportion of deaths occurring in hospital by cause of death, 2006 to 2017
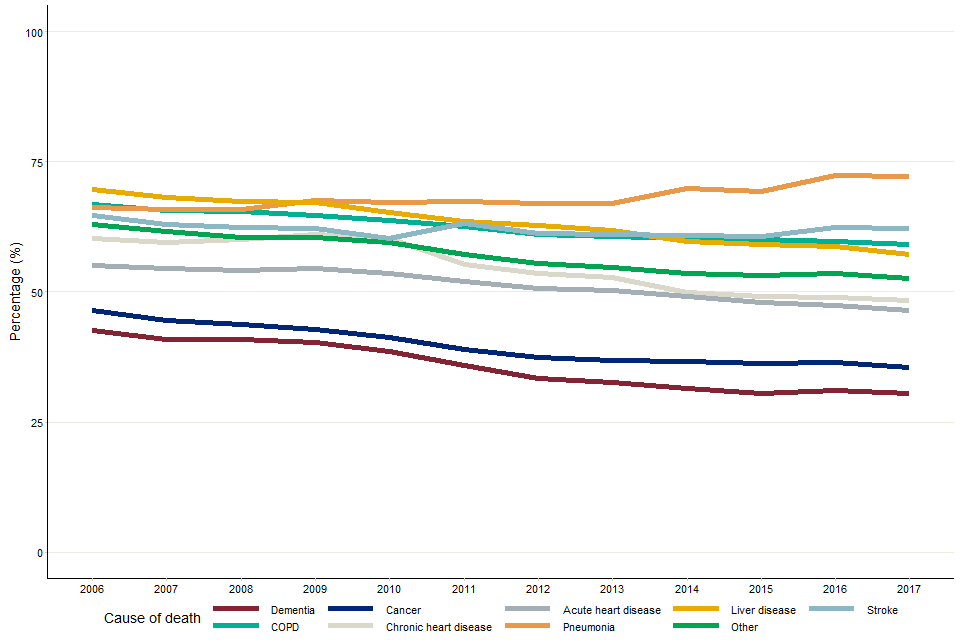
Figure 5 is a line graph with percentage of hospital deaths on vertical axis, and the calendar year 2006 to 2017 along the horizontal axis. The lines plotted correspond to different cause of death groups.
The proportion of people dying in hospital has decreased for all causes of death since 2006, with the exception of pneumonia.
Figure 6: The total number of deaths by cause of death, including number of hospital deaths as a proportion of total deaths, 2006 to 2017
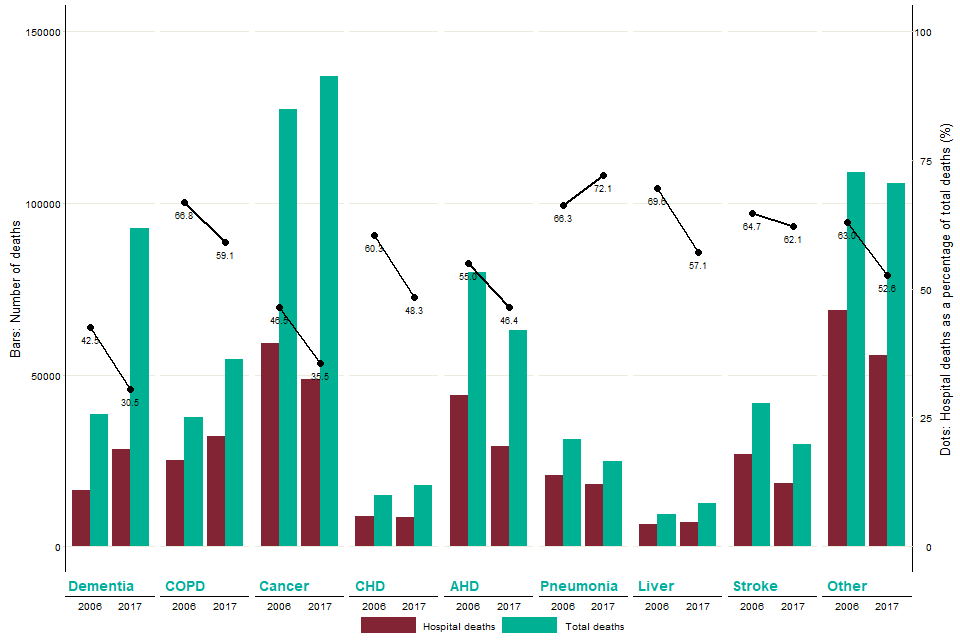
Figure 6 relates to the number of hospital deaths and the number of total adult deaths. The graph also contains dots and lines, which relate to the proportion of hospital deaths of all adult deaths in that specific year.
Figure 6 displays various key parameters related to hospital deaths in England, comparing data from 2006 and 2017 for each cause of death category. For these years, the red bar displays the number of hospital deaths that occurred in that year, and the green bar displays the total number of deaths in that year, with a scale displayed on the left vertical axis. Hospital deaths as a proportion of total deaths are displayed as dots with a line connecting the 2006 and 2017 values. The appropriate scale is displayed as the right axis.
Hospital deaths as a proportion of total deaths decreased between 2006 and 2017 for each disease category, with the exception of pneumonia, despite changes in the number of deaths inside and outside of hospitals.
The fall in the proportion of deaths in hospital for dementia and COPD occurred in the context of a rise in both the total deaths and the number of deaths in hospital for these categories.
Data source: Office for National Statistics
6. Other resources
PHE’s Death in people aged 75 years and older in England in 2017, the first in its palliative and end of life care report series.
PHE’s atlas of variation for palliative and end of life care allows users to explore local variations in death and end of life care, and is available either as a report, on the Atlas of Variation page on PHE Fingertips (available under the ‘Themed Atlases’ subsection, published in 2018), or as an interactive instant atlas on NHS RightCare.
PHE’s National End of Life Care Intelligence Network also develops End of Life Care Profiles, providing information on end of life care indicators for various geographic areas in England.
Authors: Ashley Makwana, Andy Pring, Nicola Bowtell, Julia Verne
For more information, please contact: neolcin@phe.gov.uk.