Annex A: Vulnerable and high-risk groups
Updated 5 August 2026

© Crown copyright 2026
This publication is licensed under the terms of the Open Government Licence v3.0 except where otherwise stated. To view this licence, visit nationalarchives.gov.uk/doc/open-government-licence/version/3 or write to the Information Policy Team, The National Archives, Kew, London TW9 4DU, or email: psi@nationalarchives.gov.uk.
Where we have identified any third party copyright information you will need to obtain permission from the copyright holders concerned.
This publication is available at https://www.gov.uk/government/publications/our-children-our-future-tackling-child-poverty-monitoring-and-evaluation-baseline-report/annex-a-vulnerable-and-high-risk-groups
Overview
This annex provides details of the latest analysis showing the different characteristics associated with increased risk of child poverty, reflecting the latest revised and updated Households Below Average Income (HBAI) data. Historic trends are set out in the Evidence Pack that was published alongside the Child Poverty Strategy.
As set out in the baseline report, we use two headline metrics to evaluate progress against the Strategy.
The first metric is relative low income after housing costs (AHC), which reflects changes in living standards by comparing household income, after housing costs and adjusted for household size and composition, to the national median. Children are considered in poverty if they live in households with less than 60% of this median income.
The second metric is deep material poverty, a fixed measure, based on material deprivation, based on whether families can afford 13 items, identified by the public as the most essential items, covering basic needs. Families lacking four or more items for financial reasons are classed as being in deep material poverty.
Since the Strategy publication, updated estimates for both measures were published in the Department for Work and Pensions’ Household Below Average Income Publication (HBAI) in March 2026. This includes methodological improvements implemented in HBAI this year, resulting in revised estimates for income-based poverty measures with updated back series through to 2021/22. Further information on the HBAI methodological changes and publication are here: Households below average income (HBAI) statistics - GOV.UK
Vulnerable and high risk groups
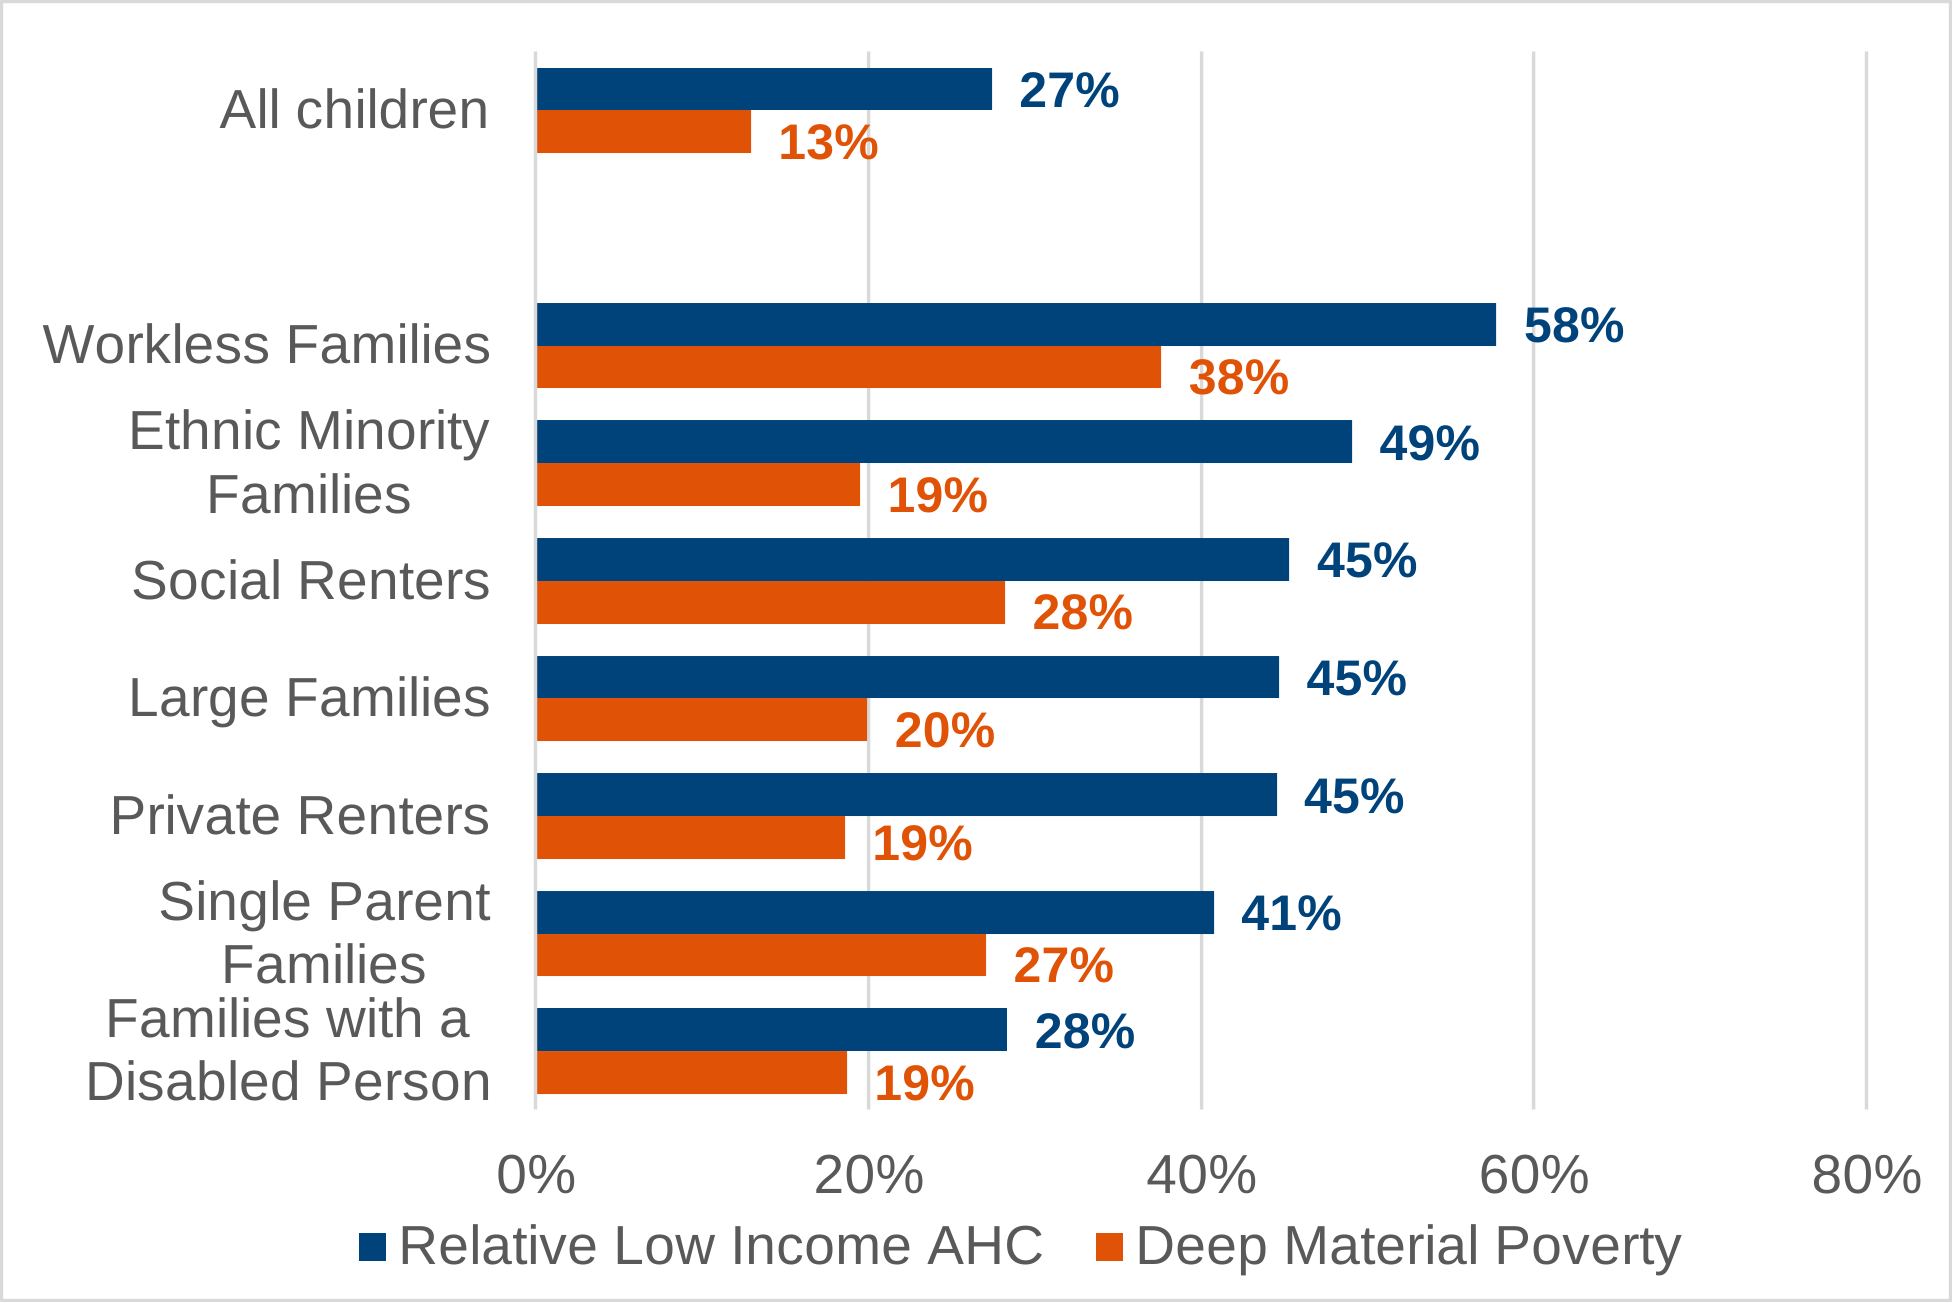
Not all children are at equal risk of poverty, certain characteristics are associated with higher child poverty rates. Figure 1 below presents the groups who are more at risk than the average child on both measures of poverty.
Figure 1: Rates of children in relative low income (AHC) and deep material poverty, United Kingdom, 2024/25, by characteristics.
The latest statistics show that in 2024/25:
Almost three quarters of children in relative low income, and over half of children in deep material poverty were in working families. However, 58% of children in non-working families were in relative low income, and 38% were in deep material poverty. [footnote 1]
Prior to the removal of the two-child limit, around half of all children in poverty were in larger families, whether relative low income or deep material poverty. The poverty rate of children in larger families was twice that of children in families with 1 or 2 children, 45% and 19% for relative low income, and 20% and 10% for deep material poverty, respectively.
Children in single parent families are particularly vulnerable to deep material poverty. Over a third of children in relative low income and half of children in deep material poverty were in single parent families. The relative low income rate for children in single parent families was 41%, and the deep material poverty rate was 27%, 3 times higher than the deep material poverty rate for children in couple families.
Children in disabled families are particularly vulnerable to deep material poverty. 40% of children in relative low income and over half of children in deep material poverty were in disabled families. The relative low income rate for children in disabled families (28%) is similar to children in non-disabled families (27%), but the deep material poverty rate is over twice as high, 19% for disabled families compared to 8% for non-disabled families. This reflects how disabled families often face high additional living expenses, meaning the same amount of money will not stretch as far as for a non-disabled family.
Ethnic minority groups are overrepresented in child poverty. 40% of children in relative low income and 37% of children in deep material poverty have an ethnic minority head of household. Of children with an ethnic minority head of household, 49% were in relative low income and 21% were in deep material poverty.[footnote 2]
Housing costs continues to be a key driver of child poverty, with over 70% of children in relative low income and 80% of children in deep material poverty living in the rented sectors. 45% of children in the social rented sector were in relative low income and 28% in deep material poverty. 45% of children in the private rented sector were in relative low income and 19% in deep material poverty.
As Universal Credit (UC) is the primary low-income benefit, 61% of all children in relative low income and 72% of children in deep material poverty were in households in receipt of UC. Of children in households in receipt of UC, 46% were in relative low income, and 27% were in deep material poverty.
-
All statistics in this section are from Households below average income: for financial years ending 1995 to 2025 ↩
-
For ethnic minority breakdowns multi-year averages are used to ensure sufficient sample sizes. Relative low income is for the period 2022/23 to 2024/25, and deep material poverty for the period 2023/24 to 2024/25. ↩