Operation of police powers under the Terrorism Act 2000 and subsequent legislation: arrests, outcomes and stops and searches, Great Britain, financial year ending March 2014
Published 28 August 2014
Applies to England, Scotland and Wales

© Crown copyright 2014
This publication is licensed under the terms of the Open Government Licence v3.0 except where otherwise stated. To view this licence, visit nationalarchives.gov.uk/doc/open-government-licence/version/3 or write to the Information Policy Team, The National Archives, Kew, London TW9 4DU, or email: psi@nationalarchives.gov.uk.
Where we have identified any third party copyright information you will need to obtain permission from the copyright holders concerned.
This publication is available at https://www.gov.uk/government/statistics/operation-of-police-powers-under-the-terrorism-act-2000-financial-year-ending-march-2014/operation-of-police-powers-under-the-terrorism-act-2000-and-subsequent-legislation-arrests-outcomes-and-stops-and-searches-great-britain-financial
1. Summary points
1.1 Arrests and outcomes
In the year ending March 2014:
There were 230 persons arrested for terrorism-related offences, down from 252 in the previous year.
Fifty-two per cent of terrorism arrests resulted in a charge, up 5 percentage points on the previous year.
Of the charges brought in the year ending March 2014, 62% were terrorism-related.
At the time of data provision for this release (7 July 2014), 27 of the 74 persons charged with terrorism-related offences in the year ending March 2014 had been convicted of an offence, with 44 defendants awaiting trial.
1.2 Court proceedings
Data provided by the Crown Prosecution Service show that 37 of the 43 trials completed in the year ending March 2014 for offences under terrorism legislation resulted in convictions.
Thirty-six of the 37 defendants convicted were sentenced to immediate custody, 4 of whom received life sentences.
1.3 Terrorist and extremist prisoners
As at 31 March 2014, there were 154 terrorist/extremist prisoners in Great Britain, just under four-fifths of whom were UK nationals.
Fifty-two persons were released during the year ending March 2014.
1.4 Stops and searches
No searches were made by the police in Great Britain under section 47A of the Terrorism Act 2000 (TACT) in the year ending March 2014. To date, no searches have been made in Great Britain under this power.
A total of 44,118 persons were examined at ports in Great Britain under Schedule 7 to TACT, a fall of 23% on the previous year. In total, 517 persons were detained after a Schedule 7 examination in the year ending March 2014.
The Metropolitan Police Service stopped and searched 450 persons under section 43 of TACT. This represents a 23% fall on the previous year total of 582. The arrest rate for searches under section 43 of TACT was 7.1%, up 1.6 percentage points on the previous year.
2. Arrests and outcomes
2.1 Introduction
Statistics are presented here on the number of persons arrested by police in Great Britain, where there is suspicion of involvement with terrorism. Outcomes of these arrests are also included up to the stage of prosecution, release, or other outcome. The information was provided to the Home Office by the Association of Chief Police Officers’ Counter Terrorism Coordination Centre (ACTCC), based on the latest position with each case at the date of data provision (7 July 2014) and covers the period up to 31 March 2014.
2.2 Arrests
The relatively small numbers of persons arrested for terrorism-related offences each year mean that proportionally large fluctuations in arrests can result from particular police operations, or individual cases involving multiple suspects.
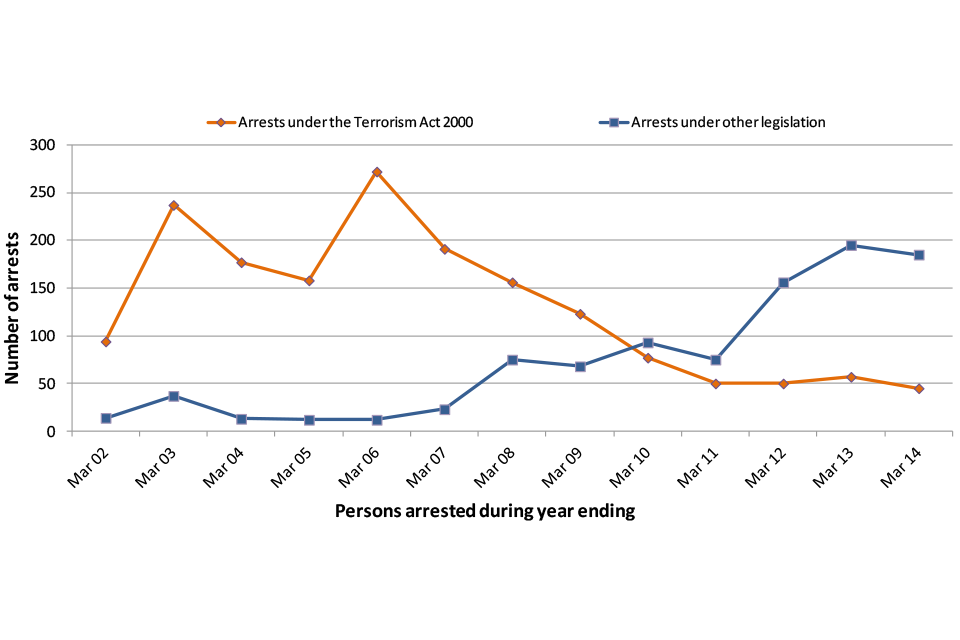
There were 230 persons arrested for terrorism-related offences in the year ending March 2014, a fall of 9% on the previous year. The annual average of terrorism-related arrests since 1 April 2002 was 211 per year, with a peak of 284 arrests in the year ending March 2006 and a low of 125 arrests in the year ending March 2011.
Terrorism-related arrests can be made under the Police and Criminal Evidence Act (PACE), or under section 41 (s41) of the Terrorism Act (TACT) if arresting officers require additional powers of detention or need to arrest a person suspected of terrorism-related activity without a warrant. The decision on whether to arrest a person suspected of terrorism-related activity under s41 of TACT or PACE is an operational decision for the police.
In recent years, the proportion of all terrorism-related arrests made under s41 of TACT has fallen consistently, from 96% in the year ending March 2006, to 20% in the year ending March 2014. In terms of numbers, s41 TACT arrests peaked at 272 in the year ending March 2006, falling to 50 in the years ending March 2011 and 2012, increasing slightly to 57 in the year ending March 2013 before falling again to 45 in the year ending March 2014. Although there has been some fluctuation in the numbers of terrorism-related arrests under other legislation in recent years, numbers per year have risen substantially since the year ending March 2005, from 12 in each of the years ending March 2005 and 2006 to a peak of 195 in the year ending March 2013. In the year ending March 2014, the number fell slightly to 185.
Since 11 September 2001, when the current data collection was set up by ACTCC, there have been 2,645 terrorism arrests in total.
Persons arrested for terrorism-related offences
.
Source: Home Office, Data table A.01.
2.3 Pre-charge detention under section 41 of the Terrorism Act 2000
Pre-charge detention assists the police in the investiga 02tion and accumulation of evidence pertaining to potential terrorism offences. Further information on these powers is given in the user guide.
In the year ending March 2014, as in previous years, most detainees continue to spend a short time in pre-charge police custody, with 24% detained for less than a day, a third detained for less than 2 days and 98% detained for 7 days or less.
Between 25 July 2006 and 25 January 2011 the maximum period of pre-charge detention was extended from 14 days to 28 days. During this period, 6 individuals were held for more than 27 days (all in the year ending March 2007), of whom 3 were charged and 3 were released without charge.
2.4 Charges and charging rates
Of the 230 persons arrested for terrorism-related offences in the year ending March 2014, 119 (52%) were charged, a further 70 (30%) were released without charge and 41 (18%) had alternative action taken against them, the latter of which mainly comprised of those being bailed to return pending further investigation. This compares to 39% charged, 52% released without charge and 9% with alternative action taken since 11 September 2001. The charging rate of 52% in the year ending March 2014 was the highest rate seen since the data collection began; the lowest charging rate was 26% in the year ending March 2006.
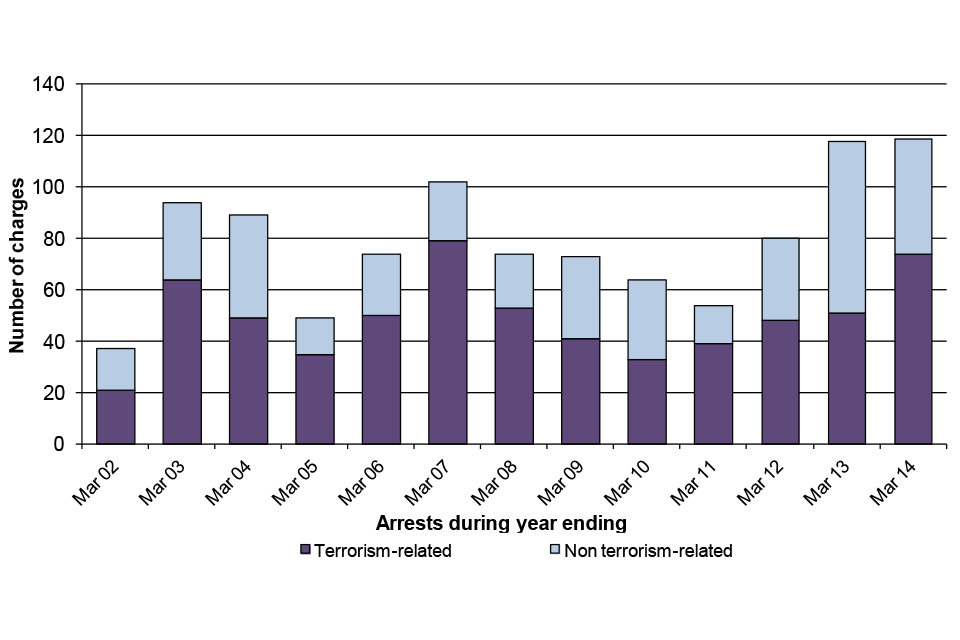
Persons charged following terrorism-related arrests
.
Source: Home Office, Data table A.04.
Often, terrorism-related arrests can result in charges for non-terrorism-related offences as the police investigate cases and new information comes to light.
Of the 119 charges brought in the year ending March 2014, 74 (62%) were terrorism-related, comprising 41 under TACT legislation, 6 under Schedule 7 to TACT for failure to comply with border controls and a further 27 for terrorism-related offences under other legislation. The remaining 45 charges (38%) were for other non terrorism-related offences. For the 1,027 charges since 11 September 2001 the breakdown was: 386 (38%) under TACT; 74 (7%) under Schedule 7 to TACT; 177 (17%) for terrorism-related offences under other legislation and 390 (38%) for other non terrorism-related offences.
2.5 Charges by offence
In line with the normal procedures for criminal justice statistics, each suspect has been classified in terms of a single principal offence. This means that where an individual has been charged with a number of offences they are recorded only against the most serious one.
For the 460 persons charged under terrorism legislation since 11 September 2001 the main principal charges related to:
- possession of an article for terrorist purposes (16% of such charges)
- preparation for terrorist acts (16%)
- failing to comply with duty at a port or border controls (16%)
- collection of information useful for an act of terrorism (10%)
- fundraising (10%)
For the 177 persons charged under non-terrorism legislation where the offence was considered terrorism-related, the most prevalent principal charges were:
- conspiracy to commit murder (19%)
- offences under the Explosive Substances Act 1883 (14%)
- offences under the Fraud Act 2006 (7%)
- offences under the Proceeds of Crime Act 2002 (6%)
In addition to the above charges, a total of 390 persons have been charged with offences identified by ACTCC to be non-terrorism-related. The most frequent principal charges were for:
- Forgery and Counterfeiting Act 1981 (10%)
- Theft Acts 1968 and 1978 (8%)
- Fraud Act 2006 (7%)
- Misuse of Drugs Act 1971 (7%)
- Firearms Act 1968 (6%)
- Public Order Act 1986 (6%)
2.6 Court proceedings and outcomes of charges
This section considers the outcomes for persons charged, based on year of arrest. Due to the complex nature of terrorism investigations, trials may take place several years after an arrest or charge takes place. Those tried in the year ending March 2014 can relate to arrests made in earlier years. It should be borne in mind that quoted numbers/proportions of persons charged and convicted will change as prosecutions are completed.
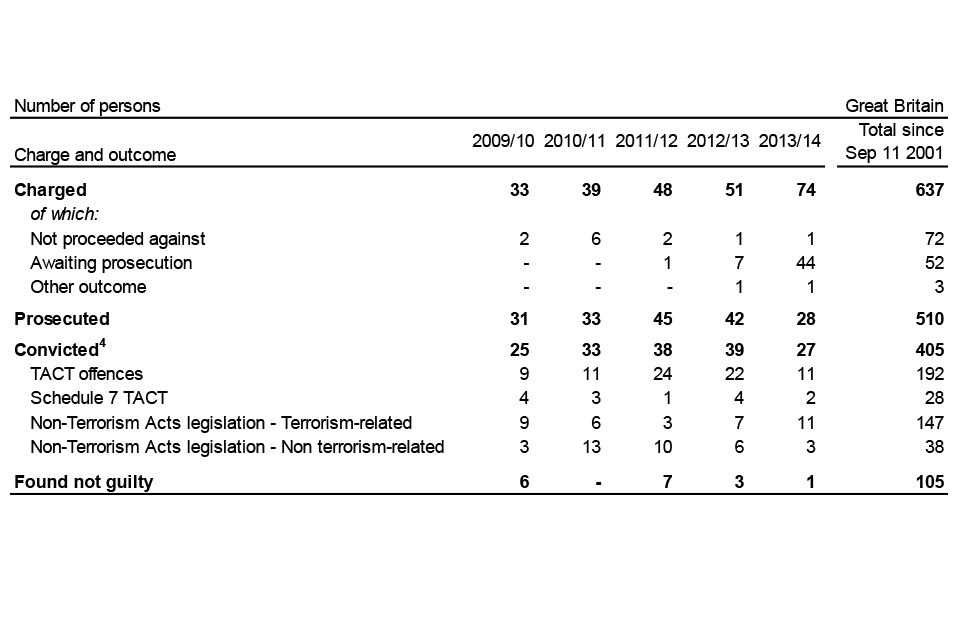
At the time of data provision for this release (7 July 2014), 28 of the 74 persons arrested and charged with terrorism-related offences in the year ending March 2014 were proceeded against. Of these, 27 people were convicted: 13 for offences under terrorism legislation and 14 for non-terrorism legislation offences.
Since 11 September 2001, 405 of the 637 charged with terrorism-related offences have been convicted (64%), 220 for offences under terrorism legislation and 185 for non-terrorism legislation offences.
Outcome1 for persons charged2,3 with terrorism-related offences
.
- Since 11 September 2001. Data presented here are based on the latest position with each case as at the date of data provision from ACTCC (7 July 2014).
- Includes all charges under terrorism legislation and under other legislation where considered by ACTCC to be terrorism-related.
- Refers to the substantive charge at indictment recorded by the Crown Prosecution Service.
- Excludes cases when a conviction was later quashed on appeal. Source: Home Office, Data table A.06c.
2.7 Persons convicted by offence
The most frequent principal charges for persons convicted since 11 September 2001 under terrorism legislation were:
- preparation for terrorist acts (25% of persons convicted)
- collection of information useful for a terrorism act (15%)
- failing to comply with an examination at a port or border controls (13%)
The main principal convictions since 11 September 2001 which were considered terrorism-related but under non-terrorism legislation were:
- causing or conspiring to cause an explosion under the Explosive Substances Act 1883 (18% of persons convicted)
- conspiracy to commit murder (11%)
- offences under the Forgery and Counterfeiting Act 1981 (10%)
- Firearms Act 1968 offences (8%)
Details of terrorism arrests that subsequently resulted in a non-terrorism-related charge or conviction can be found in Data tables A.07 and A.08c.
2.8 Gender, age and ethnic appearance of persons arrested, charged and convicted
Of the persons arrested for terrorism-related offences since 11 September 2001, 93% were male. This is similarly reflected in terrorism-related charges and convictions, with males making up 93% and 95% of the total respectively. Full breakdowns can be found in Data table A.09.
Since 11 September 2001, the age group with the highest proportion of persons arrested, charged, and convicted for a terrorism-related offence was the 30-and-over age group, comprising 47% of persons arrested, 44% of persons charged and 43% of persons convicted. Full breakdowns can be found in Data table A.10.
More than a third (37%) of all persons arrested since 11 September 2001 were recorded by police as being of Asian ethnic appearance. Proportions for other recorded ethnicities at arrest were: 30% White, 20% Other and 12% Black. Similar proportions were seen at charge and conviction; again, those recorded as Asian made up the largest proportions at charge (38%) and at conviction (41%). Full breakdowns can be found in Data table A.11.
2.9 Nationality of persons arrested, charged and convicted
Of the 2,645 persons arrested for terrorism-related offences since 11 September 2001, 1,371 (52%) self-declared their nationality as British or of British dual nationality. Of the remaining persons arrested the most frequent self-declared nationalities were: Algeria (156 persons), Pakistan (134 persons), Iraq (116 persons), Afghanistan (75 persons), Iran (63 persons), India (59 persons), Turkey (49 persons) and Somalia (48 persons). Full breakdowns for all nationalities self-declared at arrest can be found in Table A.13a. Data on charges and convictions for terrorism-related offences broken down by their self-declared nationality at the time of arrest are in Data tables A.12b and A.12c.
2.10 Categorisation of persons arrested and charged
Categories of those arrested and charged presented here are based on involvement with any type of terrorism and separately identify those associated with domestic, international and Northern Ireland Related Terrorism (NIRT). The data also include persons found not to be associated with any type of terrorism at the time of arrest or charge.
Of those arrested since 11 September 2001, 79% were classified as international with 10% classified as domestic and 7% classified as associated with NIRT. Proportions by category fluctuate year on year. Full breakdowns of classifications of those arrested, charged and convicted can be found in Data table A.13.
2.11 Data tables
Data on persons arrested for terrorism-related offences, and the resulting charges and other outcomes, can be found in Data tables A.01 to A.13.
2.12 Data quality and interpreting the figures
The data presented are based on the position as at 7 July 2014, when case information was provided to the Home Office by ACTCC. As cases progress over time, outcomes can change and therefore figures for periods previously published may be updated in this release.
ACTCC regularly review their cases to ensure that records are up-to-date, which can result in records being added, removed or reclassified. The most notable recent review is the reclassification of a number of arrests made in Scotland at border controls which had been recorded as non terrorism-related. Prior to this release, these cases were reviewed to determine their most appropriate classification. As a result, a number of charges have been re-classified from ‘non terrorism-related’ to ‘Schedule 7 (TACT)’.
Self-declared nationalities of persons arrested may differ from their actual nationalities; this must be borne in mind when interpreting figures on arrestee nationalities presented above.
Categorisations of persons arrested presented here are based on assessment by ACTCC and may not be mutually exclusive in all cases. Additionally, categorisations may change as cases progress and further information on each case comes to light. Full definitions of these categories can be found in the user guide. From the year ending March 2011 onwards the use of the ‘not classified’ category was reviewed to ensure that stricter categories of involvement with terrorism were adhered to. As a result, figures from that year onwards are not directly comparable with figures for previous years.
The user guide provides further details relating to definitions, legislation and procedures, and data quality.
3. Court proceedings
3.1 Introduction
Statistics are presented here on the number of defendants proceeded against by the Crown Prosecution Service Counter Terrorism Division (CPS CTD) in the year ending March 2014. Data shown here are based on final outcomes for each defendant (i.e. when all proceedings in each case are concluded), and are presented on the principal, or most serious, offence basis. Results of partially completed trials are not included.
Due to the complex nature of terrorism investigations, trials may take place several years after an arrest or charge takes place. Trials completed in the year ending March 2014 can relate to arrests made in earlier years.
3.2 Court proceedings
Over the 5-year period from 1 April 2009 to 31 March 2014, the CPS CTD completed trials for 152 defendants for terrorism-related offences, dealing with an average of 30 defendants per year. The most common offence for which a defendant was proceeded against over the period was preparation for terrorist acts (45 persons) followed by the Criminal Law Act 1977 (24 persons). Rates of prosecution to conviction averaged 77% over the 5 years, with 117 persons convicted.
In the year ending March 2014, court proceedings for 34 defendants were completed by the CPS CTD for offences under terrorism legislation. Proceedings were for a variety of offences, although notably there were 23 persons proceeded against for preparation for terrorism acts (all of whom were convicted).
Additionally in the year ending March 2014, 9 persons were proceeded against for terrorism-related offences under non-terrorism legislation. This total included 3 proceedings for murder (all resulting in convictions), also 3 for false imprisonment (all resulting in acquittals), 2 under the Criminal Law Act 1977 (both resulting in convictions) and 1 under the Firearms Act 1968 (also resulting in a conviction).
3.3 Sentencing
Thirty of the 31 defendants convicted under terrorism legislation received custodial sentences (including 1 life sentence); the remaining person in this category received a non-custodial sentence. All 6 defendants convicted under non-terrorism legislation received a custodial sentence, including 3 life sentences.
Of all 37 persons convicted in the year ending March 2014, 31 had pleaded guilty. Over the 5-year period from 1 April 2009 to 31 March 2014 the proportion of defendants pleading guilty has increased year on year, from 40% in the year ending March 2010 to 84% in the year ending March 2014.
3.4 Appeals
Over the 5-year period from 1 April 2009 to 31 March 2014 there have been a total of 44 appeals against terrorism convictions heard by the courts, of which 37 (84%) were either dismissed by the court or abandoned by appellants prior to the decision being made. No appeals resulted in convictions being quashed over the 5 years; however, 6 appeals (all in the year ending March 2010) resulted in a sentence being reduced and 1 appeal (in the year ending March 2012) resulted in a sentence being increased.
All 7 of the appeals against terrorism convictions heard by the courts in the year ending March 2014 were dismissed.
3.5 Data tables
Data on court proceedings dealt with by CPS CTD can be found in Data tables C.01-C.04.
3.6 Data quality and interpreting the figures
In line with the normal procedures for criminal justice statistics, and in order to present an accurate count of the number of persons dealt with by CPS CTD, data in part 3 (court proceedings) are presented on a principal offence basis. This means that, when a person is proceeded against for multiple offences at the same time, the most serious offence is the one counted in these data. If a person is subsequently proceeded against on another occasion for a different offence, the additional case will also be included in the dataset.
Due to the complex nature of terrorism investigations, trials may take place several years after an arrest or charge takes place. Trials completed in the year ending March 2014 can relate to arrests made in the previous financial year or earlier. Since the approach used in part 2 (arrests and outcomes) is based on time of arrest and the approach used here is based on time of trial outcome, data drawn from both may not be directly comparable.
4. Terrorist and extremist prisoners
4.1 Introduction
Data presented here are provided by the National Offender Management Service and Scottish Prison Service, and show the number of persons who were in prison custody for terrorism-related offences and the number of domestic extremist/separatist prisoners in Great Britain as at 31 March 2014. Data on prisoners released in the year ending March 2014 are also included. Trends for 5 years are also included here for the first time.
4.2 Key facts
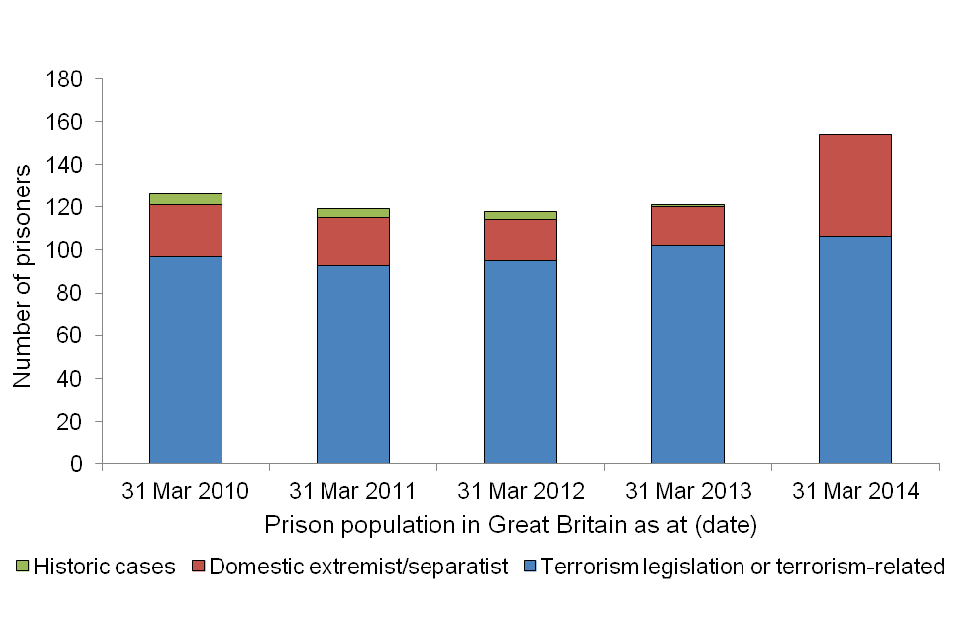
As at 31 March 2014, there were 154 terrorist/extremist prisoners in Great Britain, either on remand or following conviction. In total 106 prisoners were in custody for offences classified as terrorism-related, of whom 68 were in custody for offences under terrorism legislation, 36 for terrorism-related offences not under terrorism legislation and a further 2 held in relation to deportation cases. Forty-eight prisoners were classified as domestic extremists/separatists, 45 of whom were in custody following conviction, with 2 on remand and 1 extradition case. There were no prisoners in custody with historic convictions pre-dating current terrorism legislation.
The 154 persons in custody as at 31 March 2014 compared to 121 the year before; the main reason for the increase was the admission into custody of a number of domestic extremist/separatist prisoners, all involved in the same case, during the October to December 2013 quarter following conviction.
Sixty-five of the 154 prisoners in Great Britain remanded or convicted for terrorism-related offences defined themselves as of Asian (or Asian British) ethnic origin at the time of reception into custody, 56 defined themselves as White.
Terrorist/extremist prison population as at 31 March
.
Source: Home Office, Data table P.01.
The nationalities of the 154 terrorist/extremist prisoners in Great Britain as at 31 March 2014 were spread over 19 countries, with the majority recorded as UK nationals (127). Others defined themselves as being African (8), Non-UK European (8), Asian (8) and from the Middle East (1). The nationality of the remaining 2 prisoners was unrecorded.
In terms of the self-declared religions, 101 of the 106 terrorism-related prisoners defined themselves as Muslim. For the 48 domestic extremists/separatists the picture was more mixed, including 19 prisoners declaring as no religion, 10 as Church of England, 3 as Muslim, 2 as Roman Catholic and 8 as Other Christian.
Thirty-two terrorist/extremist prisoners were released in the year ending March 2014 on completion of a custodial sentence. Of these, 1 had been serving a life sentence; 14 had served sentences of 4 years or more; and the remaining 17 were released after serving sentences of less than 4 years. An additional 20 prisoners were released from custody having been held on remand or as non-criminal prisoners. The 1 remaining person in custody with historic convictions pre-dating current terrorism legislation was released during the year ending March 2014.
4.3 Data tables
Data on persons in prison custody can be found in Data tables P.01 to P.06.
4.4 Data quality and interpreting the figures
Populations of terrorism-related prisoners fluctuate year on year due to new admissions and releases occurring over time, as well as the completion of cases involving a large number of defendants.
Data presented here on terrorist and extremist prisoners include persons held on remand as well as those held after conviction and/or sentencing. They also include prisoners for historic terrorism cases originating from before 11 September 2001, who are not included in the arrests and outcomes data presented in part 2 of this release.
5. Stops and searches
5.1 Introduction
Statistics are presented here on the use of certain stop and search procedures available to police under the Terrorism Act 2000 (TACT).
Also included here are data on examinations made at ports under Schedule 7 to TACT, and the use of police cordons under section 33 (s33) of TACT.
Information on the legislative background to these powers can be found in the user guide.
5.2 Stops and searches under sections 44 and s47A of the Terrorism Act 2000
Section 44 (s44) of TACT provided police officers with the power to stop and search persons and vehicles for articles which could be used in connection with terrorism. On 18 March 2011, all s44 powers were formally replaced with s47A of TACT stop and search powers.
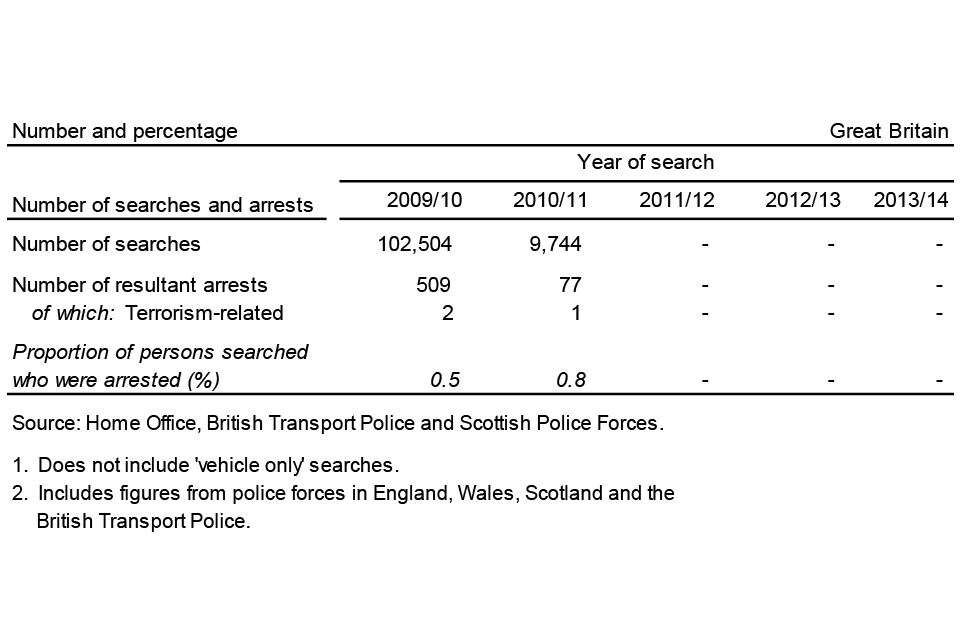
No searches were made by the police between 1 April 2011 and 31 March 2014 in Great Britain under s47A of TACT. This compares with 9,744 in the year ending March 2011 and 102,504 in the previous year made under s44 of TACT. Only 3 of these s44 searches resulted in terrorism-related arrests.
Summary of stops and searches and resultant arrests made under sections 44(1)(2) and 47A of the Terrorism Act 20001,2
.
Source: Home Office, Data table S.01
5.3 Stops and searches under section 43 of the Terrorism Act 2000
The Terrorism Act 2000 (TACT) also gives powers to individual officers to stop and search a suspect whom they must reasonably suspect is involved in terrorism activity under s43 of the Act. These powers, unlike those under s44/47A, do not require any authorisations from senior police officers, or the Home Secretary. Data on searches under these powers presented here cover the Metropolitan Police Service area only.
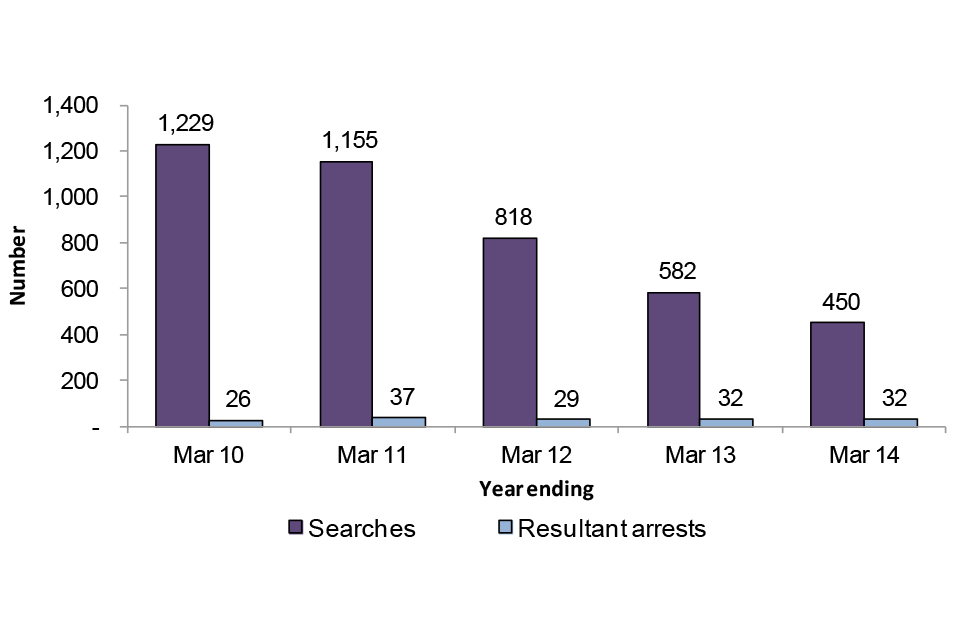
Over the last 5 years from 1 April 2009 to 31 March 2014, the number of persons stopped and searched by the Metropolitan Police Service has fallen year on year: from 1,229 in the year ending March 2010 to 450 in the year ending March 2014, a fall of nearly two-thirds (63%) in total over the period. During the same period, the proportion of searches resulting in arrests increased from 2.1% in the year ending March 2010 to 7.1% in the year ending March 2014, although there has been little change in resultant arrests over the 5 years. Despite some fluctuations in numbers over the period, the 26 arrests in the year ending March 2010 compared to 32 arrests in the year ending March 2014.
Summary of stops and searches and resultant arrests made under section 43 of the Terrorism Act 2000
.
Source: Home Office, Data table S.03
Of those stopped and searched under s43 of TACT, there has been a downward trend in the proportion who defined themselves as White, falling from 53% in the year ending March 2010 to 36% in the year ending March 2012, increasing slightly to 38% in the year ending March 2013 and then falling to 34% in the year ending March 2014. The proportion who defined themselves as Asian rose from 24% in the year ending March 2010 to 37% in the year ending March 2012, falling to 28% in the year ending March 2014. For those who defined themselves as Black at the time of search, the proportion remained constant during the 3 year period 1 April 2009 to 31 March 2012 with an average of 10% during those years, before rising to 14% (years ending March 2013 and March 2014).
5.4 Examinations under Schedule 7 to the Terrorism Act 2000
During the 5-year period from 1 April 2009 to 31 March 2014, the number of persons examined at ports under Schedule 7 to TACT fell year on year from a peak of 85,557 in the year ending March 2010 to 44,118 in the year ending March 2014, a fall of just under half (48%) over the whole period. The proportion of examinations that lasted more than an hour in all 5 years was steady at 3% or 4% in each of the 5 years (1,187 persons in the year ending March 2014).
Of those examined in the years ending March 2013 and 2014, a relatively high proportion of persons did not self-define their ethnicity at the time of examination (7% and 8% in those 2 years compared to 1% and 2% in the previous 2 years); therefore proportions by ethnicity presented below exclude these persons.
Of those examined who did self-define their ethnicity in the year ending March 2014, proportions were: 45% White, 22% Asian, 18% Chinese or Other, 9% Black and 5% Mixed. Proportions who self defined as Asian fell the most in recent years (from 30% in the year ending March 2011 to 22% in the year ending March 2014); the biggest increases during the same period were seen for those who self defined as White (up 4 percentage points from 41% in the year ending March 2011 to 45% in the year ending March 2014) and Mixed (up 2 percentage points from 3% to 5%). Proportions who self defined as Black and Chinese or Other remained relatively stable over the period (averaging 9% and 18% respectively).
In total, 517 persons were detained after a Schedule 7 examination in the year ending March 2014, down 22% from 667 in the previous year. Proportions of those detained by self-declared ethnicity were: 37% Asian (up 1 percentage point on the previous year), 24% Chinese or Other (down 1 percentage point), 19% Black (down 7 percentage points), 12% White (up 2 percentage points), and 8% Mixed (up 5 percentage points).
The total number of Schedule 7 examinations can be seen in the context of 111.9 million arrivals in the United Kingdom in the year ending March 2014. Assuming a similar number of departures through UK ports, this gives a proportion of approximately 0.02% (or 2 persons searched out of every 10,000 persons passing through UK ports in the year ending March 2014).
5.5 Cordons under section 33 of the Terrorism Act 2000
Section 33 of TACT gives police officers of at least the rank of superintendent the power to authorise the use of a cordon in an area where it is considered expedient to do so for the purposes of a terrorist investigation. A police officer may order persons and drivers to leave cordoned areas, and prohibit pedestrian or vehicle access. Cordons are typically set up to investigate a suspected package or to deal with the consequences of a terrorism-related incident. Further information on the power can be found in the user guide.
During the year ending March 2014 there were 16 cordons set up under section 33 of TACT in Great Britain, up from 12 in the previous year. The majority of cordons during the year ending March 2014 were set up in the Greater Manchester Police force area.