Equality objectives progress review 2018 to 2019
Updated 17 December 2020
Applies to England

© Crown copyright 2020
This publication is licensed under the terms of the Open Government Licence v3.0 except where otherwise stated. To view this licence, visit nationalarchives.gov.uk/doc/open-government-licence/version/3 or write to the Information Policy Team, The National Archives, Kew, London TW9 4DU, or email: psi@nationalarchives.gov.uk.
Where we have identified any third party copyright information you will need to obtain permission from the copyright holders concerned.
This publication is available at https://www.gov.uk/government/publications/ofsteds-equality-objectives-2016-to-2020/equality-objectives-progress-review-2018-to-2019
Introduction
This report is a review of our progress against our published 2017–20 equality objectives. It covers the period April 2018 to March 2019.
We developed our equality objectives in consultation with our staff and equalities networks.
The objectives relate to how we inspect and our practice as an employer and contractor. As a result, this report does not include what we found in inspections in relation to equalities over the last year. We report on our inspection findings through individual inspection reports, research and evaluation reports, commentaries, blogs and Annual Reports.
Please send any questions or comments to: EDI@ofsted.gov.uk.
What these objectives cover
The equality objectives cover 2 areas:
- how we give due regard to equality, diversity and inclusion during inspection and our research and evaluation work
- how we promote equal opportunities for our workforce and tackle discrimination, bullying and harassment
We took the first of these objectives into account when developing:
- our education common inspection framework, which we implemented in September 2015
- our social care common inspection framework (SCCIF), which we implemented in April 2017
Over the last year, we have ensured that our inspections continue to comply with these framework requirements and that we have reported on non-compliance with the Equality Act 2010 whenever found.
We have also developed and consulted on our new education inspection framework (EIF), which we implemented in September 2019.
The second objective is about our practice as an employer, our staffing profile and the actions that we have taken to deal with any issues.
For example, although the percentage of black and minority ethnic (BAME) staff in Ofsted overall is higher than the Civil Service average, the figures for our inspector grades continue to be lower. This reflects the limited diversity in leadership positions in the sectors from which we recruit. To help tackle this, we have continued an inspection shadowing programme for BAME middle leaders who aspire to become Her Majesty’s Inspectors (HMI). This year, we have introduced similar initiatives to attract more contracted Ofsted Inspectors (OIs) from diverse backgrounds.
We are committed to being a force for improvement through all our work. As this review shows, we have taken significant steps to improve both the way we inspect and our workforce profile in relation to our equalities responsibilities. However, there is still more for us to do in both areas. We will continue to tackle the issues identified and will report on our progress.
Objective 1
Ofsted will give due regard to equality, diversity and inclusion during inspection and in its research and evaluation work
This objective is broken down into 2 parts. The numbering relates to that within our 2017–20 equality objectives.
1.1 In making judgements, inspectors will consider whether those we inspect comply with their relevant duties set out in the Equality Act 2010. They will also consider, if applicable, the extent to which they promote British values and promote equality and diversity.
1.2 When meaningful, we will comment on outcomes for children and learners with relevant protected characteristics. We will continue our programme of special educational needs and/or disabilities (SEND) inspections.
Actions
Our actions are to:
- be clear in all published inspection frameworks that inspectors will take the above factors into account
- provide training to inspectors on equality, diversity and inclusion, and how to assess it on inspection
- ensure that we consider those with protected characteristics when setting and carrying out our research and analysis programmes
Success criterion
Inspectors report non-compliance with the Equality Act 2010 when encountered.
Update: objective 1 actions
Be clear in all published inspection frameworks that inspectors will take the above factors into account’
This section covers what we have done under this action within objective 1.
Education
We have introduced several inspection frameworks in this period. These are detailed below.
Common inspection framework
We reported last year on how we fulfilled our duties under the Equality Act 2010 through our routine early years, school and further education inspections by following the common inspection framework. Each education remit had an inspection handbook setting out the activities that inspectors carried out and the criteria that they judged against. Together, these documents set out the way we took equality, diversity and inclusion matters into account in education inspections under that framework. We made minor updates to those documents since 2015 but none in the last year that changed the way we inspected the extent to which providers comply with relevant equalities duties.
We evaluated the quality of our inspectors’ work through quality assurance visits and reviews of evidence bases and inspection reports.
Over the last year, a review of quality assurance reports from 205 visits to early years inspections found that inspectors closely followed Ofsted’s policies and procedures in relation to inspecting equality and diversity matters on all but 1 occasion.
We also carried out an in-depth quality assurance review of how well school inspectors consider the equalities matters. HMI reviewers scrutinised the evidence bases and/or inspection reports from 130 inspections. The review found that inspectors’ practice was variable and that it was rare that inspectors enquired about how governors/trustees assured themselves that a school meets its duties in relation to the Equality Act 2010. This work has informed future training for inspectors.
Education inspection framework
Over the last year, we have worked on the new EIF, which was implemented in September 2019. We published a draft equality, diversity and inclusion statement alongside the draft framework when consulting on its content. We published an updated statement alongside our published framework and associated inspection handbooks in May 2019.
When developing the new inspection arrangements, we considered how the framework, remit-specific inspection handbooks and resulting inspection practice could have an impact on individuals or groups of people with protected characteristics. We also considered how the EIF met the 3 points of the public sector equality duty (PSED). The consultation process provided the opportunity for all stakeholders and members of the public to raise any concerns that they had about equality, diversity or inclusion. We considered these carefully and made changes to the framework and inspection handbooks in response.
Our aim was for the new framework to address a number of issues that we identified with the common inspection framework and its relationship with the wider accountability system. In particular, the EIF’s emphasis on the quality and substance of education addresses concerns about the curriculum. Specifically, it addresses concerns about the extent to which the curriculum was being limited in some education providers as a result of a narrow focus on test and examination results and other internal performance measures. We identified that this was something that could have a particularly detrimental impact on those with protected characteristics, especially those with SEND.
The new framework is clear about the importance of high-quality education being available to all learners. Under the EIF, we consider whether education providers offer inclusive education and whether, for example whether:
- schools and early years providers are inclusive of children with SEND and whether schools are removing some children from their rolls solely to improve published outcomes
- colleges and other further education providers are doing all they can to ensure that all learners are able to complete their courses
- the curriculum available for all learners, including the most disadvantaged and those with protected characteristics, is ambitious and meets their needs
We intend for the framework to contribute to eliminating discrimination and advancing equality of opportunity through:
- the quality of education judgement criteria being clear that the entitlement to a high-quality education applies equally to all learners
- the personal development judgement making clear the importance of a provider’s curriculum extending beyond the academic to include its work in preparing learners for life in modern Britain; this specifically highlights the important role that providers play in equipping learners to be respectful citizens, developing their understanding of diversity and what we have in common, and promoting respect for the different protected characteristics as defined in law
- the leadership and management judgement criteria including the extent to which leaders have a clear and ambitious vision for providing high-quality, inclusive education for all
- the leadership and management criteria also including the extent to which those with responsibility for governance ensure that the provider fulfils its legal duties, which includes those under the Equality Act 2010 and, if applicable, the PSED
We intend for the EIF to also have a positive impact in terms of developing good relations. The behaviour and attitudes judgement criteria include:
- the extent to which relationships among learners and staff reflect a positive and respectful culture
- whether leaders, teachers and learners create an environment where bullying, peer-on-peer abuse or discrimination are not tolerated
- the speed and effectiveness of the response to bullying, peer-on-peer abuse and discrimination, when these happen
We believe that tackling these areas specifically through education inspection will enable us to act as a force for improvement in ensuring that all learners have a positive educational experience. We will continue to monitor and evaluate the impact of the EIF.
Special educational needs and/or disabilities inspection framework
We are now 3 years into the programme of inspections under the SEND inspection framework.
We have reported previously on the development of this inspection framework and the way it takes into account equality, diversity and inclusion issues.
We continue to hear that these inspections are making a difference to children and young people with SEND and their families. We have inspected 92 local areas. Of these, we have:
- required 46 to produce and submit a written statement of action as a result of significant weaknesses in their SEND arrangements
- revisited 7 of the local areas with a written statement of action
- judged 3 of these to be making sufficient progress in tackling the significant weaknesses that we had previously identified
In July 2018, Her Majesty’s Chief Inspector (HMCI) was asked to consider what activity Ofsted and the Care Quality Commission (CQC) might carry out when the current programme of local area SEND inspections ends in 2021. Any new inspection framework will take into account how relevant equality duties are being met in line with this objective and will be consulted on publicly in due course.
Social care
We have introduced 2 inspection frameworks in this period. These are detailed below.
Social care common inspection framework
We implemented the SCCIF in April 2017.
The SCCIF is not a ‘one-size-fits-all’ framework. It reflects and addresses the unique and distinct aspects of each type of setting within the children’s social care sector. However, the evaluation criteria we use to make judgements and the accompanying guidance are, whenever possible, consistent across setting types.
The SCCIF sets out the way in which inspectors consider whether social care providers comply with their relevant duties set out in the Equality Act 2010 and, if applicable, the extent to which they promote British values and promote equality and diversity.
The evaluation criteria used by inspectors under the framework include, for example, the extent to which children are protected and helped to keep themselves safe, from bullying, homophobic behaviour, racism, sexism, radicalisation and other forms of discrimination. Inspectors also consider the extent to which leaders and managers actively promote tolerance, equality and diversity.
We can take enforcement action, including emergency suspension or restricting numbers of children, should the impact of providers’ poor approaches to equality, diversity and inclusion seriously affect children’s safety and welfare.
We have continued to keep under review how the SCCIF has been delivered. We published our overview of the findings in March 2019. We did not find any concerns in relation to equalities, diversity and inclusion.
Inspections of local authority children’s services
In addition to inspections of individual social care providers, since January 2018, we have also carried out inspections of local authority children’s services (ILACS) under the ILACS framework.
ILACS focus on the effectiveness of local authority services and arrangements:
- to help and protect children
- on the experiences and progress of children in care wherever they live, including those children who return home
- in finding permanent homes for children who are looked after, including adoption
- on the experiences and progress of care leavers
ILACS reports show that equality, diversity and inclusion are regularly considered during these inspections. Disability, religion, culture and diversity are themes that arise in several of the reports, both positively and negatively. In our ongoing evaluation of the ILACS framework and its delivery, we have not found any concerns in relation to equalities, diversity and inclusion.
Provide training to inspectors on equality, diversity and inclusion, and how to assess it on inspection
This section covers what we have done under this action within objective 1.
We require all staff to carry out ‘Understanding equalities and unconscious bias’ online training and safeguarding training. This training includes case studies involving children who have protected characteristics.
Education
In addition to the all-staff training on equalities, diversity and inclusion, in November 2018 we had a specific session on ‘Equality matters’ in our early years inspector conference. This session explored the Equality Act 2010, providing a reminder for inspectors of their responsibilities under this legislation when inspecting equality. There was also an opportunity for inspectors to reflect on their inspection practice. This module is now part of our ongoing induction training for all new early years inspectors.
Induction training for new school inspectors includes a focus on considering different groups of pupils, including those who have protected characteristics, during inspection. The second phase of inspectors’ induction training explores the legislation and implications for inspection for pupils who have SEND. New inspectors also receive training on the requirements set out in legislation. This is so that they know the parameters of the Equality Act 2010.
In further education and skills, methodology training for new inspectors includes how to inspect the ‘culture of safeguarding’ as a wider team member, with specific reference to learners who have protected characteristics. In addition, this year there has been specific training for inspectors of high-needs provision to ensure consistency of judgements about inclusion and equality of opportunity.
Training for OIs and HMI on new provider monitoring visits this year included evaluating how providers meet local, national and regional needs. This includes the extent to which they are providing equality of opportunity. This training also included information about how to establish whether an apprenticeship provides appropriate opportunities for apprentices to develop their understanding of equalities and diversity.
Social care
Social care inspector induction training includes case discussions about assessing the different characteristics of children, including protected characteristics.
In addition to the all staff and inspector training mentioned above, over the last 12 months, there has also been specific training and guidance for social care inspectors on disability awareness (specifically autism), sex and relationships education, and on mental health and positive environments for children.
Ensure that we consider those with protected characteristics when setting and carrying out our research and analysis programmes
Our 2-year ongoing research programme includes considering matters relating to those with protected characteristics routinely. Associated reports and other publications include findings relating to those with protected characteristics when they are significant.
What we have done over the last year
We have carried out a survey among early years inspectors about what ‘preparing children for life in modern Britain’ looks like for early years. This will inform inspector training.
We carried out new analysis on pupil movements and off-rolling. This highlighted that children with SEND, children eligible for free school meals, children looked after, and some minority ethnic groups are all more likely to leave their secondary school between Years 10 and 11. This analysis helps to inform our inspections of schools and our inspections of services for pupils with SEND in a local area.
We looked at how characteristics such as ethnicity and deprivation influence pupils’ chance of attending a good school. Our deprivation analysis showed that White British pupils eligible for free school meals were less likely to attend a good or outstanding school than their peers.
Also, we have been researching how behaviour is managed in schools. We published a commentary on this in September 2019 and plan to do further work in the coming year. The work will clearly have regard for children with SEND and other distinct groups of children
Our research in the year ahead will continue to consider those with protected characteristics. We intend, for example, to carry out research on how schools are developing and promoting respect between pupils and parents with different protected characteristics, particularly sexual orientation, gender and faith. The results of this project will help inspectors to continue making informed inspection judgements related to the complex area of equalities in schools.
Update against success criterion: ‘inspectors report non-compliance with the Equality Act 2010 when encountered’
Inspection reports are not exhaustive descriptions of all that happens on an inspection. Inspectors may discuss compliance with the Equality Act 2010, for example, but it may not feature in the final report because there were neither concerns raised nor particularly notable practice.
We have continued to refer to Equality Act compliance in state-funded schools reports over the last year, including both examples of good compliance and failure to comply. Maintained schools are required to comply with PSED, which places greater obligations on public bodies than private entities. In 2018–19, we reported, for example, on a school that failed in compliance in relation to its SEND pupils.
In another school in the South East, we reported on unlawful sex segregation. This followed with the Court of Appeal’s ruling in the Al-Hijrah School case in October 2017. In line with that ruling, schools that might be affected had until September 2018 to amend their practices. Since September 2018, any independent or publicly funded co-educational school that is treating pupils less favourably by segregating them by sex has been considered to be in breach of the Equality Act 2010.
Inspectors of independent schools report against specific requirements relating to equality and diversity. Notably, they report against the expectation that teaching will not undermine fundamental British values and that personal, social and emotional development should encourage respect for others, paying due regard to the protected characteristics. They also report on the extent to which proprietors ‘actively promote’ fundamental British values. The Independent School Standard 3(j) expects inspectors to report on whether a school discriminates against pupils contrary to part 6 of the 2010 Act.
We have inspected a number of independent schools in the last year that we have judged to be inadequate partly due to equalities, diversity and inclusion issues. We reported on a school in London, for example, that failed to teach about the protected characteristics and on another in the North East Yorkshire and Humber that had been segregating by sex unlawfully.
There has been less reporting of Equality Act compliance in early years and social care reports, although there were some examples. These include reporting on a fostering service in which staff had not carried out relevant equality and diversity training.
Objective 2
Ofsted will promote equal opportunities for its entire workforce, including both staff and directly contracted Ofsted Inspectors, tackling bullying and discrimination whenever it occurs
This objective is broken down into 3 parts. The numbering relates to that within our 2017–20 equality objectives.
2.1. Ofsted will continue to increase the diversity of its workforce.
2.2. Ofsted will continue to increase the diversity within its Senior Civil Service.
2.3. Ofsted will tackle unfair treatment and inappropriate behaviour to reduce the proportion of its staff, particularly those with protected characteristics, experiencing discrimination, bullying and harassment.
Equalities data helps us to identify the diversity of our workforce. This includes data on the protected characteristics as covered by the Equality Act 2010. We ask all staff to declare information about their ethnicity, disability status, sexual orientation and religion or belief. Although we encourage staff to supply it, this is not mandatory and reporting rates vary by characteristic. For those who do not wish to record their diversity data, it is possible to record a ‘prefer not to say’ response.
We have tracked our equalities data over a number of years and this report shows our progress against our published 2017–2020 equality objectives, for the reporting period 2018–2019.
Improving the diversity of our workforce and senior civil servants
The information contained in this section of the report is taken as of 31 March 2018 and 2019, unless otherwise stated. All employee numbers throughout the report are shown as a headcount, unless otherwise stated. We define employees as those on a permanent or fixed-term contract, and those who are seconded in or on loan to us on a full-time basis. Please note that percentages in all following sections have been rounded and may not add up to 100.
Unless otherwise stated, we have sourced all wider Civil Service comparisons from the Annual Civil Service Employment Survey (31 March 2018) produced by the Office for National Statistics. General population comparisons are provided through the 2011 census. The 2011 census records information on individuals who are usual residents of the UK and associated areas.
For Figures 1, 3, 4, 5 and 7, the columns in bold colours represent the proportions of the relevant characteristic in each grade as of 31 March 2019 and the columns in faded colours represent these same proportions as of 31 March 2018.
Ethnicity profile
Figure 1: Ethnicity breakdown by APT grade
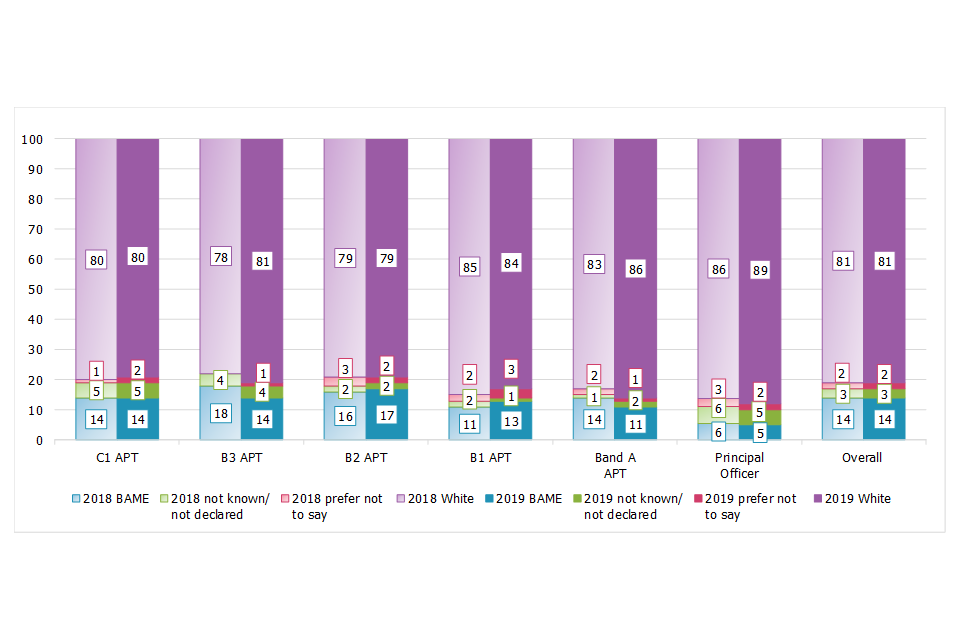
Chart showing APT grades split by BAME, White, not known or declared and prefer not to say. This chart compares these demographics as at 31 March 2019 and 2018.
Figure 2: Ethnicity breakdown by SCS grade
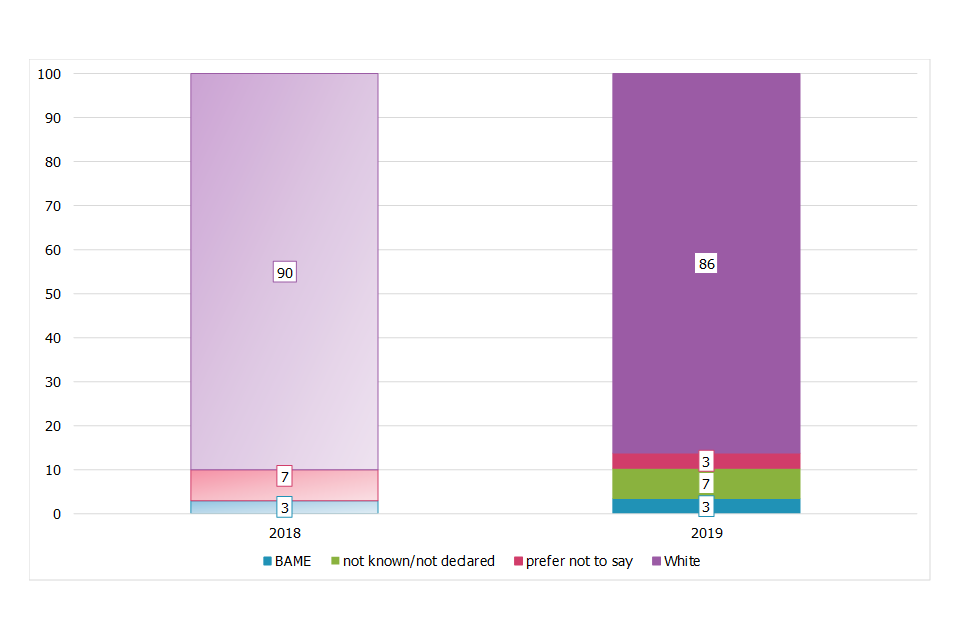
Chart showing senior civil servant grades split by BAME, White, not known or declared and prefer not to say. This chart compares these demographics as at 31 March 2019 and 2018.
BAME includes Black, Asian, Mixed and other ethnic backgrounds. White includes White and Other White.
Figure 3: Ethnicity breakdown by inspector grade
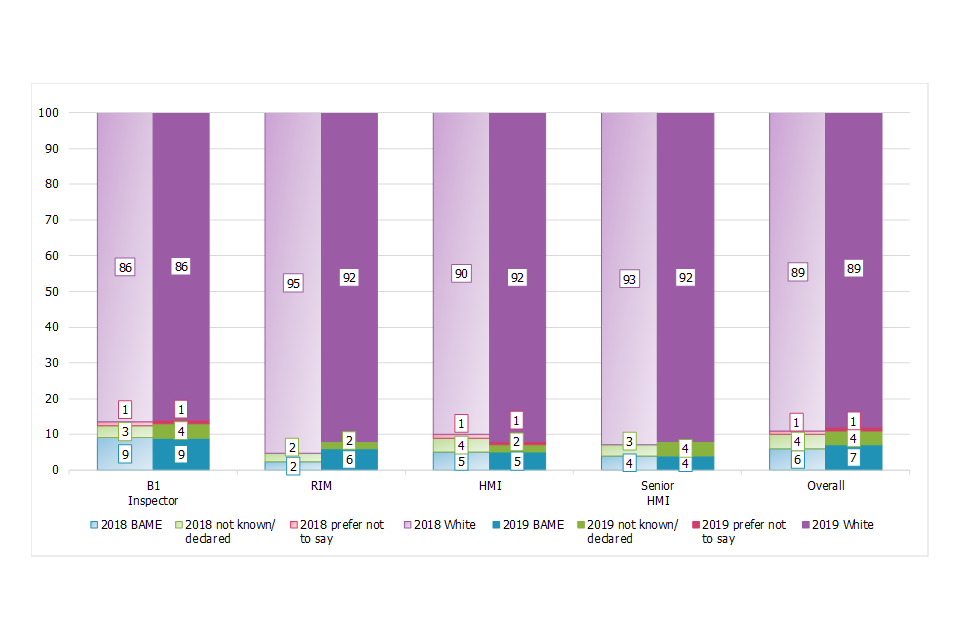
Chart showing inspection grades split by BAME, White, not known or declared and prefer not to say. This chart compares these demographics as at 31 March 2019 and 2018.
Figure 4: Ofsted compared with Civil Service – Black, Asian, minority ethnic percentage by grade (if declared)
| Grade | Ofsted March 2018 | Ofsted March 2019 | Civil Service March 2018 | Civil Service March 2019 |
|---|---|---|---|---|
| C1 APT | 15 | 14 | 12 | 12 |
| B3 APT | 19 | 15 | 14 | 14 |
| B2/B1 APT | 14 | 16 | 11 | 11 |
| B2 Inspector | 9 | 13 | Specialist grade, no relevant comparator data available from the wider Civil Service | Specialist grade, no relevant comparator data available from the wider Civil Service |
| B1 Inspector | 9 | 9 | Specialist grade, no relevant comparator data available from the wider Civil Service | Specialist grade, no relevant comparator data available from the wider Civil Service |
| Band A APT/Principal Officer | 12 | 9 | 9 | 9 |
| Regulatory Inspection Manager (RIM) | 2 | 6 | Specialist grade, no relevant comparator data available from the wider Civil Service | Specialist grade, no relevant comparator data available from the wider Civil Service |
| HMI | 5 | 6 | Specialist grade, no relevant comparator data available from the wider Civil Service | Specialist grade, no relevant comparator data available from the wider Civil Service |
| Senior HMI | 4 | 4 | Specialist grade, no relevant comparator data available from the wider Civil Service | Specialist grade, no relevant comparator data available from the wider Civil Service |
| SCS | 4 | 4 | 7 | 8 |
All employee numbers in Figure 4 only include active declarations and does not include ‘Not known’ or ‘Not declared’. When grades are combined, this is to ensure that the data is comparable to the Civil Service data set.
The overall percentage of BAME APT employees, including at SCS level, is 14% (see Figure 1). This aligns to the proportion of BAME employees according to the 2011 United Kingdom census figure (14%) and continues to compare favourably with the overall Civil Service figure of 12%. Our percentage of BAME employees is higher at all grades than the wider Civil Service, with the exception of SCS.
The percentage of employees who have declared their ethnicity as BAME within our inspector grades is 7% (see Figure 3). To improve the diversity within our inspector grades, we have continued to run HMI shadowing programmes. The programmes have included:
- working in partnership with specific local authorities to identify middle and senior BAME leaders
- delivering targeted development sessions in partnership with existing BAME development programmes
Improving our understanding of the diversity of our contracted workforce has also been an area of focus this year. We directly contract with individuals to carry out inspections of early years, schools and further education and skills provisions. These contracted inspectors are known as Ofsted Inspectors (OIs). This year, we have updated our inspector self-service portal (Cygnum) to ensure that OIs have a confidential and safe space to record their equalities information. This will help us to more accurately report on the diversity of our OI workforce. We will report on these figures and any action we are taking as a result in next year’s progress report.
We are also continuing to take steps to improve the diversity of our most senior grades. We have taken part in the cross-government Race to the Top G6/7 shadowing scheme. This programme aims for participants to observe senior leadership first-hand. It also offers opportunities to discuss leadership approach, the complexities of senior roles and success factors for leadership at the next level. The diversity of our senior grades is in part impacted by the lack of diversity of the sectors from which we recruit. We continue to advertise all SCS posts externally by default.
We continue to use social media such as LinkedIn and Twitter as recruitment channels. These provide additional platforms for us to connect with a diverse range of candidates who want to work for Ofsted. We continually review recruitment data, such as monitoring the recruitment stages reached by protected characteristics, to identify trends and further areas of improvement.
Our 2018 People Survey engagement scores for BAME staff are:
- Black/Black British 63%
- Asian/Asian British 73%
- mixed 68%
The overall Ofsted engagement score is 68% and White British is 70%.
Our Ethnic Equalities network has continued to raise awareness of diversity through its communications activities. The network has a strong presence on Ofsted’s internal social media platform, where it has shared a podcast on the importance of BAME representation in the media and discussed topics such as discrimination based on natural hair styles. The network also led its annual Black History Month campaign in October 2018, where members shared 18 articles throughout the month under the themes ‘moments from history’, ‘inspiring people’, ‘important work’ and ‘cultural inspirations’.
One of the network’s areas of focus has been raising awareness of career development opportunities to BAME colleagues to support individual career progression. The network regularly shares career development opportunities and learning resources. The network will continue to focus on this area in the 2019–20 reporting period, including releasing an animation and blog series on this topic.
Gender profile
Figure 5: Gender breakdown by grade
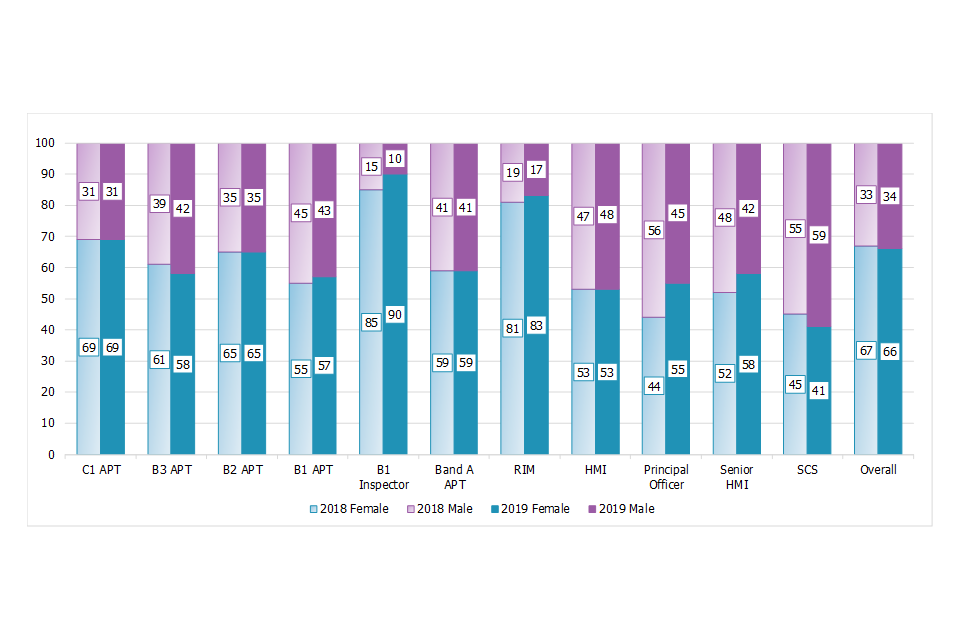
Chart showing all grades split by female and male. This chart compares these demographics as at 31 March 2019 and 2018.
Our overall female gender profile has remained stable, with a small decrease from 67% to 66%. Ofsted’s gender profile continues to be higher than the Civil Service average of 54% and the UK average of 51%. The proportion of women working at SCS level has decreased from 45% to 41%, which is broadly in line with the Civil Service figure of 42%.
We monitor the difference in average earnings between men and women. Our 2018 gender pay gap report showed that the mean gender pay gap had increased from 8.1% to 11.4% in favour of men. The median gender pay gap also increased 2.3% to 19.8% in favour of men.
The main reason for this pay gap is the higher proportion of female employees in certain, often lower, grades. The insourcing of early years inspection on 1 April 2017, which brought in a workforce of 253 people, impacted our 2018 gender pay gap. Of these 253 people, 94% were female, most of whom were in lower grades.
We operate a spot-rate model that sets a single salary for each grade and supports equal pay for equal work. By not having pay ranges, we avoid the pay inequality that can arise from the ability to negotiate salaries or from pay being linked to length of service.
We are committed to fair pay irrespective of gender. We will continue to promote policies and initiatives that support equal opportunities for our entire workforce.
Disability profile
Figure 6: Disability breakdown by grade
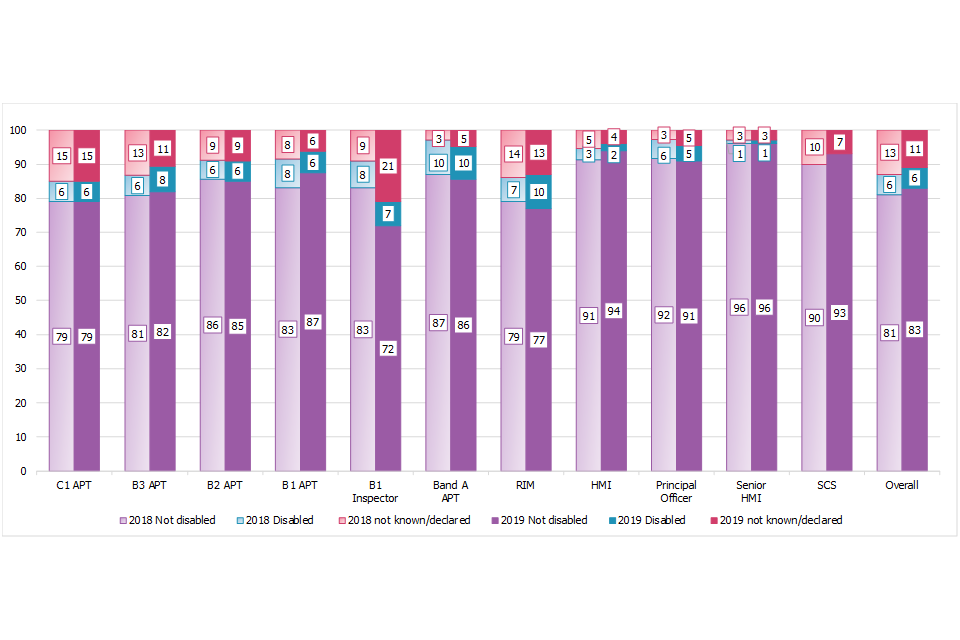
Chart showing all grades split by disabled, not disabled and not known or declared. This chart compares these demographics as at 31 March 2019 and 2018.
Our overall disability profile has remained the same, at 6%, and continues to be below the Civil Service average of 10%. The overall percentage of ‘Not known/Not declared’ has decreased by 2 percentage points to 11% this year.
Our Disability at Work network has continued to support the business to raise awareness of disabilities and create an environment that is truly inclusive. This network is also very active on our internal social media platform. It uses this to share information from central Civil Service disability networks, to share research and to raise awareness of different disabilities. Members also advertise disability related events organised by different departments.
An area of focus for the network has been providing advice and support on accessibility considerations. For example, it has fed into projects such as moving our early years workforce to the Cygnum platform and updating Ofsted’s recruitment sites, electronic evidence gathering and our Disability Confident self-assessment. The network also commissioned the development of a new ‘Managing cancer in the workplace’ e-learning package for managers. It developed the package in the last quarter of the financial year and we published it at the beginning of 2019–20.
Our mental health first aiders (MHFA) scheme is now well established. We have a total of 57 fully trained MHFAs, who are a point of contact for anyone who is experiencing a mental health issue or emotional distress.
We are a Disability Confident Employer, as part of the government’s Disability Confident scheme. The government has designed this scheme to help employers recruit and retain people with disabilities and long-term health conditions, and to make the most of the talents that they bring to the workplace.
Age profile
Figure 7: Age breakdown by grade
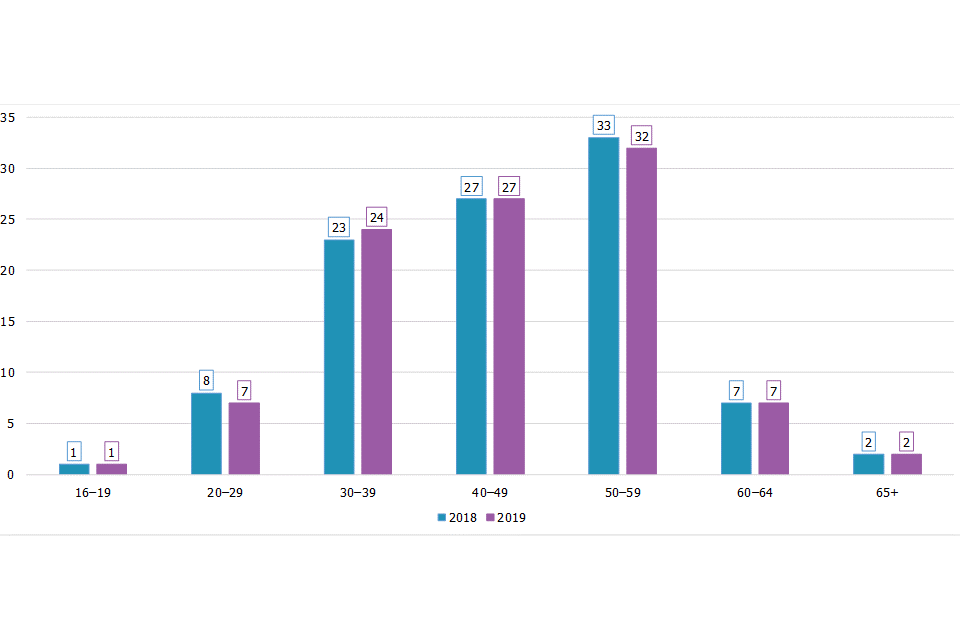
Chart shows comparison between age groups as at 31 March 2018 and 2019. Age groups included are 16-19, 20-29, 30-39, 40-49, 50-59, 60-64, 65+
Civil Service figures show that the majority of civil servants (78%) are aged between 30 and 59. At 83%, Ofsted is broadly in line with this. The full breakdown of our age profile by grade can be found in Annex B.
This year has seen a reduction in the number of HMI, Education in the 60+ age bracket. In the HMI, Education workforce, 41% are now aged 49 or under. This is in contrast to the other remits where the HMI age profile has been largely unchanged in recent years.
Sexual orientation profile
Figure 8: Sexual orientation breakdown by grade
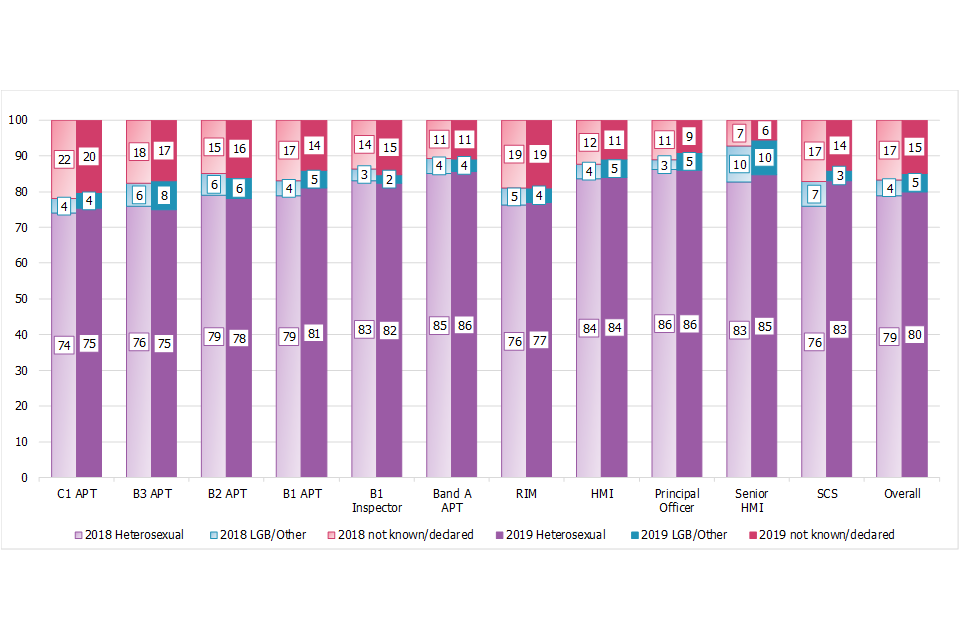
Chart showing all grades split by heterosexual, LGB or other, and not known or declared. This chart compares these demographics as at 31 March 2019 and 2018.
The external data set used as the comparator elsewhere in this report does not include information on sexual identity and so there is no comparator for this section. Our People Survey 2018 results showed a 71% engagement score for lesbian, gay and bisexual respondents, compared with the overall Ofsted average of 68%.
Throughout the year, we have worked to raise LGBT+ awareness and create further support for our LGBT+ colleagues.
Ofsted joined the Stonewall Diversity Champions programme in March 2018. The Ofsted Rainbow Alliance (our LGBT+ network) led work to respond to Stonewall’s Workplace Equalities Index, the scope of which included Ofsted systems, policies and processes. The Rainbow Alliance ambassadors, who are visible, identifying leaders of the network, support these activities and they remain an area of focus for the group into 2019–20.
The network led a series of webinars on a range of topics during the year. This has included: a panel in support of International Day Against Homophobia, Biphobia and Transphobia; a session with an external speaker on being bisexual in a Civil Service workplace; and a joint session with leaders from a Jewish school outlining how LGBT+ students are supported there. These have been well received and the network has committed to continuing this programme of webinars.
The network also celebrated LGBT history month during February. This included: a series of face-to-face events on LGBT history relating to our local offices with fundraising opportunities for LGBT+ charities; weekly quizzes on LGBT history; a photo competition focused on ‘Peace, activism and reconciliation’; and weekly articles on important figures from LGBT history.
Religion/belief profile
Figure 9: Religious breakdown by grade
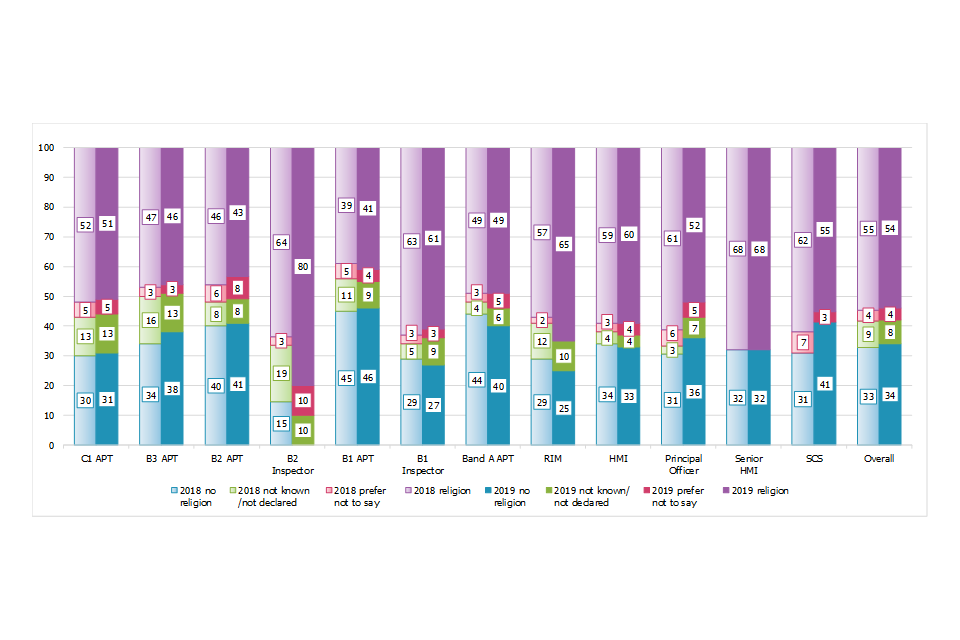
Chart showing all grades split by no religion, religion, not known or declared and prefer not to say. This chart compares these demographics as at 31 March 2019 and 2018.
The 2011 census indicates that 59% of the population are Christian, followed by 25% with no religion. In Ofsted, 46% of staff identify as Christian, followed by 34% with no religion. Two per cent of Ofsted staff identify as Muslim, which is less than the census figures of 5%. However, our workforce is reflective of the general population figures for Hindu (2%), Sikh (1%), Jewish and Buddhist (under half a percent each). The full breakdown of the proportion of each faith by grade can be found in Annex C .
Our People Survey engagement scores across the different religions within Ofsted are: Christianity 73%, Hindu 80%, Muslim 70% and any other religion 70%. The overall Ofsted average is 68%.
Our Religion and Faith network has continued to promote the importance of interfaith activities and ran a personal essay campaign during Inter Faith week. We launched this ahead of Remembrance Sunday and published a reflective piece on the involvement of a range of faith groups. This piece continued with themes such as: birth and pregnancy rituals; religious clothing and symbols; impactful people of faith; and the need for religious freedom. The network also published a reference guide listing where prayer and reflection spaces are available across the Ofsted offices.
Recruitment and development throughout 2018–19
Figure 10: Recruitment stages reached by applicant type for SCS and inspection posts

Chart showing recruitment data for administrative, professional and technical staff as at 31 March 2019. This is broken down by stage during the recruitment process, applicant type, gender, ethnicity, sexual orientation and disability.
Internal candidates continue to be more successful at each stage of the recruitment process for SCS and inspection posts than external applicants. There has been a 9 percentage point increase in the proportion of external applicants compared with 2017–18 and the majority of appointments have been external candidates. Due to the specialist nature of inspection posts, these roles tend to be recruited from internal candidates or specific sectors, rather than the wider Civil Service.
The percentage of applications from men and women has remained stable. Women continue to be more successful than men at each stage of the recruitment process, with the majority of appointments (73%) being women.
The percentage of lesbian, gay and bisexual appointments has increased from 7% to 11% compared with last year. We have also seen a 5 percentage point reduction in applicants who chose not to disclose their sexual orientation.
The percentage of candidates with a declared disability at each stage of the recruitment process has remained stable, with the number of appointed candidates with a disability seeing a small increase to 5% this year.
Figure 11: Recruitment stages reached by applicant type for APT posts

Chart showing recruitment data for administrative, professional and technical staff as at 31 March 2019. This is broken down by stage during the recruitment process, applicant type, gender, ethnicity, sexual orientation and disability.
For our APT roles, the proportion of men and women at each of the recruitment stages has remained largely the same when compared with last year. Women continue to make up the majority of those appointed, increasing by 10 percentage points from last year.
The proportion of external applicants for APT roles remained the same as 2017–18, although there was a 5 percentage point increase in the proportion of candidates applying from the wider Civil Service. Internal candidates continued to be more successful at each stage of the recruitment process.
There has been a 5 percentage points increase in the number of BAME candidates applying and a marginal (2 percentage point) decrease in the number of BAME candidates appointed. However, White candidates are still disproportionately successful at each stage of the recruitment process. We use blind sifting for all our applications to reduce any unconscious bias.
The number of applications received by disabled candidates has increased by 3 percentage points, and the proportion of those appointed by 4 percentage points, when compared with last year.
Eliminating discrimination, bullying and harassment
Results from the 2018 People Survey indicated that reports of discrimination have increased by 2 percentage points to 12%. The reported bullying and harassment scores have decreased by 2 percentage points to 6%.
The anti-bullying, harassment and discrimination working group has been addressing this. The equalities networks and our trade unions are represented in this working group.
In June 2018, the group supported the ‘Stand-up to bullying’ day. It has also worked with the HR Strategy team to inform and contribute to the review of Ofsted’s grievance policy and procedure, and anti-bullying, harassment, discrimination and victimisation policy statement.
In November 2018, we launched Ofsted’s ‘Equalities and unconscious bias’ training package. This training is mandatory for all staff.
Annexes
Annex A – Ofsted grade structure
Ofsted’s current grade structure broadly compares with the wider Civil Service grades, as outlined in the table below.
APT job family:
- Senior Civil Service
- Principal Officer
- CS equivalent – Grade 6
- Band A APT
- CS equivalent – Grade 7
- B1 APT
- CS equivalent – Senior Executive Officer
- B2 APT
- CS equivalent – Higher Executive Officer
- B3 APT
- CS equivalent – Executive Officer
- C1 APT
- CS equivalent – Administrative Officer
Inspector job family:
- Senior Civil Service
- Senior HMI
- CS equivalent – Grade 6
- HMI
- CS equivalent – Grade 7
- RIM
- CS equivalent – Grade 7
- B1 Inspector
- CS equivalent – Senior Executive Officer
- B2 Inspector
- CS equivalent – Higher Executive Officer
Annex B – Age declaration by grade from 31 March 2018 and 31 March 2019
March 31 2019 - Percentage of employees in age categories
| Grade | 16–19 | 20–29 | 30–39 | 40–49 | 50–59 | 60–64 | 65+ | Not known/ not declared | Total number of employees |
|---|---|---|---|---|---|---|---|---|---|
| All grade | 1 | 7 | 24 | 27 | 32 | 7 | 2 | - | 1,685 |
| C1 APT | 5 | 18 | 27 | 18 | 23 | 6 | 2 | - | 251 |
| B3 APT | - | 19 | 37 | 26 | 13 | 4 | 2 | - | 198 |
| B2 APT | - | 14 | 47 | 20 | 13 | 4 | - | - | 173 |
| B1 APT | - | 7 | 42 | 31 | 16 | - | - | - | 159 |
| B1 Inspector | - | - | 12 | 32 | 44 | 11 | - | - | 334 |
| Band A APT | - | - | 40 | 40 | 18 | - | - | - | 83 |
| RIM | - | - | - | 42 | 52 | - | - | - | 52 |
| HMI | - | - | 4 | 27 | 54 | 11 | 5 | - | 280 |
| Principal Officer | - | - | 34 | 30 | 30 | - | - | - | 44 |
| Senior HMI | - | - | - | 26 | 57 | 15 | - | - | 72 |
| SCS | - | - | - | 31 | 52 | - | - | - | 29 |
March 31 2018 - Percentage of employees in age categories
| Grade | 16–19 | 20–29 | 30–39 | 40–49 | 50–59 | 60–64 | 65+ | Not known/ not declared | Total number of employees |
|---|---|---|---|---|---|---|---|---|---|
| All grades | 1 | 8 | 23 | 27 | 33 | 7 | 2 | - | 1,763 |
| C1 APT | 6 | 20 | 27 | 18 | 22 | 6 | - | - | 265 |
| B3 APT | - | 22 | 34 | 24 | 15 | 3 | - | - | 203 |
| B2 APT | - | 19 | 45 | 19 | 13 | 3 | - | - | 181 |
| B1 APT | - | 4 | 39 | 37 | 16 | - | - | - | 142 |
| B1 Inspector | - | - | 13 | 31 | 47 | 8 | - | - | 265 |
| Band A APT | - | - | 44 | 36 | 15 | - | - | - | 94 |
| RIM | - | - | - | 38 | 57 | - | - | - | 42 |
| HMI | - | - | 5 | 28 | 49 | 13 | 4 | - | 300 |
| Principal Officer | - | - | 17 | 42 | 36 | - | - | - | 36 |
| Senior HMI | - | - | - | 28 | 59 | 12 | - | - | 69 |
| SCS | - | - | - | 34 | 45 | - | - | - | 29 |
| Senior HMI | - | - | - | 26 | 57 | 15 | - | - | 72 |
| SCS | - | - | - | 31 | 52 | - | - | - | 29 |
Percentages are rounded and may not add to 100.
Percentages that round down to zero or are calculated with fewer than 5 individuals are not shown in this table and are instead represented by a dash.
Percentages that are less than 1% but represent 5 or more individuals are represented by <1.
Annex C – Breakdown of religion and faith declaration by grade from 31 March 2018 and 31 March 2019
March 31 2019 - Percentage of employees in faith categories
| Response | Total number of employees | C1 APT | B3 APT | B2 APT | B1 APT | B1 Inspector | Band A | APT | RIM | HMI | Principal Officer | Senior HMI | SCS |
|---|---|---|---|---|---|---|---|---|---|---|---|---|---|
| Overall | 1,685 | 251 | 198 | 173 | 159 | 334 | 83 | 52 | 280 | 44 | 72 | 29 | |
| Not known/not declared | 8 | 13 | 13 | 8 | 9 | 9 | 6 | 10 | 4 | - | - | - | |
| Prefer not to say | 4 | 5 | 3 | 8 | 4 | 3 | - | - | 4 | - | - | - | |
| No religion | 34 | 31 | 38 | 41 | 46 | 27 | 40 | 25 | 33 | 36 | 32 | 41 | |
| Other religion | 2 | 3 | 5 | 3 | - | 1 | - | - | - | - | - | - | |
| Buddhist | <1 | - | - | - | - | - | - | - | - | - | - | - | |
| Jewish | - | - | - | - | - | - | - | - | - | - | - | - | |
| Sikh | 1 | - | - | - | - | - | - | - | - | - | - | - | |
| Hindu | 2 | 3 | 3 | 3 | - | - | - | - | - | - | - | - | |
| Muslim | 2 | 4 | 5 | 3 | - | - | - | - | 2 | - | - | - | |
| Christian | 46 | 40 | 34 | 32 | 24 | 57 | 41 | 60 | 56 | 48 | 68 | 55 |
March 31 2018 - Percentage of employees in faith categories
| Grade | Total number of employees | C1 APT | B3 APT | B2 APT | B1 APT | B1 Inspector | Band A | APT | RIM | HMI | Principal Officer | Senior HMI | SCS |
|---|---|---|---|---|---|---|---|---|---|---|---|---|---|
| Overall | 1,763 | 265 | 203 | 181 | 142 | 265 | 94 | 42 | 300 | 36 | 69 | 29 | |
| Not known/not declared | 9 | 13 | 16 | 8 | 11 | 5 | - | 12 | 4 | - | - | - | |
| Prefer not to say | 4 | 5 | 3 | 6 | 5 | 3 | - | - | 3 | - | - | - | |
| No religion | 33 | 30 | 34 | 40 | 45 | 29 | 44 | 29 | 34 | 31 | 32 | 31 | |
| Other religion | 2 | 3 | 4 | 3 | - | - | - | - | - | - | - | - | |
| Buddhist | - | - | - | - | - | - | - | - | - | - | - | - | |
| Jewish | - | - | - | - | - | - | - | - | - | - | - | - | |
| Sikh | 1 | - | - | - | - | - | - | - | - | - | - | - | |
| Hindu | 2 | 3 | 3 | 3 | - | - | - | - | - | - | - | - | |
| Muslim | 2 | 3 | 3 | 4 | - | - | - | - | - | - | - | - | |
| Christian | 48 | 42 | 33 | 35 | 35 | 60 | 38 | 52 | 56 | 58 | 68 | 62 |
Percentages are rounded and may not add to 100.
Percentages that round down to zero or are calculated with fewer than 5 individuals are not shown in this table and are instead represented by a dash
Percentages that are less than 1% but represent 5 or more individuals are represented by <1.
Annex D – B2 inspector protected characteristic breakdown
Because the B2 inspector grade is only a legacy grade, the numbers remaining within this grade are very low. As such, we have removed them from the main report, but their protected characteristics are shown below.
| Response | Percentage of B2 inspector employees in category |
|---|---|
| Heterosexual | - |
| LGB/Other | - |
| Sexual orientation not known/declared | 60 |
| Not disabled | - |
| Disabled | - |
| Disability status not known/declared | 70 |
| Female | 90 |
| Male | - |
| BAME | - |
| Ethnicity not known/declared | - |
| Ethnicity prefer not to say | - |
| White | 70 |
| No religion | - |
| Religion not known | - |
| Religion prefer not to say | - |
| Religion | 80 |
Percentages are rounded and may not add to 100.
Percentages that round down to zero or are calculated with fewer than 5 individuals are not shown in this table and are instead represented by a dash
Percentages that are less than 1% but represent 5 or more individuals are represented by <1.