Northern Ireland Key Findings Report Food and You 2: Wave 11
Published 28 August 2026
Applies to England, Northern Ireland and Wales

© Crown copyright 2026
This publication is licensed under the terms of the Open Government Licence v3.0 except where otherwise stated. To view this licence, visit nationalarchives.gov.uk/doc/open-government-licence/version/3 or write to the Information Policy Team, The National Archives, Kew, London TW9 4DU, or email: psi@nationalarchives.gov.uk.
Where we have identified any third party copyright information you will need to obtain permission from the copyright holders concerned.
This publication is available at https://www.gov.uk/government/publications/northern-ireland-key-findings-report--food-and-you-2-wave-11/northern-ireland-key-findings-report-food-and-you-2-wave-11
1. Executive Summary
Food and You 2 is an annual official statistic survey commissioned by the Food Standards Agency (FSA). The survey measures consumers’ self-reported knowledge, attitudes and behaviours related to food safety and other food-related topics among adults aged 16 or over, in England, Wales, Northern Ireland and Scotland [footnote 1]. This report primarily focuses on findings for Northern Ireland [footnote 2] and presents findings from Wave 11 while describing key trends across Wave 1 (July–October 2020) to Wave 11 (May–August 2025) where data is available.
1.1 Key findings
The following section outlines the key findings for respondents in Northern Ireland from Food and You 2.
Food security
In Wave 11, 78% of respondents were classified as food secure, and 22% were classified as food insecure. Food security declined notably from 85% in Wave 1 to 73% in Wave 8, before increasing slightly and remaining broadly stable through to Wave 11.
In Wave 11, 5% of respondents said that they or someone in their household had received a free parcel from a food bank or other emergency food provider in the previous 12 months, a slight increase from 3% in Wave 9, and broadly in line with levels seen in earlier waves.
Eating out and takeaways
Lunch and dinner continued to be the most common occasions for eating out or purchasing takeaway food, with 80% and 90% doing so respectively in Wave 11. The proportion doing so at least once a week (25% for lunch and 31% for dinner) has remained broadly stable since Wave 4.
Among those who ate out or ordered takeaways, quality of food (82% eating out; 77% takeaway) and previous experience (78% eating out; 80% takeaway) were the most important factors respondents consider when eating out and ordering takeaways.
Healthy eating
Supplement use
Around half of respondents (48%) in Wave 11 reported taking vitamin and/or mineral supplements, with the most commonly reported being multivitamins or minerals (52%), Vitamin D (40%), magnesium (33%) and fish oils/Omega-3 (30%).
Among respondents who took vitamin and/or mineral supplements, general health and wellbeing (68%) was the most commonly reported reason for vitamin and/or supplement consumption, followed by age-related reasons (29%), tiredness (22%), and to improve or fortify their diet (22%).
Diet and nutrition
In Wave 11, 72% of respondents reported making at least one change to their diet for health reasons in the last 12 months. The most common changes were eating less processed food (46%), eating more fruit and vegetables (45%), and eating less sugar or food/drink high in sugar (44%).
In Wave 11, 71% of respondents reported they ate fruit and/or vegetables every day or most days, while 41% said they ate sweets or chocolate every day or most days and 33% said they drank sugary fizzy drinks or diluted squash every day or most days.
Food shopping
Important factors when shopping
Most respondents in Wave 11 checked for use-by dates (87%) and best-before dates (83%) often while food shopping.
Price/value for money (54%) and quality (43%) remain the most important factors when choosing food.
Promotions
The majority of respondents (92%) in Wave 11, reported buying food or drink on promotion in the past two weeks.
Of these respondents, the most common promotions used were loyalty or membership discounts (75%), lower price offers (65%) and multi-buy promotions (58%).
In addition to these key topics, the report also captures latest findings for Northern Ireland in relation to trust and confidence in food safety, food authenticity and in the FSA as a regulator. This report also includes latest insights on food hypersensitivities, and food hygiene in the home.
2. Acknowledgements
First and foremost, our thanks go to all the respondents who gave up their time to take part in the survey.
We would like to thank the team at Ipsos who made a significant contribution to the project, particularly Dr Ammeline Wang, Claire Bhaumik, Aamina Oughradar, Stephen Finlay, Hannah Harding, Kelly Ward, Kevin Pickering, Dr Patten Smith. We would like to thank FSA Northern Ireland colleagues, Naomi Davidson, Dr Brídín Nally, Cathy Hopkins and Zoe Murdock, for their time reviewing the report.
Authors: Rachael Shillitoe, Robin Clifford, Matt Jenkins.
3. Introduction
3.1 The Food Standards Agency: role, remit, and responsibilities
The Food Standards Agency (FSA) is a non-ministerial government department working to protect public health and consumers’ wider interests in relation to food in England, Wales, and Northern Ireland. In Northern Ireland, the FSA is one of the Government organisations responsible for nutrition surveillance and policy development.
The FSA’s overarching mission is ‘food you can trust’. The FSA’s vision as set out in the 2022-2027 strategy is a food system in which:
- Food is safe
- Food is what it says it is
- Food is healthier and more sustainable
3.2 Food and You 2: Waves 1-11
Food and You 2 is the FSA’s official statistic survey. It is designed to monitor progress against the FSA’s mission and vision, and to inform policy decisions by measuring consumers’ self-reported knowledge, attitudes and behaviours relating to food safety and other food-related topics in England, Wales and Northern Ireland.
Wave 11 marks the first in the annual series of Food and You 2, from formerly being biannual between Waves 1-10.
Unless otherwise stated, this report presents findings for respondents in Northern Ireland only. It draws primarily on Wave 11 data, with trend data from Waves 1 to 11 included for selected topics. Wave 11 data were collected between 19th May 2025 and 7th August 2025. A total of 1,564 adults (aged 16 years and over) from 1,082 households in Northern Ireland completed the survey (an overall response rate of 23.1%). For a summary of fieldwork dates, please see Appendix A.
Previous publications in the Northern Ireland Food and You 2 series can be found here.
3.3 Interpreting the findings
Not all survey questions are included in this report. The findings presented focus on core strategic indicators and key evidence areas. The topics covered in the report, including the selection of trends and subgroup analysis, were agreed through a scoping process based on FSA evidence needs and reporting priorities. A full list of questions included in this report is provided in Appendix B. Full results from Wave 11, and all previous waves, are available in the accompanying data set and tables. Further information on the survey’s history, methodology and modules can be found in the Wave 11 report and accompanying technical report.
Graphs are included where they help to present the findings more clearly, for example where trends over time are more varied or where questions have multiple response options. Where findings are stable or show little change across waves, they are usually described in the text to keep the report concise.
Reporting conventions
Percentage calculations are based only on those who responded to each question. Reported values and calculations are based on weighted totals. Key information is provided for each reported question in Appendix B , including:
- Question wording (question) and response options (response).
- Number of respondents presented with each question and description of the respondents who answered the question (Unweighted base= N).
Reporting approach
This report presents both wave specific findings and, in some cases, trends over time. Wave specific findings are based on the most recent survey wave, Wave 11 (conducted Spring/Summer 2025).
Trends
Trend analysis is generally presented for key evidence areas where the same question has been asked in at least three survey waves, including Wave 11. However, not all available trend data are included in this report. In some cases, trend findings have been omitted to keep the report concise. For questions asked for the first or second time, only Wave 11 findings are reported. Each chapter clearly indicates whether it includes wave specific findings, trend analysis, or both.
To highlight notable differences, variations in responses are reported whenever the absolute difference is 10 percentage points or larger and is statistically significant at the 5% level (p<0.05).
Where a variation in response between waves is less than 10 percentage points but is judged to be of interest, and is statistically significant at the 5% level, these are reported as slight changes and indicated with a double asterisk (**).
Where there is no significant difference between responses across waves, the pattern of responses is described as being stable.
Demographic analysis
Key demographic variables analysed include age, household income, children in the household, urban/rural location, gender, long term health condition, food security status and Northern Ireland Multiple Deprivation Measure (NIMDM) (see Appendix A for definitions). All demographic differences included in this report are statistically significant at the 5% level and:
- meet a minimum base size of 100
- are considered of interest or meaningful to the FSA
- represent a difference of 10 percentage points or more between the groups
However, some differences between demographic and other sub-groups are included where the difference is less than 10 percentage points, when the finding is notable or judged to be of interest. These differences are indicated with a double asterisk (**).
Other demographic cross breaks are available in the data tables, but are not captured in this report for brevity, because they do not meet these criteria, or because the sub-groups available are too small to draw meaningful conclusions.
Any demographic analysis presented in this report refers to Wave 11 findings only.
Notes on interpretation
This report is based on data from a mixed-mode survey, using both postal and online questionnaires, using a random probability sampling approach. The survey is designed to achieve a sample of 1,000 households in Northern Ireland with weighting applied to support representativeness of the data; including for some groups that may be underrepresented in online only surveys. However, as with all sample surveys, the findings remain subject to sampling uncertainty and potential non-response bias.
The findings are also based on self-reported data. Although the survey design and methodology are intended to help reduce bias, some responses may be affected by social desirability bias (where people provide answers they believe are more socially acceptable) and recall bias (where people do not remember past events or experiences accurately). In addition, some breakdowns are based on small numbers of respondents, which can limit the level of detail that can be reported.
Survey findings should therefore be interpreted alongside other available evidence where relevant. For example, the National Diet and Nutrition Survey (NDNS) can be used as a complementary source of insight on nutritional intakes alongside the self-reported dietary data presented in this report. Further information on the research is available in the technical report.
4. Chapter 1: Food you can trust
4.1 Introduction
This chapter presents an overview of respondents’ trust and confidence in the FSA, as well as their confidence in food safety more broadly from Wave 11 only[footnote 3].
4.2 Confidence in food safety and authenticity
In Wave 11, 92% of respondents were confident (i.e. were very confident or fairly confident) that the food they buy is safe to eat, and 84% were confident that the information on food labels is accurate (see Appendix B, Q1).
4.3 Trust and confidence in the FSA
Respondents who had at least some knowledge of the FSA[footnote 4] were asked how much they trusted the FSA to do its job, that is to make sure food is safe and what it says it is. Around 8 in 10 (81%) of these respondents in Wave 11 reported that they trusted the FSA to do this (see Appendix B, Q2). A further 15% reported that they ‘neither trust nor distrust’ the FSA, while 1% reported they distrusted the FSA.
In Wave 11, 84% of respondents were confident (very or fairly) that the FSA (or the government agency responsible for food safety) can be relied upon to protect the public from food-related risks, such as food poisoning or allergic reactions. Confidence was also high that the FSA is committed to communicating openly with the public about food-related risks (80%) and that the FSA takes appropriate action when a food-related risk is identified (83%) (see Appendix B, Q3).
5. Chapter 2: Food security
5.1 Introduction
This chapter reports on levels of food security in Northern Ireland, using latest data from Wave 11, and trends over time. It also includes differences between demographic groups and the use of food banks, with comparisons to England and Wales where relevant.
“Food security exists when all people, at all times, have physical and economic access to sufficient, safe and nutritious food that meets their dietary needs and food preferences for an active and healthy life.” World Food Summit, 1996.
Food and You 2 uses the U.S. Adult Food Security Survey Module developed by the United States Department of Agriculture (USDA) to measure consumers’ food security with respondents classified as either having high, medium, low or very low food security. For further details of these categories, please see Appendix A. Those with high or marginal food security are referred to as food secure. Those with low or very low food security are referred to as food insecure.
5.2 Food security in Northern Ireland, England and Wales
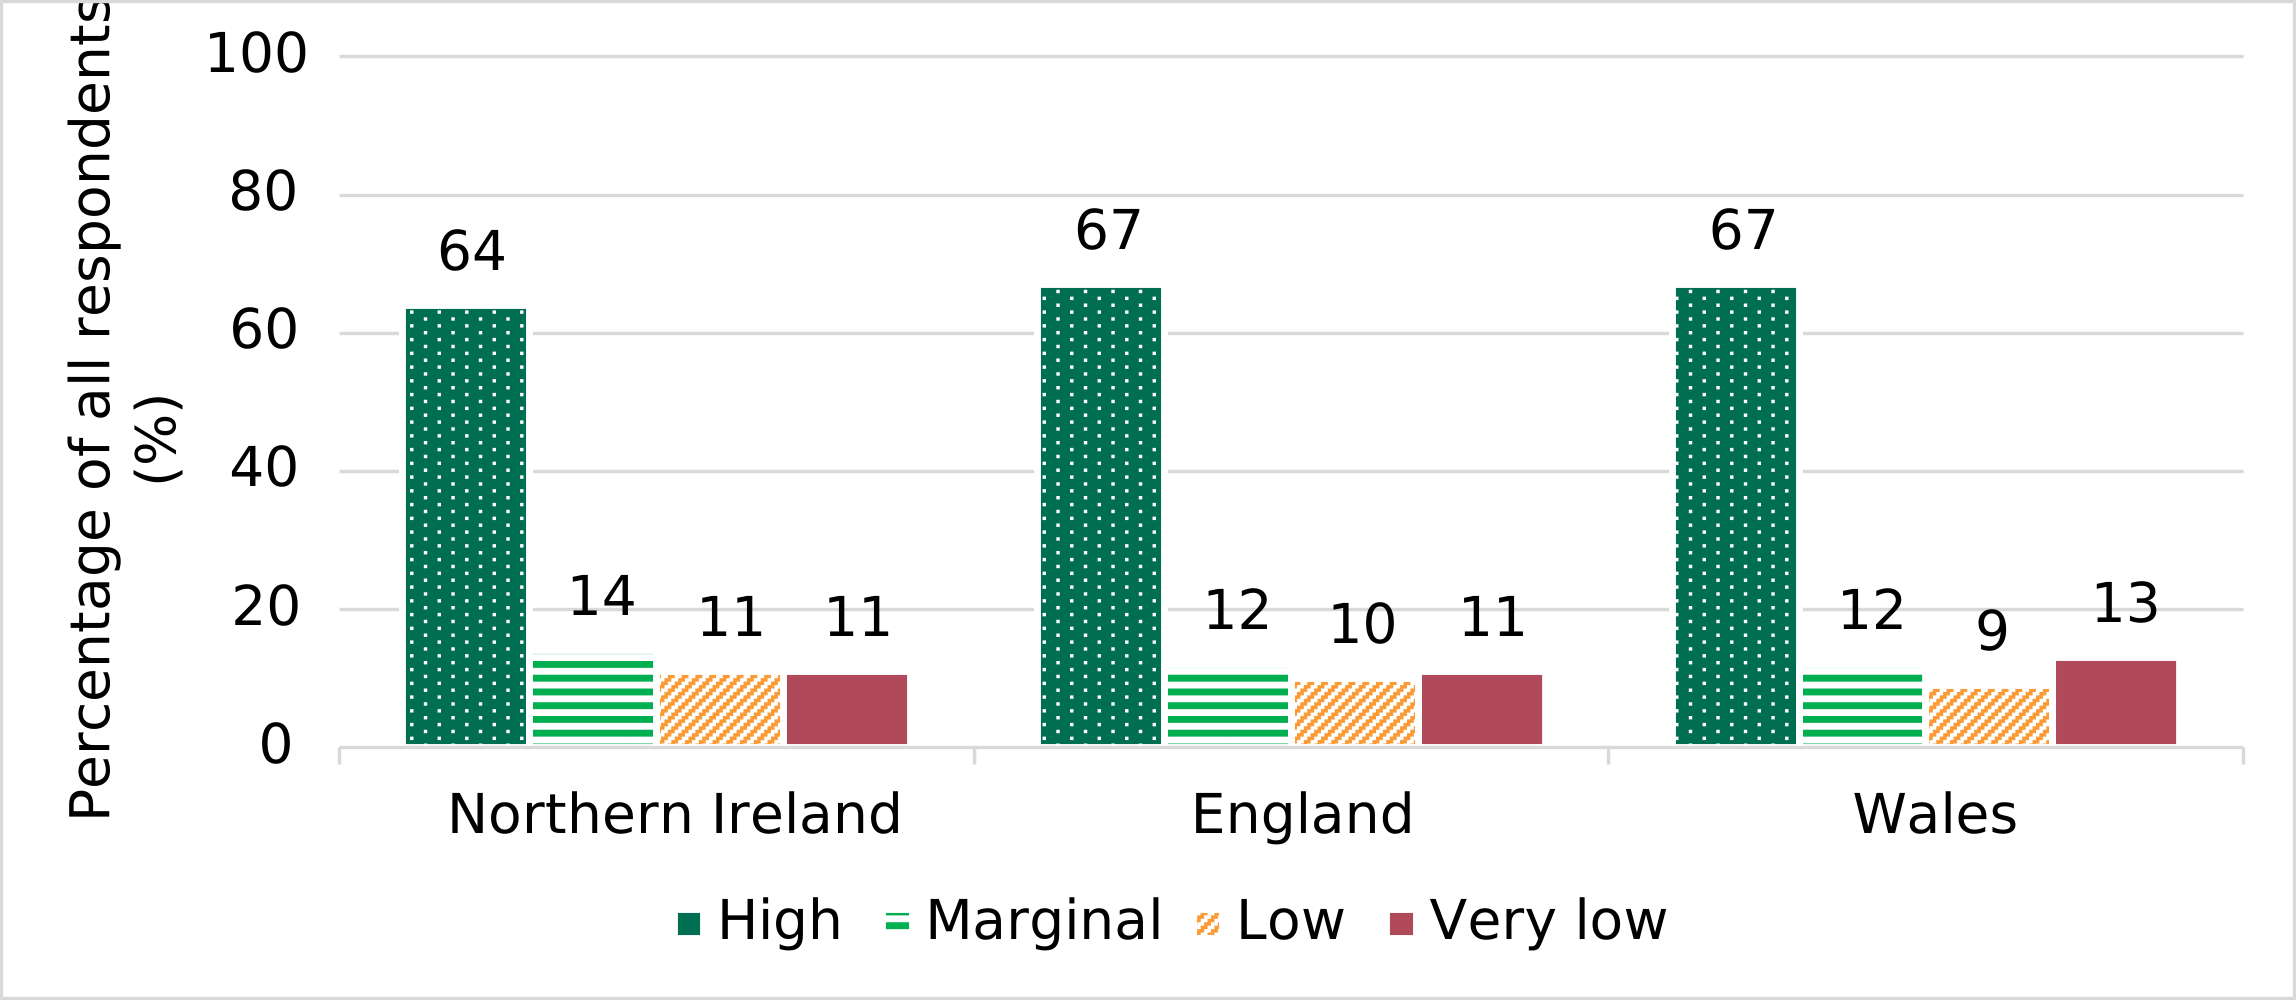
In Wave 11, around 8 in 10 respondents were classified as food secure (i.e. had high or marginal food security) in England (79%), Wales (79%) and Northern Ireland (78%) (see Appendix B, Q4). Across the three nations combined 79% of respondents were classified as food secure. Approximately a fifth of respondents were food insecure (i.e. had low or very low food security) in Northern Ireland (22%), Wales (21%), and England (21%). Across the three nations combined, 21% of respondents were classified as food insecure (Figure 1).
Figure 1. Food security in Northern Ireland, England, and Wales (Wave 11)[footnote 5].
Source: Food and You 2: Wave 11.
5.3 Food security in Northern Ireland over time
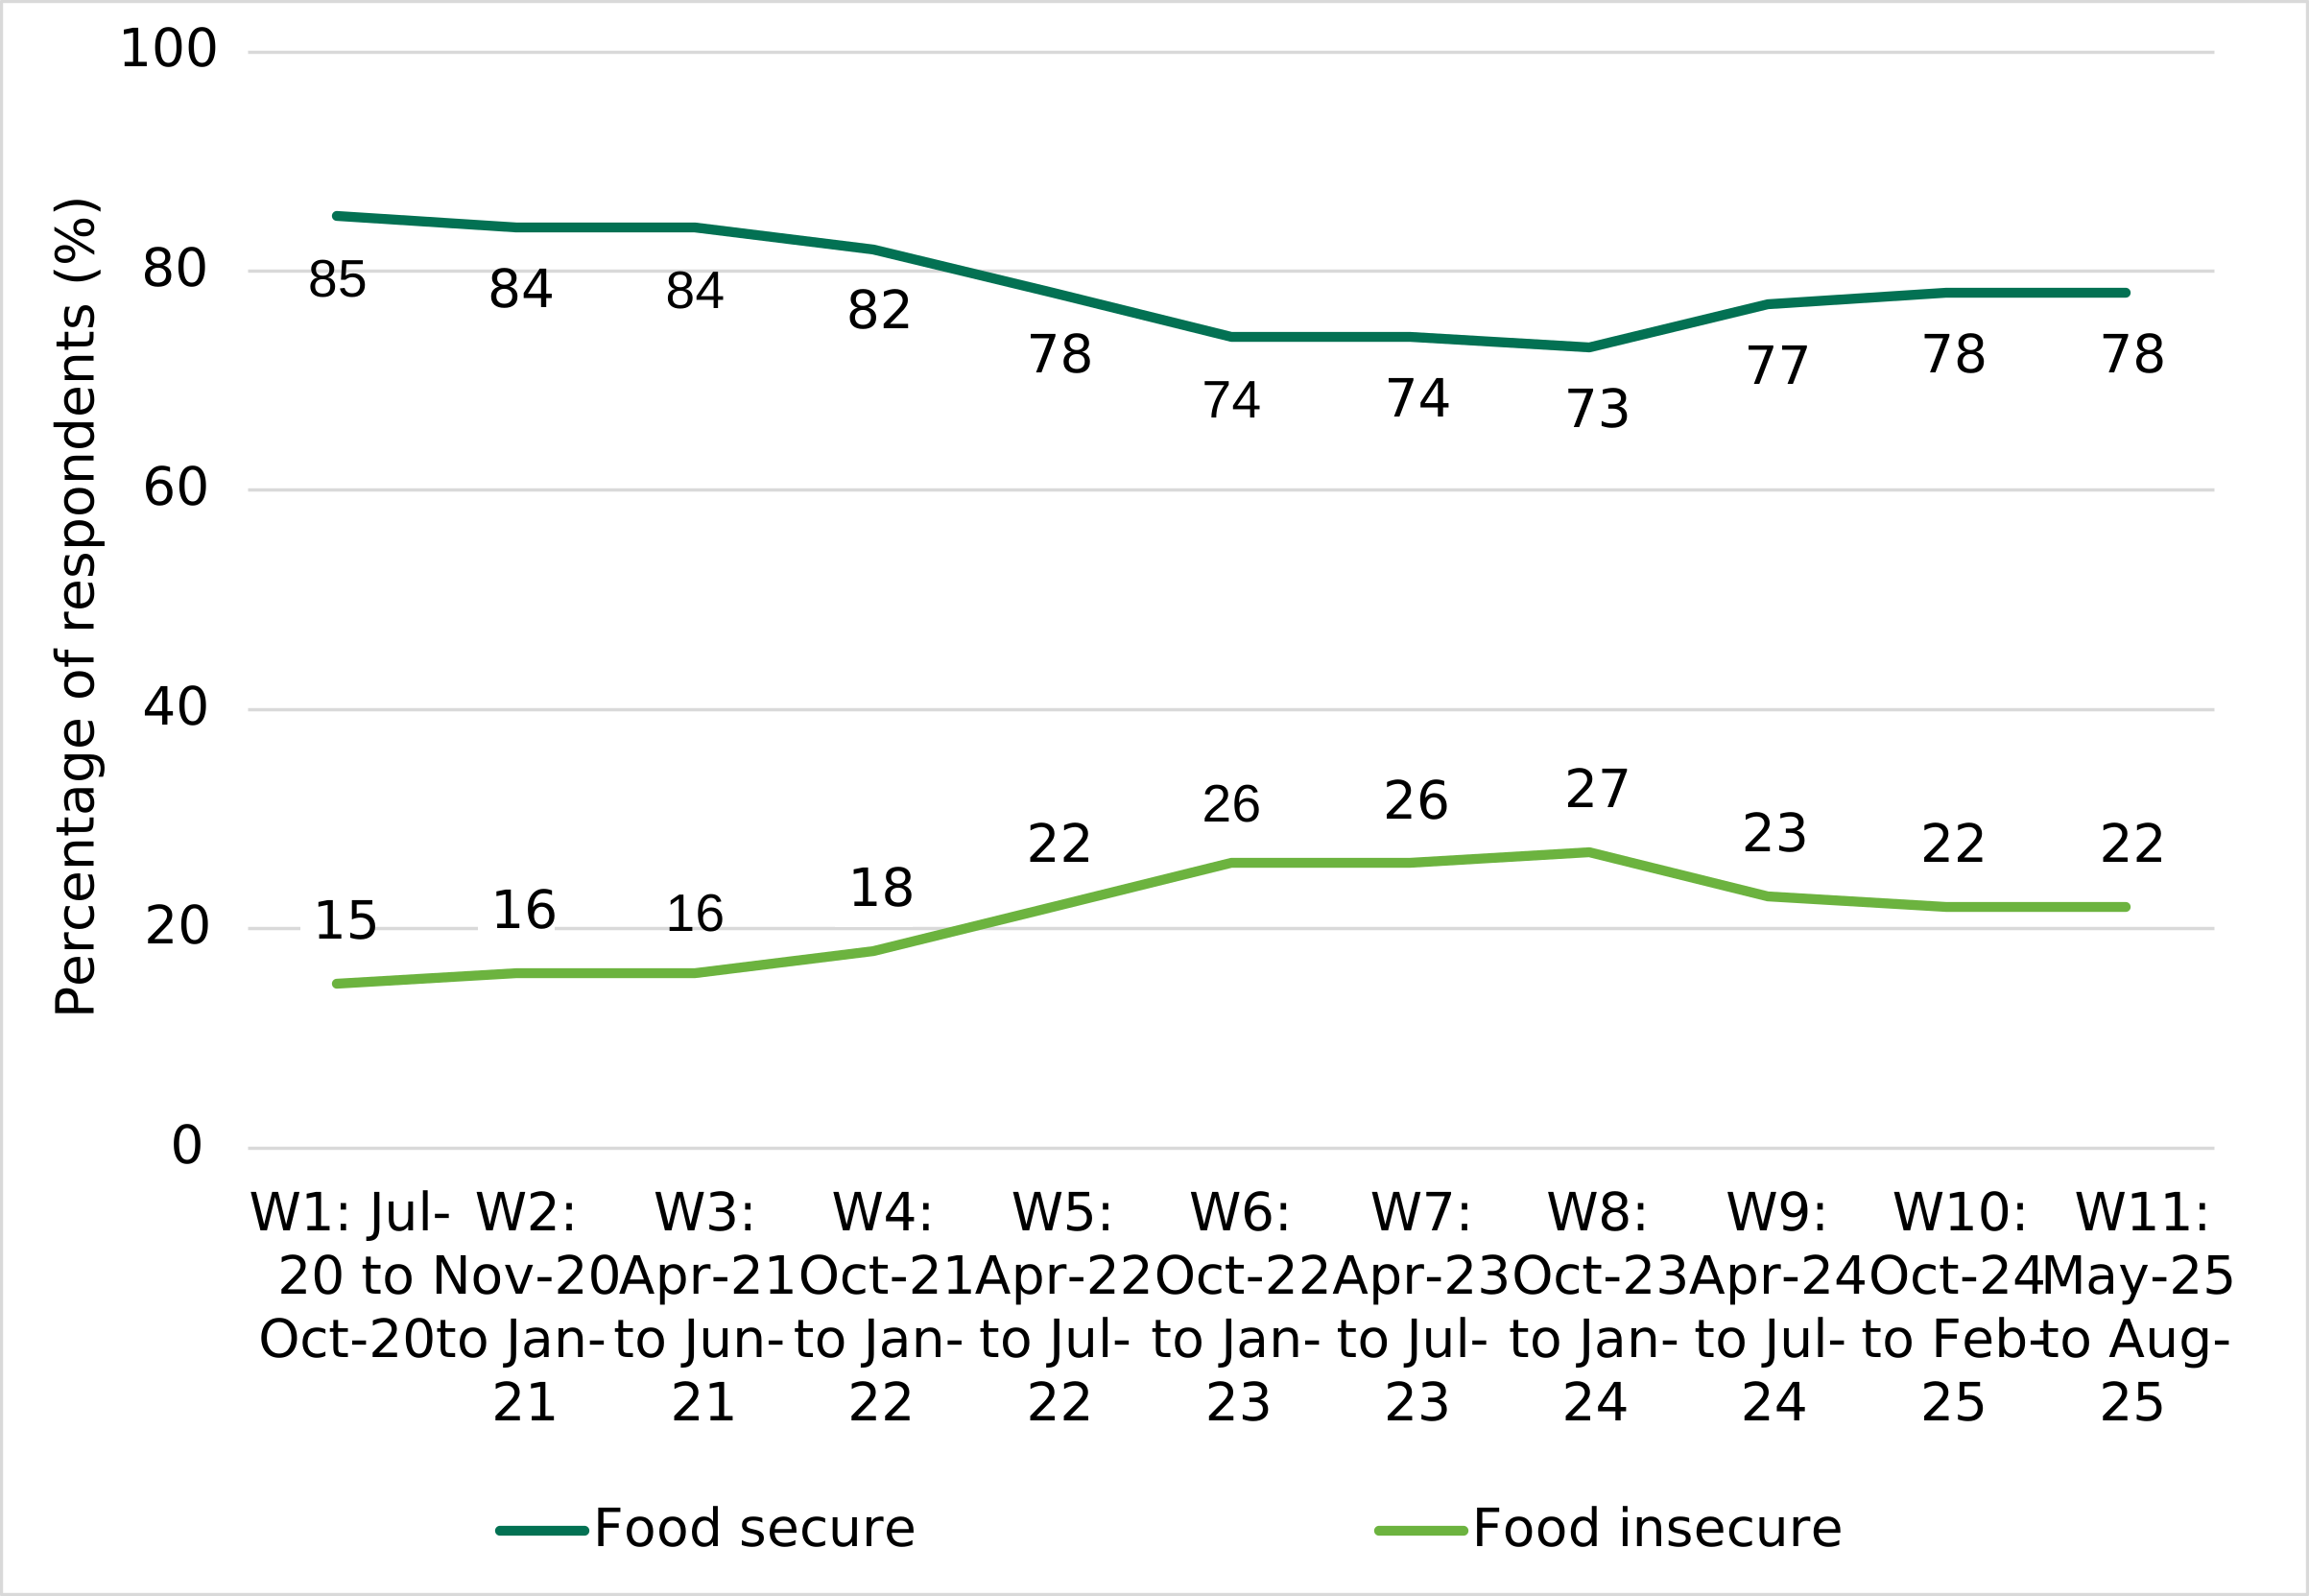
After a period of relative stability, the proportion of respondents classified as food secure declined notably from a peak of 85% in Wave 1 to 74% in both Waves 6 and 7 and 73% in Wave 8, before increasing slightly to 78% in Wave 11**. Food insecurity followed the reverse pattern and increased, from the lowest level of 15% in Wave 1 to 27% in Wave 8, before declining slightly to 22% in Wave 11** while remaining above the levels recorded in the earlier waves (Figure 2) (see Appendix B, Q5).
Figure 2. Food security trends in Northern Ireland (Northern Ireland, Waves 1 to 11).
Source: Food and You 2: Waves 1-11.
In Wave 11, food security also varied between demographic groups within Northern Ireland in the following ways:
Long term health condition: respondents with a long-term health condition (30%) were more likely to report being food insecure compared to those who do not have a long-term health condition (17%).
Household income: respondents in lower income households were more likely to report being food insecure than among those in higher income households. For example, in Wave 11, 44% of respondents with a household income below £19,000 were classified as food insecure, compared with 9% of those with incomes between £64,000 and £95,999.
Urban/rural area: respondents in urban areas (26%) were more likely to report being food insecure than those in rural areas (17%)**.
Northern Ireland Multiple Deprivation Measure (NIMDM): respondents who live in the most deprived areas were more likely to report being food insecure compared to those who live in the least deprived areas. For example, 44% of those who lived in the most deprived areas (NIMDM 1) were food insecure compared to 10% of those who lived in the least deprived area (NIMDM 5).
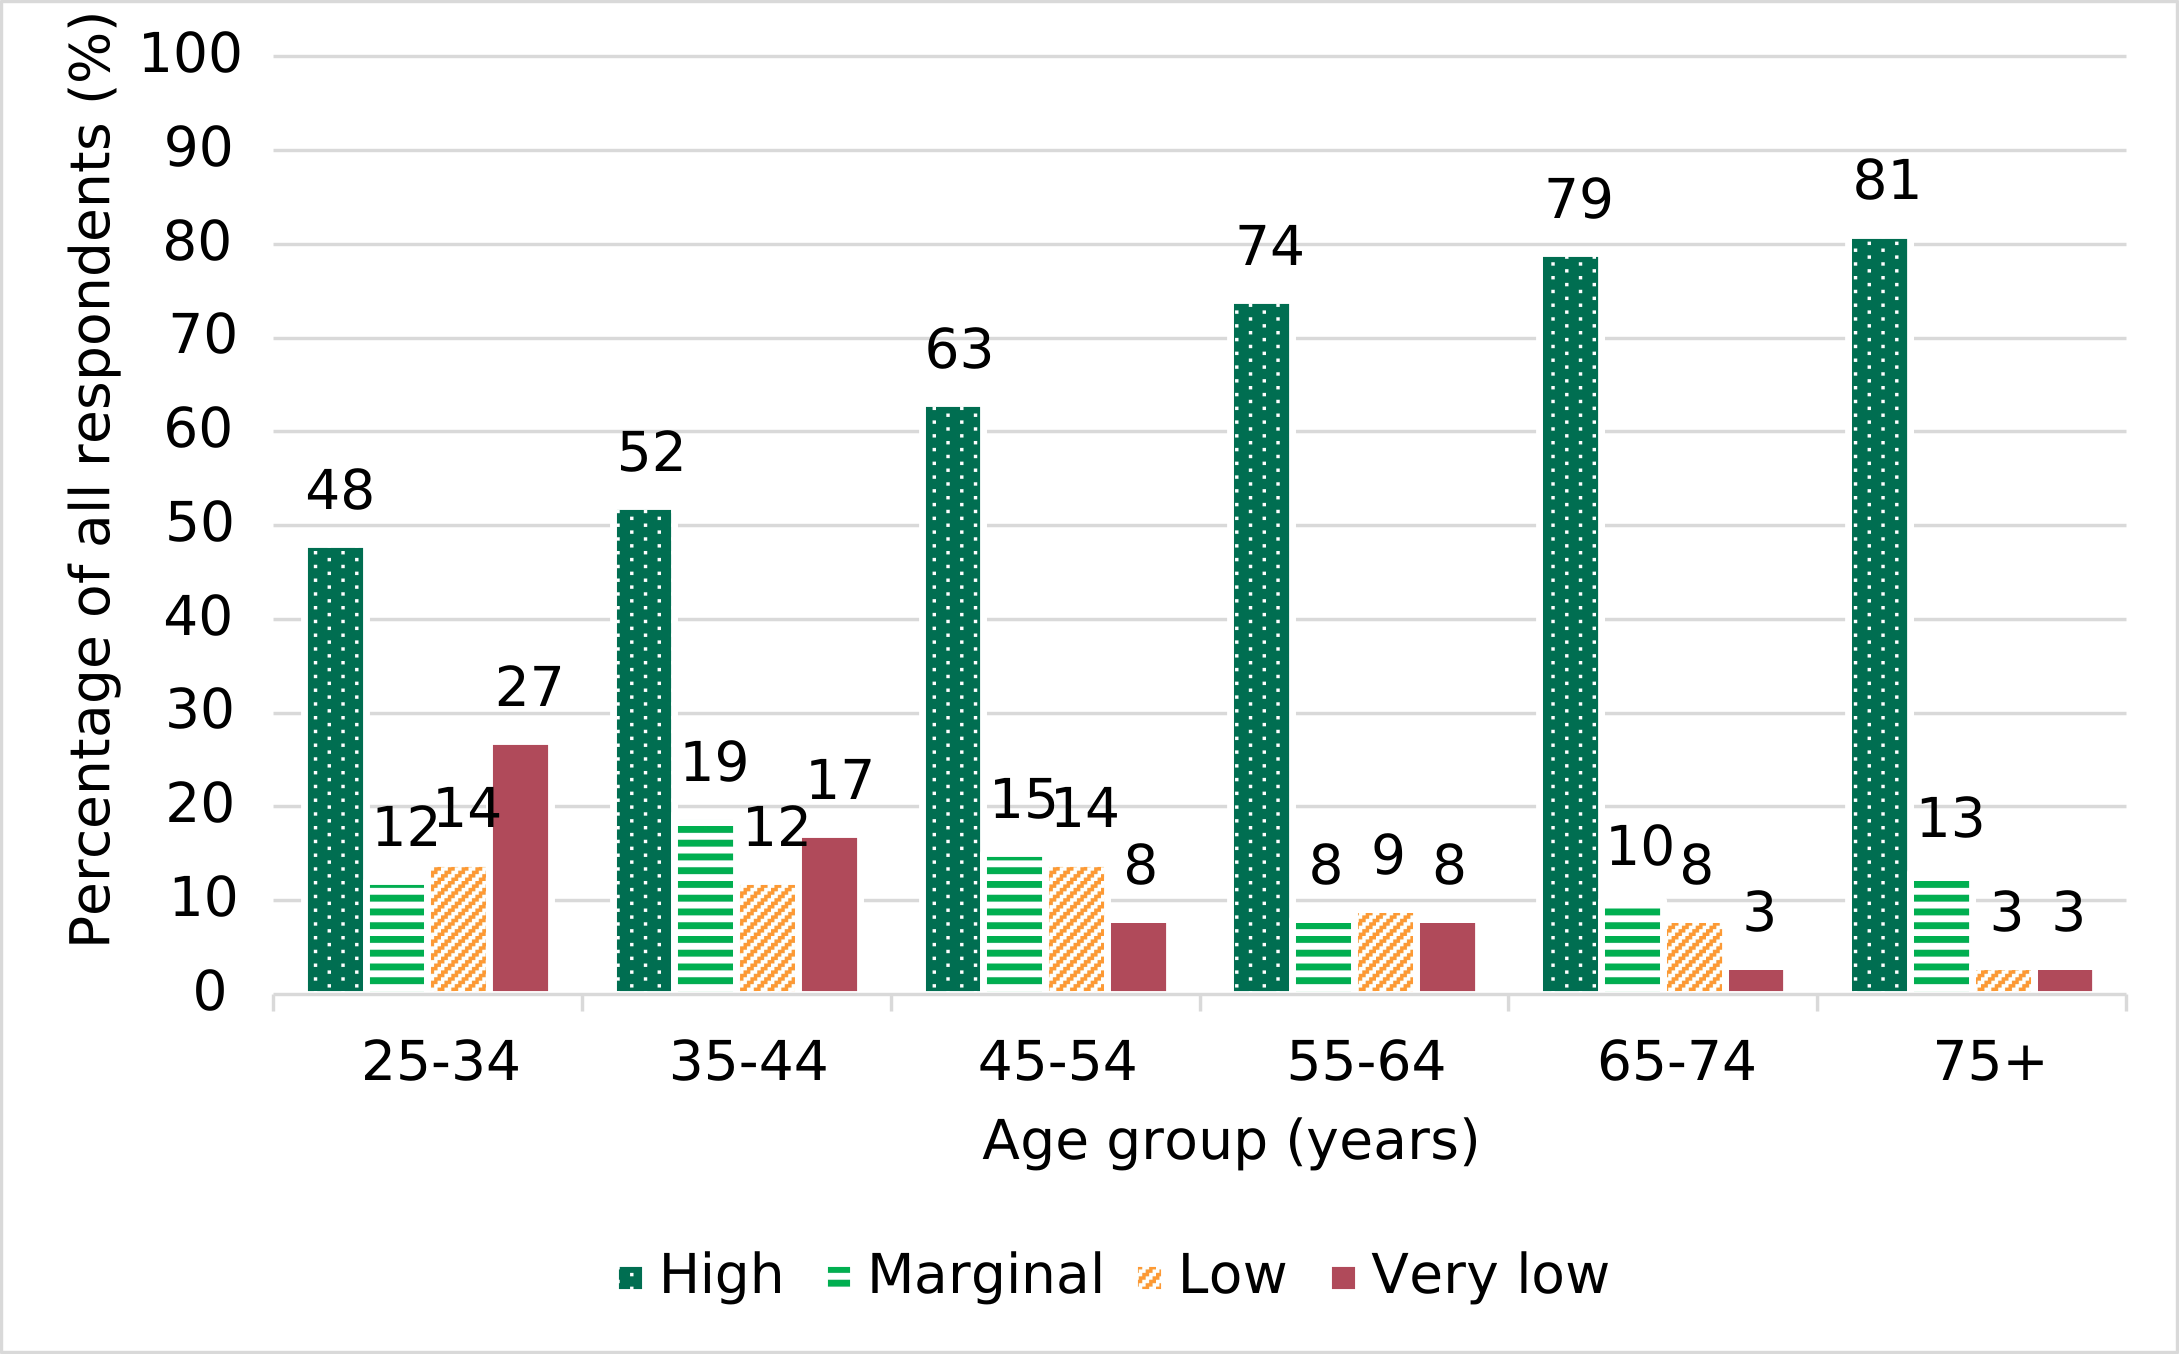
Age[footnote 6]: food security was higher among older respondents, while food insecurity was more prevalent among younger adults. In Wave 11, 41% of adults aged 25–34 were classified as food insecure, the highest prevalence of any age group, compared with 6% of those aged 75 and over. These differences largely reflected variation in the proportion of those classified as having high food security and very low food security, rather than those classified as having low or marginal food security (Figure 3).
Figure 3. Food security in Northern Ireland by age group (Wave 11).
Source: Food and You 2: Wave 11.
5.4 Food bank use
Respondents were asked if they or anyone else in their household had received a free parcel of food from a food bank or other emergency food provider in the last 12 months. In Wave 11, 5% of respondents reported that they had received a free parcel from a food bank or other emergency food provider in the previous 12 months, broadly in line with previous waves (3-5%). (see Appendix B, Q6).
6. Chapter 3: Eating out and takeaways
6.1 Introduction
This chapter presents respondents’ self-reported eating out and takeaway ordering habits, the factors participants considered when deciding where to buy food, and awareness and use of the FHRS (Food Hygiene Rating Scheme)[footnote 7]. This chapter presents latest data from Wave 11 and trends over time. For more information on the FHRS, please see Appendix A.
6.2 Prevalence of eating out and ordering takeaways
Respondents were asked, from a list of options, about their recent eating habits when eating out or ordering food across a range of venues and online platforms.
In Wave 11, the most frequently reported behaviours were eating out at restaurants (82%), ordering takeaway food directly from a restaurant or takeaway (78%), and eating at cafés, coffee shops or sandwich shops (77%) (Figure 4). Across all waves, these were consistently the three most commonly reported behaviours among respondents in Northern Ireland (see Appendix B, Q7)
Figure 4. Type of food businesses respondents in Northern Ireland had eaten at or ordered food from (Wave 11).
| Type of food business | Percentage of respondents (%) |
|---|---|
| Restaurant | 82 |
| Takeaway, ordered directly from a takeaway shop or restaurant | 78 |
| Café / coffee shop /sandwich shop | 77 |
| Pub/bar | 46 |
| Takeaway, ordered through an online ordering and delivery company | 40 |
| Home kitchen | 12 |
| Food-sharing app | 9 |
| Online marketplace | 7 |
| Social media | 2 |
Source: Food and You 2: Wave 11.
In Wave 11, reported eating out and takeaway use varied between demographic groups in Northern Ireland in the following ways:
Gender: women (83%) were more likely than men (70%) to eat out or order takeaways from cafés, coffee shops or sandwich shops.
Household income: respondents in higher income households were more likely to report takeaway use and eating out in cafes/coffee shops/sandwich shops, restaurants, pubs or bars than lower income households. For example, those with household incomes between £64,000–£95,999 (87%) were more likely to order takeaways directly from a takeaway shop or restaurant, compared with 73% of respondents in both the £19,000–£31,999 and less than £19,000 household income brackets [footnote 8].
Children in the household: Respondents in households with children under 16 were more likely to report ordering takeaway food than those without children under 16. For example, 85% of respondents in households with children under 16 reported ordering food directly from a takeaway or restaurant, compared with 75% of those without children under 16. They were also more likely to order takeaways through an online ordering and delivery company (52%, compared with 34% of those without children under 16).
Urban/rural: respondents in urban areas (52%) were more likely to report that they ordered and ate food through an online ordering and delivery company than those in rural areas (24%).
Food security: Respondents classified as food insecure (56%) were more likely than those classified as food secure (35%) to report ordering food through an online ordering and delivery company. They were also more likely to report ordering through a food sharing app (17% compared with 6%) and to order food from someone who made it in a home kitchen (22% compared with 10%). Conversely, respondents classified as food secure (86%) were more likely to report eating out at restaurants compared with those classified as food insecure (72%).
Age[footnote 9]: Patterns of eating out and food ordering also differed by age. Respondents aged 25–34 were the most likely to order food directly from a takeaway shop or restaurant (91%), compared with those aged 35–44 (81%), 55–64 (80%) and 65–74 (69%). Younger respondents were also more likely to use online delivery platforms, such as Just Eat, Deliveroo or Uber Eats, with 69% of those aged 25–34 reporting this, compared with 13% of those aged 65–74. A similar pattern was seen for food sharing apps such as Olio or Too Good To Go, with older respondents least likely to report using these apps, with only 3% of those aged 55-64 and 65–74 reporting use of these apps, compared with 20% of respondents aged 25–34. Use of online marketplaces (such as Amazon, Gumtree or Etsy) to order food declined with age. Respondents aged 25-34 (16%) and 35-44 (14%) were more likely to report ordering food from an online marketplace than those aged 55-64 (4%) and 65-74 (3%).
6.3 Eating out and takeaways by mealtime
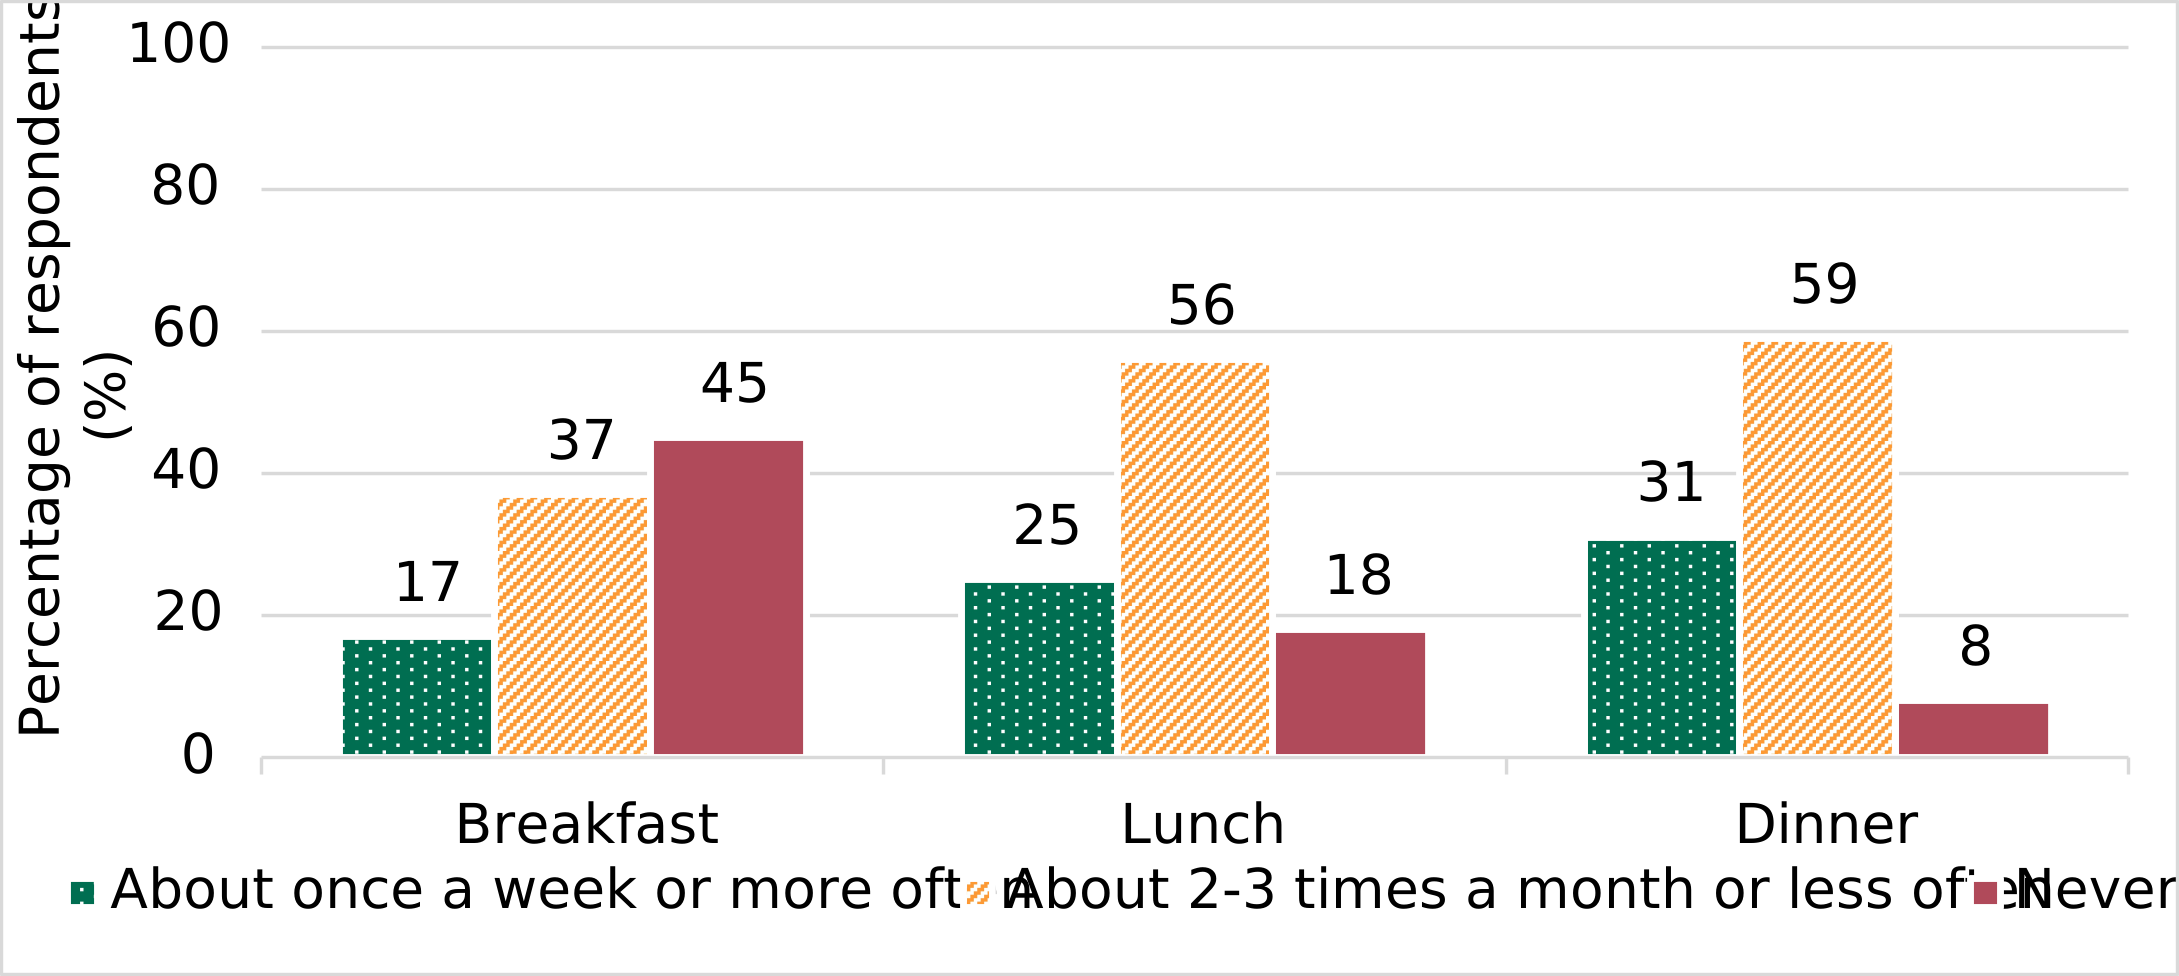
Respondents were most likely to report eating out or buying takeaway food for lunch and dinner, with 80% and 90% respectively doing so in Wave 11 (see Appendix B, Q8). Around three in ten respondents (31%) reported doing so once a week or more often for dinner, compared with a quarter (25%) for lunch and 17% for breakfast. It was more common for respondents to report eating out or buying takeaways 2-3 times a month, with around half reporting this frequency for lunch (56%) and dinner (59%) (Figure 5).
Figure 5. Frequency of eating out or buying food to take out by mealtime in Northern Ireland (Wave 11)[footnote 10].
Source: Food and You 2: Wave 11.
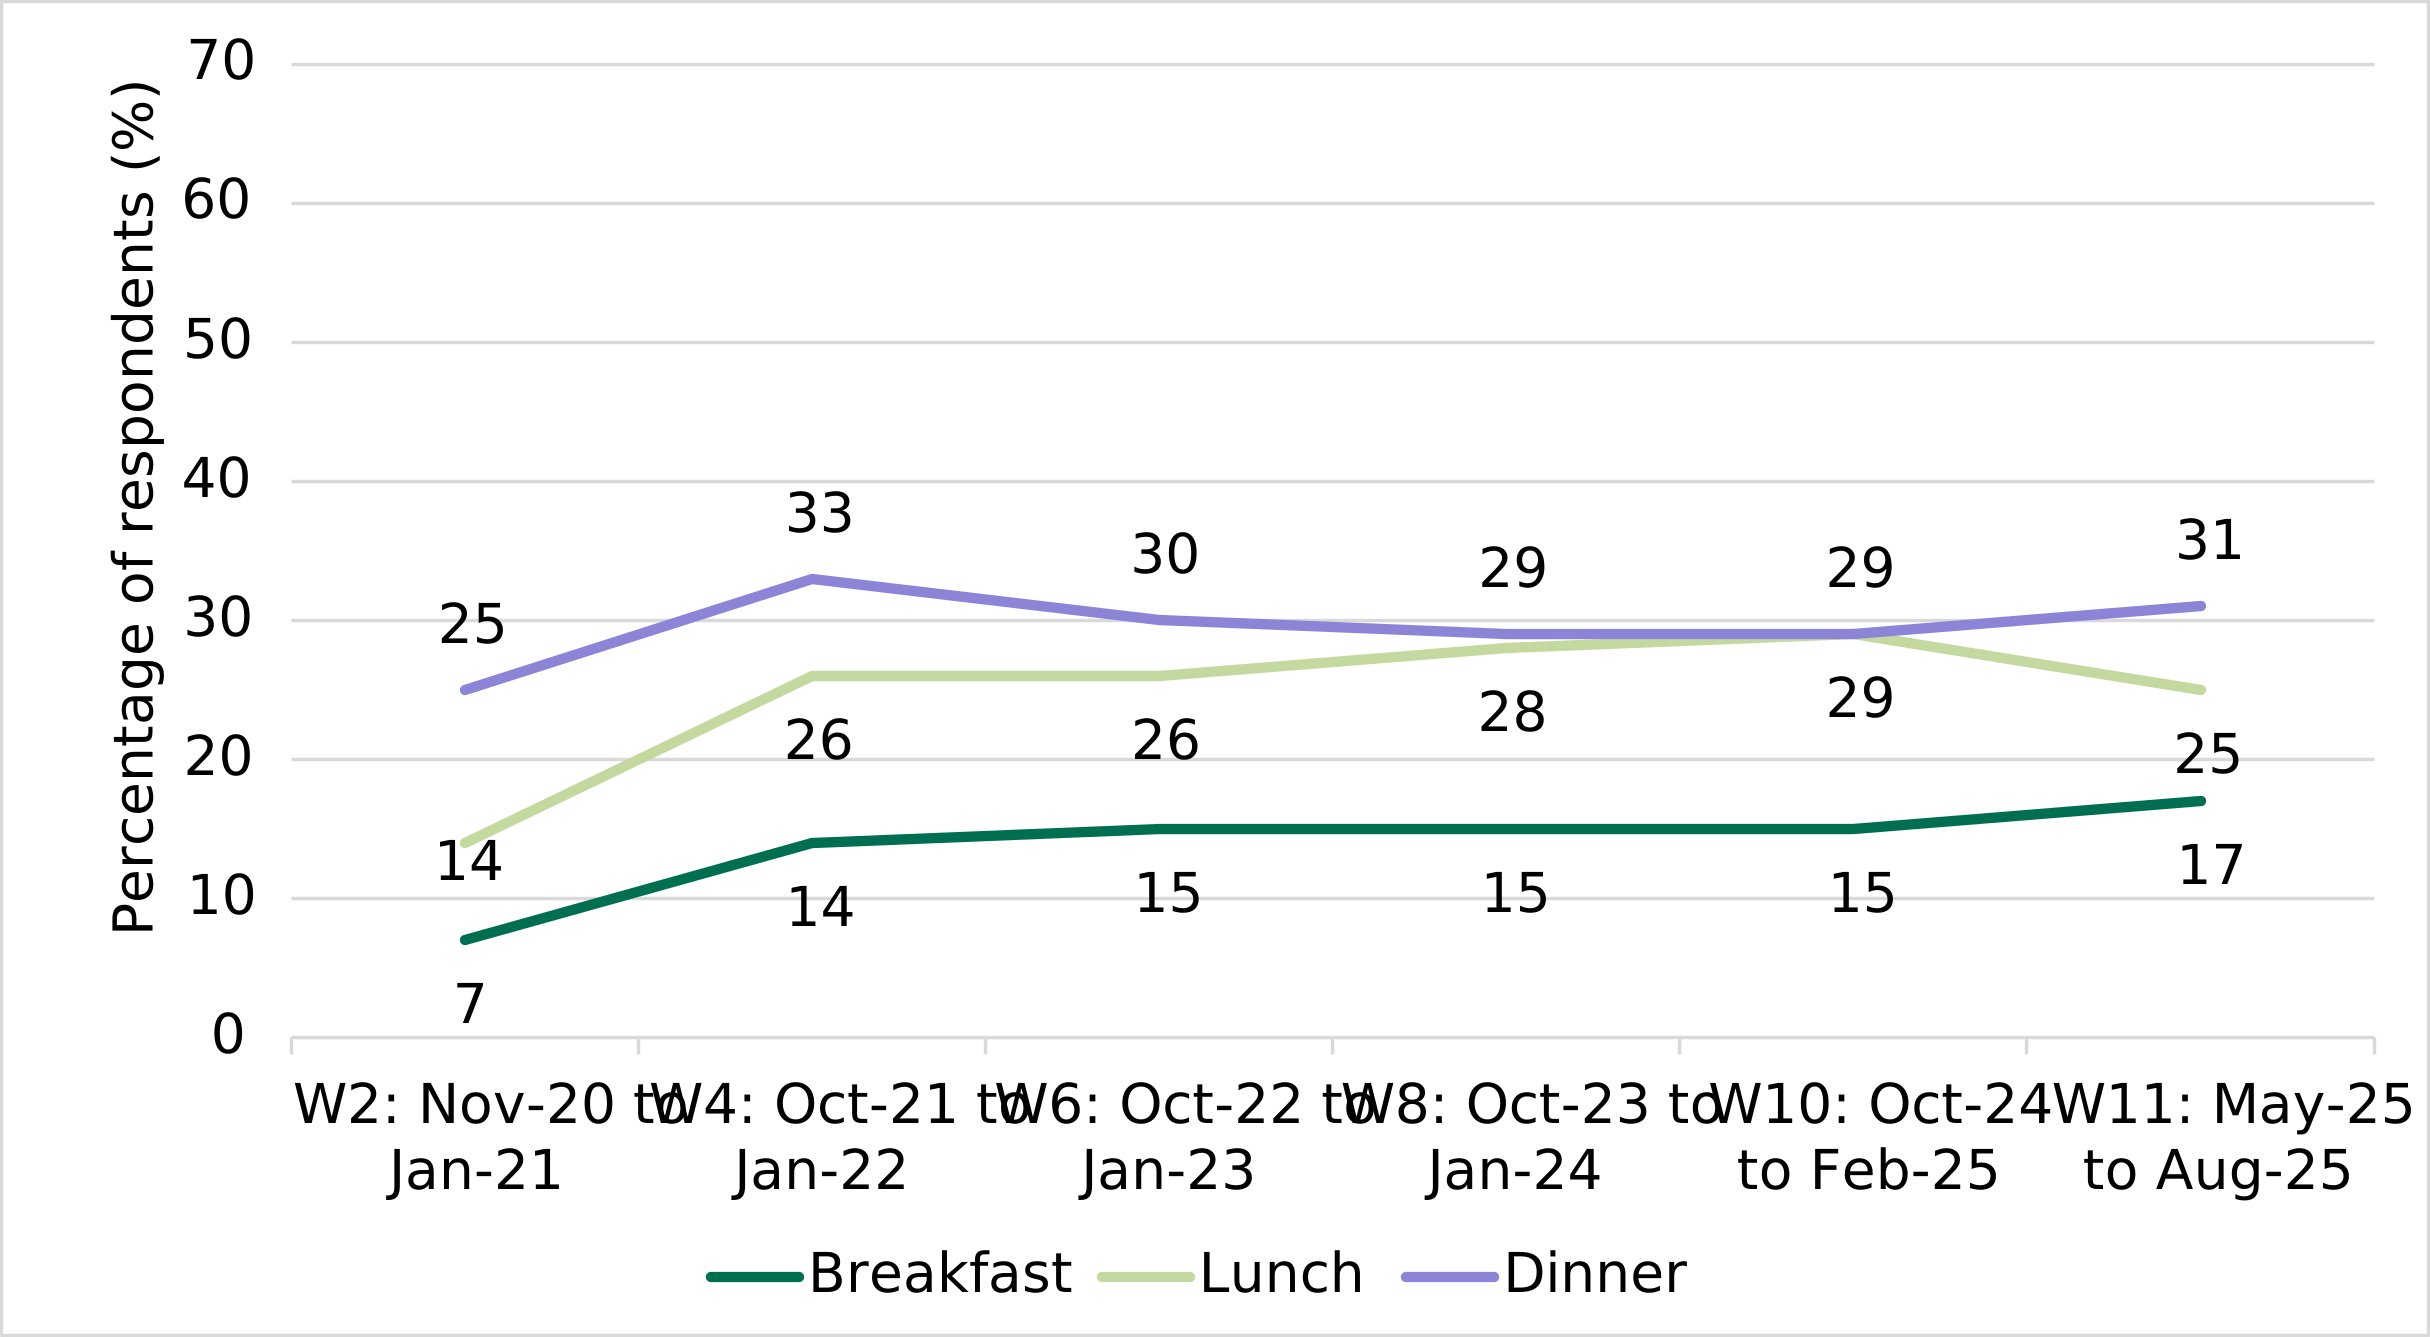
The proportion of respondents who ate out or bought takeaway food once a week or more often was lower in the earlier waves, before increasing and then stabilising from around Wave 4 onwards.
For breakfast and lunch, the proportion of respondents reporting eating out or buying takeaway food once a week or more often was lower in Wave 2 (7% breakfast and 14% lunch). From Wave 4 onwards, this remained broadly stable; from 14%-17% for breakfast and from 25%-29% for lunch. For dinner, around three in ten respondents reported eating out or buying takeaway food once a week or more often, across all waves, with levels remaining broadly stable overall, aside from a lower proportion in Wave 2 (25%) and slight increases in Wave 4 (33%) and Wave 11 (31%)** (Figure 6).
Overall, these findings suggest that weekly or more frequent consumption has been relatively stable since around Wave 4, particularly for breakfast and lunch, following lower levels in Wave 2 when data was first collected.
Figure 6. Eating out or buying food to take out for breakfast, lunch and dinner once a week or more in Northern Ireland.
Source: Food and You 2: Waves 2, 4, 6, 8, 10 and 11.
Factors considered when eating out and ordering takeaways
Respondents who ate out were asked to identify, from a list of options, the factors that influence their choice of where to eat out (see Appendix B, Q9). In Wave 11, among respondents in Northern Ireland who ate out, the most commonly cited considerations were quality of food (82%) and previous experience of the place (78%). Just under half of respondents (46%) considered the food hygiene rating when deciding where to eat (Figure 7).
Figure 7. Factors considered by respondents in Northern Ireland when deciding where to eat out (Wave 11).
| Factors considered | Percentage of respondents (%) |
|---|---|
| Quality of food | 82 |
| Previous experience of the place | 78 |
| Price | 67 |
| Recommendations from family and friends | 67 |
| Location | 65 |
| Quality of service | 65 |
| Cleanliness of the place | 64 |
| Ambiance/atmosphere | 49 |
| Food Hygiene Rating | 46 |
| Type of food | 45 |
| Reviews | 30 |
| Offers, deals or discount available | 29 |
| Healthier options available | 16 |
| Independent or part of a chain | 15 |
| Child-friendly | 14 |
| Allergen information provided | 7 |
| Calorie information provided | 3 |
Source: Food and You 2: Wave 11.
Respondents who order takeaways were also asked to identify, from a list of options, the factors that influence their decisions when ordering a takeaway (see Appendix B, Q10)[footnote 11]. In Wave 11, among those respondents in Northern Ireland who ordered takeaways, the most commonly cited considerations were their previous experience of the takeaway (80%) and the quality of food (77%) when deciding where to order from. Two fifths of respondents (40%) considered the food hygiene rating when deciding where to order a takeaway from (Figure 8).
Health-related factors were among the least commonly considered factors when respondents ate out or ordered takeaway food in Wave 11. For example, 16% considered the availability of healthier options when eating out, while 10% did so when ordering takeaway food. Calorie information was one of the least commonly considered factors in both cases (3%).
Figure 8. Factors considered by respondents in Northern Ireland when ordering a takeaway (Wave 11).
| Factors considered | Percentage of respondents (%) |
|---|---|
| Previous experience of the takeaway | 80 |
| Quality of food | 77 |
| Recommendations from family and friends | 57 |
| Price (including cost of delivery) | 56 |
| Location of takeaway | 54 |
| Type of food | 46 |
| Food Hygiene Rating | 40 |
| Delivery/collection times | 34 |
| Whether food can be ordered online | 31 |
| Offers, deals or discount available | 29 |
| Delivery or collection option | 29 |
| Reviews | 26 |
| Independent or part of a chain | 13 |
| Healthier options available | 10 |
| Allergen information provided | 6 |
| Calorie information provided | 3 |
Source: Food and You 2: Wave 11
6.4 Awareness and recognition of the FHRS
The FHRS is run by the FSA in partnership with District Councils in Northern Ireland. The scheme has been supported by legislation since 2016 which requires food businesses to display their hygiene rating.
In Wave 11, most respondents in Northern Ireland (93%) had heard of the FHRS (see Appendix B, Q11) . Two thirds of respondents (66%) reported that they had heard of the FHRS and knew a bit or quite a lot about it[footnote 12]. Recognition of the FHRS sticker was also high, with 96% of respondents recognising the image when shown it (see Appendix B, Q12).
6.5 FHRS usage
Over half of respondents (58%) in Northern Ireland checked a business’s food hygiene rating in the last 12 months (see Appendix B, Q13).
Respondents who said they had checked the hygiene rating of a food business in the last 12 months were asked how they checked these ratings. In Northern Ireland, the most common method of checking was looking at an FHRS sticker displayed at the food business (92%), followed by checking the food business’s own website (19%) and checking an online food ordering website or app (e.g. Just Eat, Deliveroo, Uber Eats) (13%) (Figure 9) (see Appendix B, Q14).
Figure 9. How respondents in Northern Ireland checked food hygiene ratings (Wave 11).
| Methods of checking | Percentage of respondents (%) |
|---|---|
| Looked at FHRS sticker displayed at the food business | 92 |
| Checked the food business’ own website | 19 |
| Checked an online food ordering website or app (e.g., Just Eat, Deliveroo, Uber Eats) | 13 |
| Checked Food Standards Agency’s own website | 12 |
| Checked on an app (e.g., Scores on the Doors, Food Hygiene Rating) | 4 |
| Checked in local newspaper | 2 |
| Checked on another website | 2 |
| Other | 1 |
Source: Food and You 2: Wave 11.
Respondents were asked about the ease of finding the Food Hygiene Rating Scheme ratings when eating out or shopping for food, both online and in person. For ease of finding ratings when ordering or shopping for food online, nearly a quarter (24%) of respondents in Northern Ireland reported that these were easy (very or quite) to find (see Appendix B, Q15). In contrast, respondents were more likely to report ease of finding ratings when eating out or shopping for food in person. Nearly two thirds of respondents (64%) in Northern Ireland reported that these ratings were easy to locate (see Appendix B, Q16).
7. Chapter 4: Healthy eating
7.1 Introduction
This chapter provides insight into self-reported dietary behaviours in Northern Ireland, including the types of foods respondents eat, vitamin and mineral supplement use and changes in eating habits for health reasons. These findings reflect respondents’ reported behaviours and perceptions, rather than directly measured dietary intake. Other sources, such as the National Diet and Nutrition Survey (NDNS), can be used alongside these findings to provide a more comprehensive picture of dietary patterns. As comparable data for this chapter is currently only available for two waves, this chapter focuses on findings from Wave 11 only and does not examine changes over time.
7.2 What types of foods do respondents eat?
Respondents in Northern Ireland were asked how often they consumed certain types of food or drink.
Almost all respondents (98%) reported eating fruit and vegetables at some point. 71% reported eating them every day or most days, a quarter (25%) reported eating them about once a week or 2 to 3 times a week, while 3% ate fruit and vegetables 2-3 times a month or less often (see Appendix B, Q17).
Around four in ten respondents (39%) reported eating oily fish about once a week or 2 to 3 times a week and around a third (36%) reported eating this 2-3 times a month or less often (Figure 10).
However, consumption of less healthy foods was still common. Nearly all respondents (98%) reported eating sweets and chocolate at some point, with around two fifths (41%) reporting they ate these every day or most days and 43% reported that they ate this about once a week or 2 to 3 times a week.
8 in 10 respondents (80%) reported drinking sugary fizzy drinks and diluted squash at some point, with a third (33%) drinking this every day or most days and 26% drinking this about once a week or 2 to 3 times a week.
Most respondents (97%) reported eating chips and other fried foods at some point, only 7% reported that they ate this every day or most days, although 60% reported eating these about once a week or 2 to 3 times a week.
Overall, while most respondents reported eating fruit and vegetables regularly, frequent consumption of sweets, chocolate and sugary drinks was also common. Chips and other fried foods were widely consumed, though typically on a weekly rather than daily basis.
Figure 10. How often respondents in Northern Ireland consumed certain types of food and drink (Wave 11)[footnote 13].
| Type of food or drink | Every day or most days | About once a week or 2-3 times a week | 2-3 times a month or less often | Never |
|---|---|---|---|---|
| Fruit and vegetables | 71 | 25 | 3 | 1 |
| Sweets and chocolate | 41 | 43 | 15 | 1 |
| Chips and other fried foods | 7 | 60 | 29 | 3 |
| Sugary fizzy drinks and diluted squash | 33 | 26 | 21 | 19 |
| Oily fish | 3 | 39 | 36 | 19 |
Source: Food and You 2: Wave 11.
7.3 Vitamin and mineral supplements
Respondents in Northern Ireland were asked whether they are currently taking any vitamin and/or mineral supplements. Nearly half of respondents (48%) reported that they were currently taking vitamin and/or mineral supplements (see Appendix B, Q18). Of the demographic subgroup findings reported, only differences by gender were identified, with women (57%) more likely than men (39%) to take vitamin and/or mineral supplements.
The most commonly reported vitamin and/or mineral supplements were a multi-vitamin or mineral (52%), vitamin D (40%), magnesium (33%) and fish oils or Omega 3 (30%) (see Appendix B, Q19). Of the options listed, the least commonly reported supplements were vitamin B12 injections (5%) and folic acid (9%) (Figure 11).
Figure 11. Types of vitamin and/or mineral supplements respondents reported taking in Northern Ireland (Wave 11).
| Vitamin/mineral supplement | Percentage of respondents (%) |
|---|---|
| Multi-vitamin or mineral | 52 |
| Vitamin D | 40 |
| Magnesium | 33 |
| Fish oils or Omega 3 | 30 |
| Vitamin C | 21 |
| B vitamin(s) or B complex | 19 |
| Other | 16 |
| Iron | 16 |
| Folic acid | 9 |
| Vitamin B12 injection | 5 |
Source: Food and You 2: Wave 11.
Frequency of vitamin and/or mineral supplement use
Most respondents in Wave 11 who took vitamin and/or mineral supplements reported taking them every day (75%). Around a fifth (21%) of respondents reported taking a vitamin and/or mineral supplement most days, and 3% reported taking them less often (see Appendix B, Q20).
Reasons for vitamin and/or mineral supplement use
The most common reason for taking vitamin and/or mineral supplements was for general health or wellbeing (68%) (Figure 12). Around 3 in 10 (29%) respondents reported taking a supplement due to age or getting older, while 22% reported taking them due to tiredness and 22% to improve or fortify their diet. Respondents were least likely to report taking vitamin and/or mineral supplements to improve sports performance (11%) or for reasons related to pregnancy (3%) (see Appendix B, Q21).
Most respondents (72%) who reported taking a vitamin and/or mineral supplement had not been advised to take these supplements by a medical professional. Only around a quarter (26%) had been advised by a medical professional to take a vitamin and/or mineral supplement (see Appendix B, Q22).
Figure 12. Reasons for vitamin and/or mineral supplement consumption in Northern Ireland (Wave 11).
| Reason for taking vitamin and/or mineral supplement | Percentage of respondents (%) |
|---|---|
| General health and wellbeing | 68 |
| Due to age or getting older | 29 |
| Due to tiredness | 22 |
| Improve/fortify my diet | 22 |
| Vitamin and/or mineral deficiency | 17 |
| For a specific health condition | 14 |
| Improve sports performance | 11 |
| In case of pregnancy or currently pregnant | 3 |
| Other reason | 7 |
Source: Food and You 2: Wave 11.
7.4 Changes in eating habits
Respondents in Wave 11 were asked, from a list of options, which, if any, changes they had made in the previous 12 months were for health reasons specifically (see Appendix B, Q23).
The majority of respondents in Northern Ireland (72%) reported making at least one dietary change for health reasons. The most common changes reported by respondents were that they had eaten less processed food (46%) and eaten more fruit and / or vegetables (45%), followed by eaten less sugar or food/drinks high in sugar (44%).
Around a third of respondents reported that they had eaten less foods high in fat or saturated fat (32%) and 29% reported that they had eaten less salt or food high in salt. However, 22% of respondents reported that they had not made any of the listed changes and 5% of respondents reported that they did not know if they had made any of the listed changes in the previous 12 months (Figure 13).
Figure 13. Changes respondents in Northern Ireland had made in the previous 12 months for health reasons (Wave 11).
| Changes made in the previous 12 months | Percentage of respondents (%) |
|---|---|
| Eaten less processed food | 46 |
| Eaten more fruit and/or vegetables | 45 |
| Eaten less sugar or food/drink high in sugar | 44 |
| Eaten less foods high in fat or saturated fat | 32 |
| Eaten less salt or food high in salt | 29 |
| Eaten more fish | 19 |
| Stopped eating or eaten less red meat | 11 |
| Stopped eating or eaten less dairy | 8 |
| Stopped eating or eaten less poultry | 4 |
| I have made other changes | 4 |
| Don’t know | 5 |
| I have not made any changes | 22 |
Source: Food and You 2: Wave 11.
8. Chapter 5: Food shopping and labelling
8.1 Introduction
This chapter presents food purchasing habits, the information respondents looked for when shopping for food, and the use of promotions and price-based marketing[footnote 14]. It draws on both Wave 11 data and trends over time where relevant.
8.2 What do respondents look for when buying food?
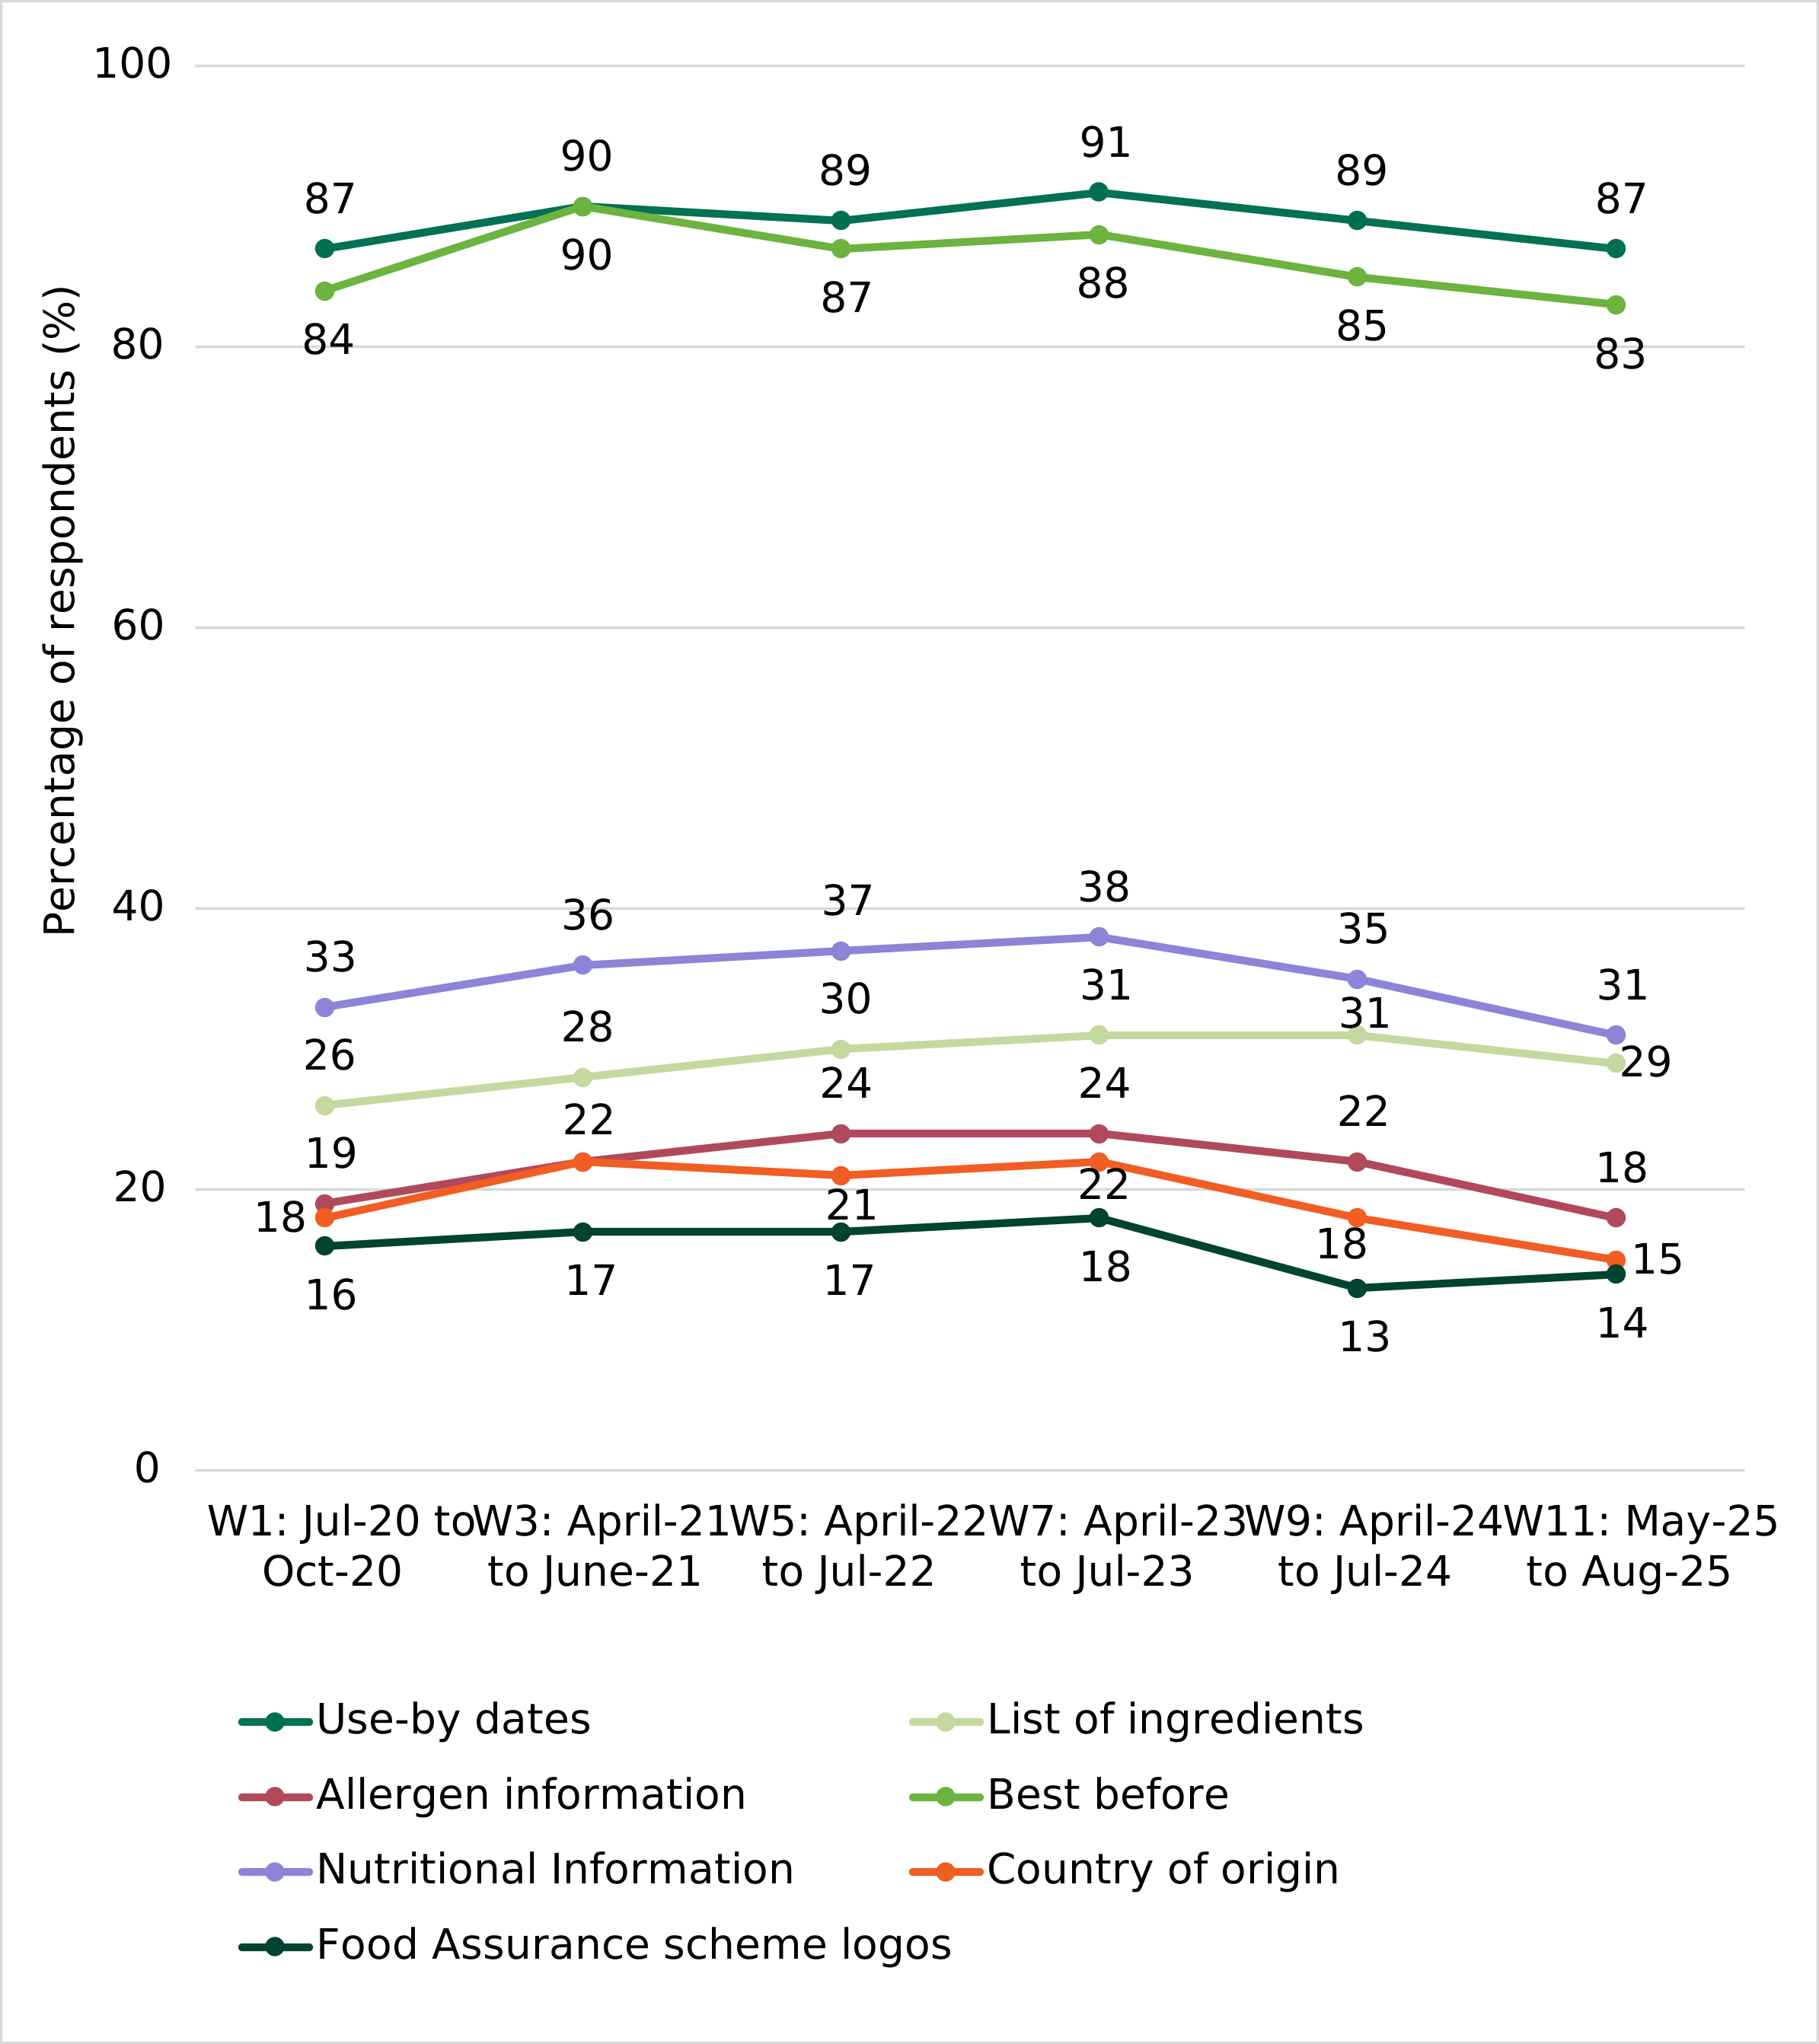
Respondents who shopped for food for themselves or their household were asked what information they checked when buying food. Most respondents reported that they often, i.e. always or most of the time, check the use-by (87%) or best before (83%) date when buying food in Wave 11 (Figure 14). Both measures have declined slightly from peaks observed in earlier waves (for example, 91% often checked use‑by dates in Wave 7 and 90% checked best‑before dates in Wave 3**) but remain comparable with levels reported in Wave 1 (see Appendix B, Q24).
Around three in ten respondents (29%) reported checking the list of ingredients in Wave 11 (always or most of the time). The proportion of respondents who reported this behaviour has remained stable over time.
In Wave 11, 31% of respondents reported checking nutritional information always or most of the time. This was a slight decrease from 38% in Wave 7** but was similar to the level observed in Wave 1 (33%). In Wave 11, 15% of respondents reported checking country of origin information always or most of the time, a slight decrease from highs of 21% to 22% in Waves 3, 5 and 7**. As with other measures, findings in Wave 11 were broadly consistent with those observed in Wave 1.
In Wave 11, 18% of respondents reported checking allergen information always or most of the time, a slight decrease from 24% in Wave 7**, although levels were in line with those observed in Wave 1. The proportion of respondents who reported checking for food assurance scheme logos always or most of the time was 14% in Wave 11 and remained broadly stable across waves (13-18%), barring a slight decline to 13% in Wave 9**.
Figure 14. Type of information respondents in Northern Ireland check always/most of the time while shopping.
Source: Food and You 2: Wave 1, 3, 5, 7, 9 and 11.
8.3 Promotions and price-based marketing
Respondents who reported doing food shopping were asked, from a list of options, what type of promotions (if any) they used when shopping for food and drink[footnote 15] in the past two weeks (see Appendix B, Q25). In Wave 11, 92% of respondents in Northern Ireland reported buying at least one food or drink item on promotion in the past two weeks. Among those who had bought items on promotion, the most commonly reported types were loyalty or membership discounts (e.g., Tesco Clubcard, Nectar Card) (75%), promotions that gave the item at a lower price (e.g., half price) (65%) and promotions that gave you more items (e.g., ‘buy one get one free’ or ‘3 for 2’) (58%). Other promotions were reported less frequently, including end of day reductions (e.g. ‘yellow sticker’ deals) (41%), lunch or dinner meal deals (28%) and seasonal sales (24%). Only 6% said they had not bought any food or drink on promotion in the previous two weeks, while 2% could not remember (Figure 15).
Figure 15. Type of promotions respondents in Northern Ireland used when shopping for food and drink (Wave 11).
| Type of promotion | Percentage of respondents (%) |
|---|---|
| Loyalty or membership discounts (e.g., Tesco Clubcard, Nectar Card) | 75 |
| Offers that give you the item at a lower price (e.g., half price) | 65 |
| Promotions that give you more items (e.g., ‘buy one get one free’ or ‘3 for 2’) | 58 |
| End-of-day reductions (e.g., ‘yellow sticker’ deals) | 41 |
| Lunch or dinner meal deals | 28 |
| Seasonal sales | 24 |
| I have not bought food or drink on price promotion in the last two weeks | 6 |
| I do not remember | 2 |
Source: Food and You 2: Wave 11.
In Wave 11, the use of particular types of promotions also varied between different demographic groups in Northern Ireland in the following ways:
Household income: Those with incomes of less than £19,000 (63%) were less likely to use loyalty and membership discounts than any other income group, for example, 79% of those with household incomes between £32,000-£63,999.
Food security: Those classified as food insecure (38%) were more likely to have used lunch or meal deal promotions in the last 2 weeks than those classified as food secure (26%). Those classified as food secure (79%), were more likely to have used a loyalty or membership discount in the past two weeks than those classified as food insecure (64%).
Northern Ireland Multiple Deprivation Measure (NIMDM): respondents who lived in the least deprived area were more likely to report using loyalty or membership discounts when shopping for food and drink compared with those who lived in the most deprived areas. For example, 83% of those who lived in the least deprived areas (NIMDM 5) reported using loyalty or membership discounts, compared with 67% of those who lived in the most deprived areas (NIMDM 1).
Long-term health condition: respondents without a long-term health condition (79%) were more likely to report using loyalty or membership discounts when shopping for food and drink compared with those with a long-term health condition (64%).
Age[footnote 16]: Younger respondents were more likely than older respondents to report using some types of promotions, particularly ones that gave them more items and lunch or dinner meal deals. For example, 78% of respondents aged 25-34 reported that they used promotions that gave them more items (e.g. buy one get one free) than respondents aged 55-64 (48%).
Gender: women (81%) were more likely than men (69%) to report that they used loyalty or membership discounts. Women (46%) were also more likely than men (37%) to report using end-of-day reductions.
Children in the household: respondents with children aged under 16 in the household (66%) were more likely to report that they used promotions that gave them more items (e.g. buy one get one free) than respondents without (56%).
Respondents who stated that they had bought food or drink with ‘promotions that give you more items (e.g., ‘buy one get one free’ or ‘3 for 2’)’ and/or with ‘offers that give you the item at a lower price (e.g., half price)’, were then asked why they opted for these promotional offers in particular (see Appendix B, Q26). The most popular reason selected was that it reduced the cost of shopping (81%), followed by over half (54%) selecting that they had planned to buy these item(s) anyway. Around 4 in 10 (39%), stated that they were stocking up on items, 17% wanted to try an item they had not tried before and 16% selected that they had bought the item on impulse (Figure 16).
Figure 16. Reasons for using promotions which give them more items or items at a lower price in Northern Ireland (Wave 11)[footnote 17].
| Reasons for using promotion | Percentage of respondents (%) |
|---|---|
| It reduced the cost of my shopping | 81 |
| I planned to buy that item / those items anyway | 54 |
| I was stocking up on items | 39 |
| I wanted to try an item that I had not tried before | 17 |
| I made the purchase on impulse | 16 |
Source: Food and You 2: Wave 11.
From a list of options, respondents who bought on promotion in the past two weeks were asked which items of food and/or drink they bought on impulse because these food and/or drink items were on price promotion (see Appendix B, Q27). The most commonly selected items were fruit and vegetables (including fresh, frozen, tinned or dried) (30%) and chocolates or sweets (29%). Around a quarter (24%) selected crisps and around a fifth selected soft drinks (e.g., sugary fizzy drinks or squash) (21%), cakes, sweet biscuits, puddings, pastries (19%), and dairy products (e.g., milk, butter, cheese, yoghurt) (19%). 22% reported not buying any of the listed items on impulse and 5% did not remember (Figure 17). Overall, around six in ten respondents (62%) had bought at least one ‘high in fat, salt, sugar’ (HFSS) food or drink product on impulse because it was on price promotion. This comprised 25% who bought only HFSS products and 36%[footnote 18] who bought a combination of HFSS and non-HFSS products. A further 12% bought only non-HFSS products on impulse because they were on promotion.
Figure 17. Types of foods purchased on impulse due to promotions in Northern Ireland (Wave 11).
| Food/drink items bought on impulse | Percentage of respondents (%) |
|---|---|
| Fruit & vegetables (incl fresh, frozen, tinned) | 30 |
| Chocolates or sweets | 29 |
| Crisps | 24 |
| Soft drinks (e.g., sugary fizzy drinks or squash) | 21 |
| Dairy products | 19 |
| Cakes, sweet biscuits, puddings or pastries | 19 |
| Ice cream | 13 |
| Cereals with little to no added sugar | 10 |
| Fish | 10 |
| Processed meat | 10 |
| Cereals with added sugar | 7 |
| Nuts or popcorn | 7 |
| I do not remember | 5 |
| Did not purchase these items on impulse | 22 |
Source: Food and You 2: Wave 11.
What do respondents consider most important when buying food?
Respondents were asked which factors were most important when choosing which food to buy from a prompted list of attributes.
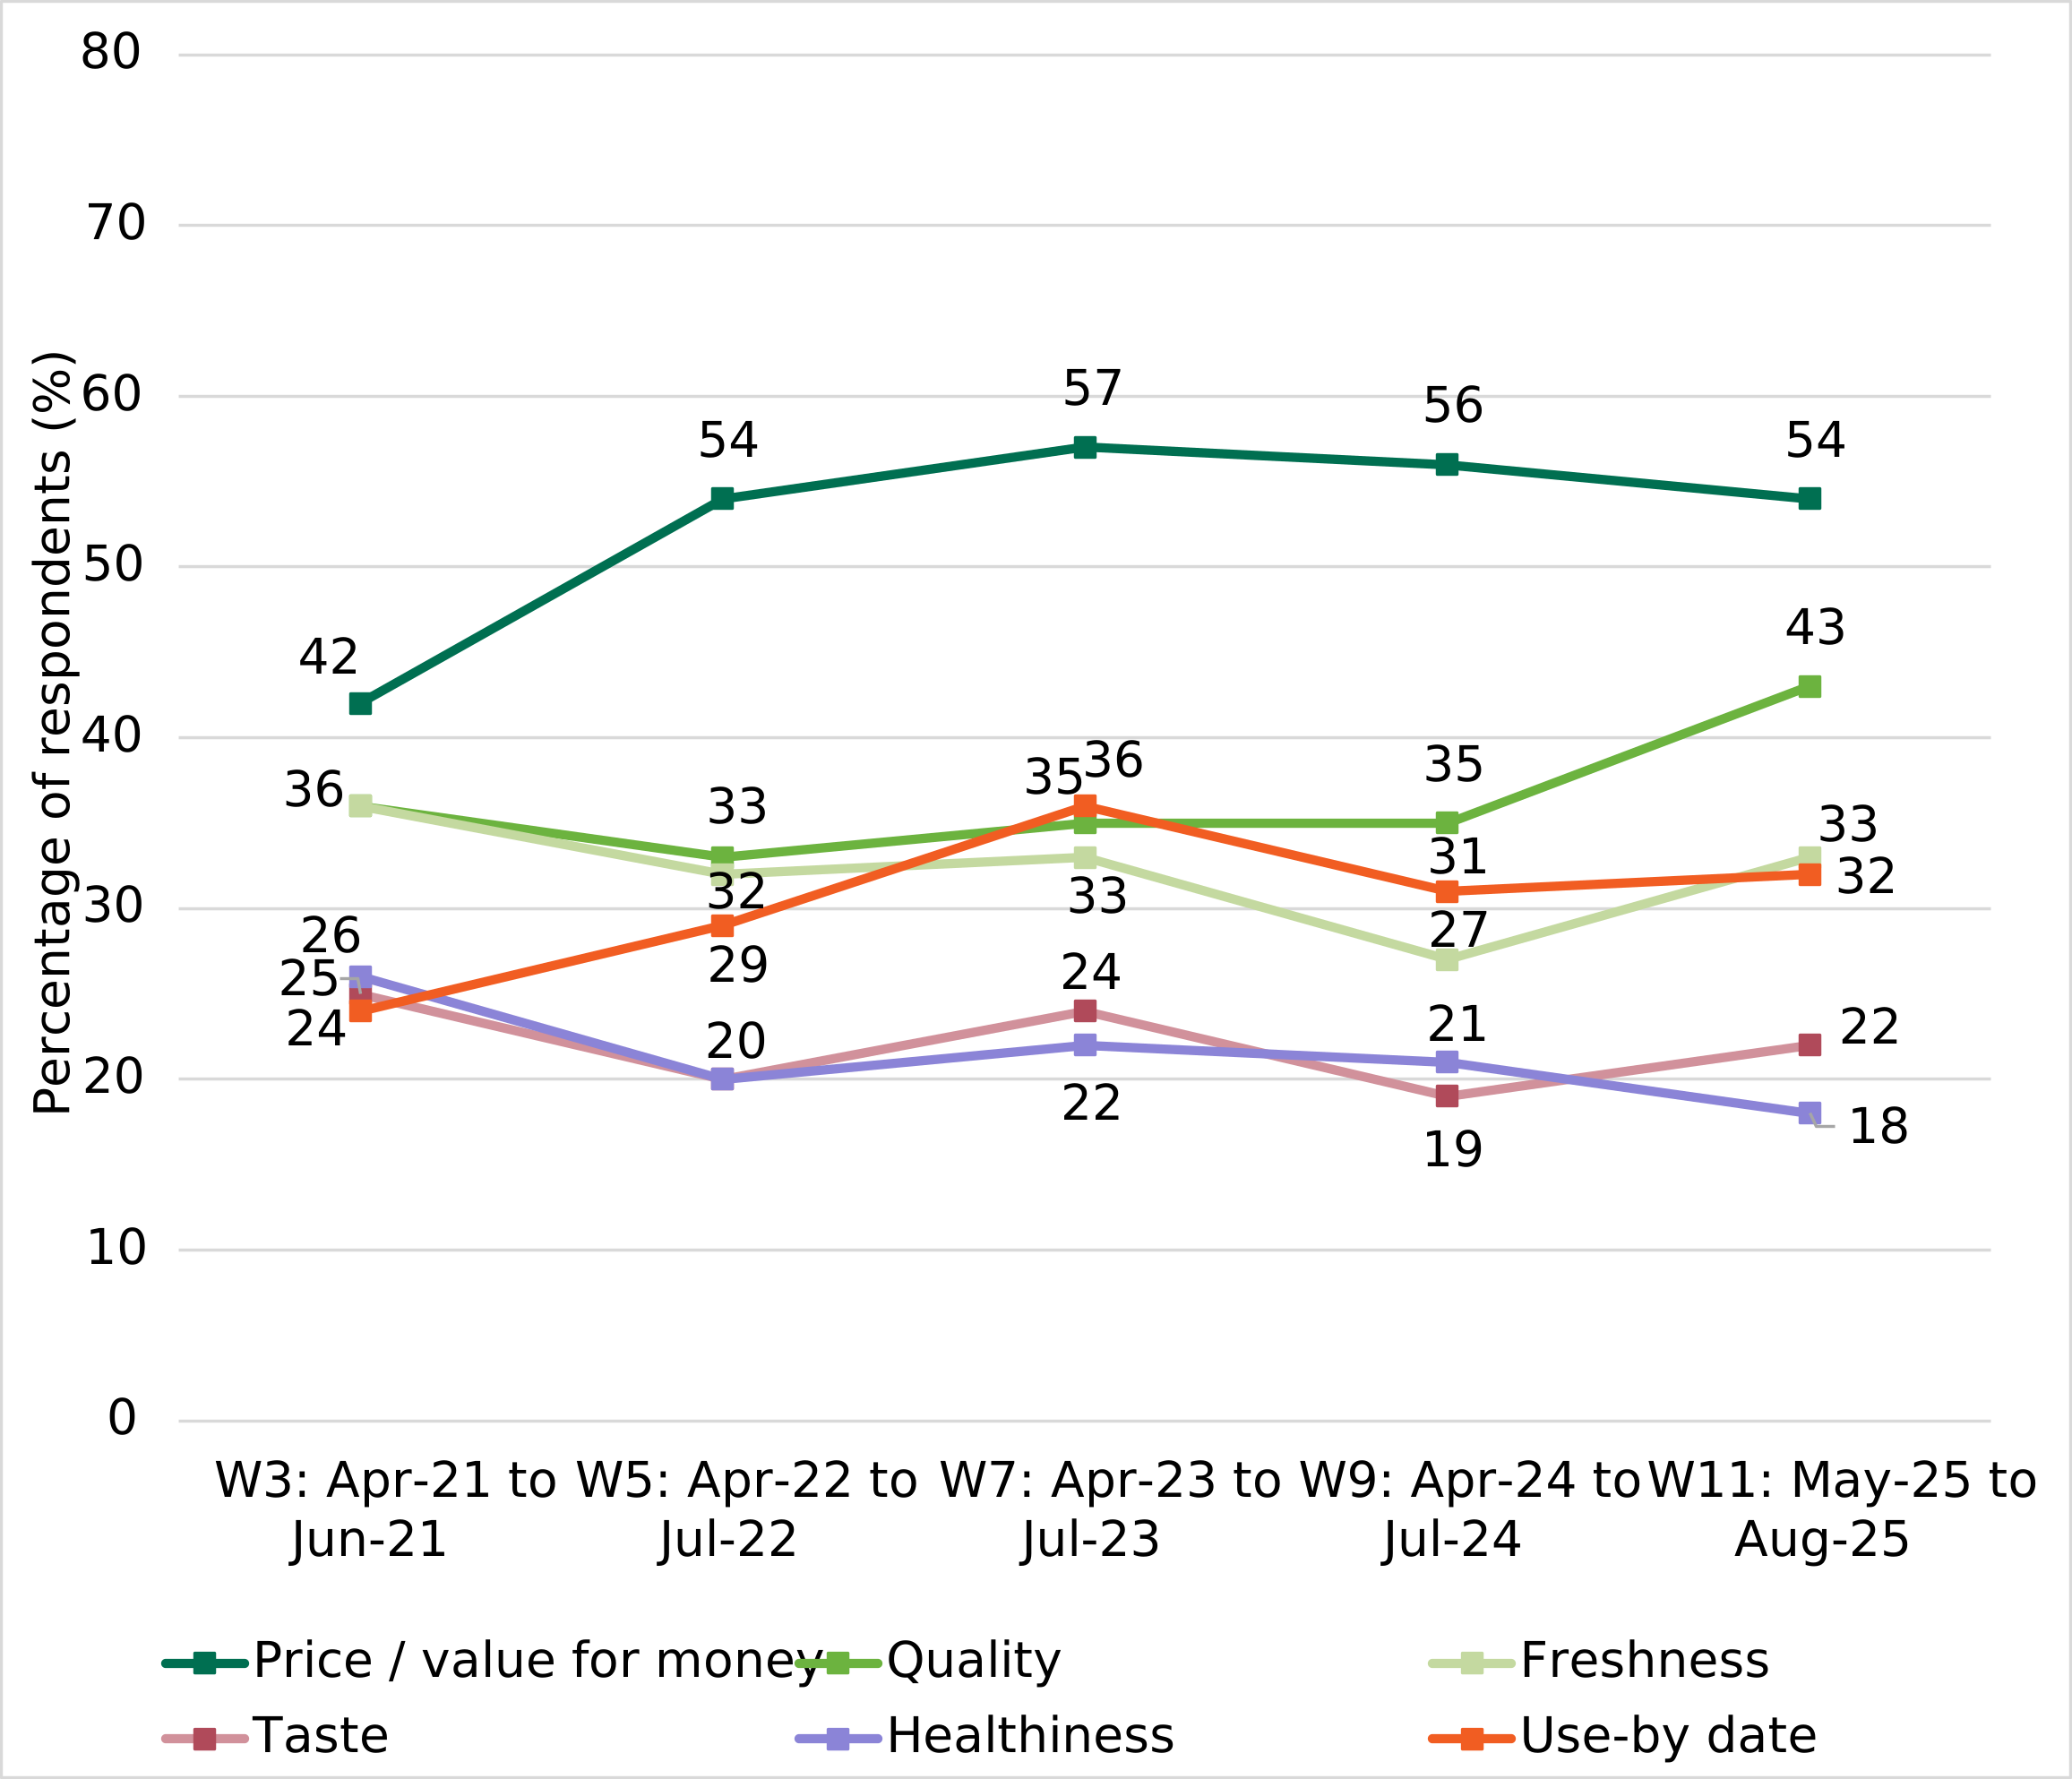
In Wave 11, the three most frequently selected attributes were price/value for money (54%), quality of food (43%) and freshness (33%) (Figure 18). Price/value for money and quality were also the two most commonly selected attributes in earlier waves. The proportion selecting price/value for money increased notably from 42% in Wave 3 and peaked at 57% in Wave 7. In contrast, the proportion selecting quality remained stable between Wave 3 and Wave 9 (33- 36%), increasing slightly to 43% in Wave 11**. Freshness remained broadly stable over time and continued to rank among the most frequently selected attributes (see Appendix B, Q28).
Figure 18. Top 6 options important to respondents in Northern Ireland when choosing which foods they buy[footnote 19].
Source: Food and You 2: Waves 3, 5, 7, 9 and 11.
Views on the environmental impact of food
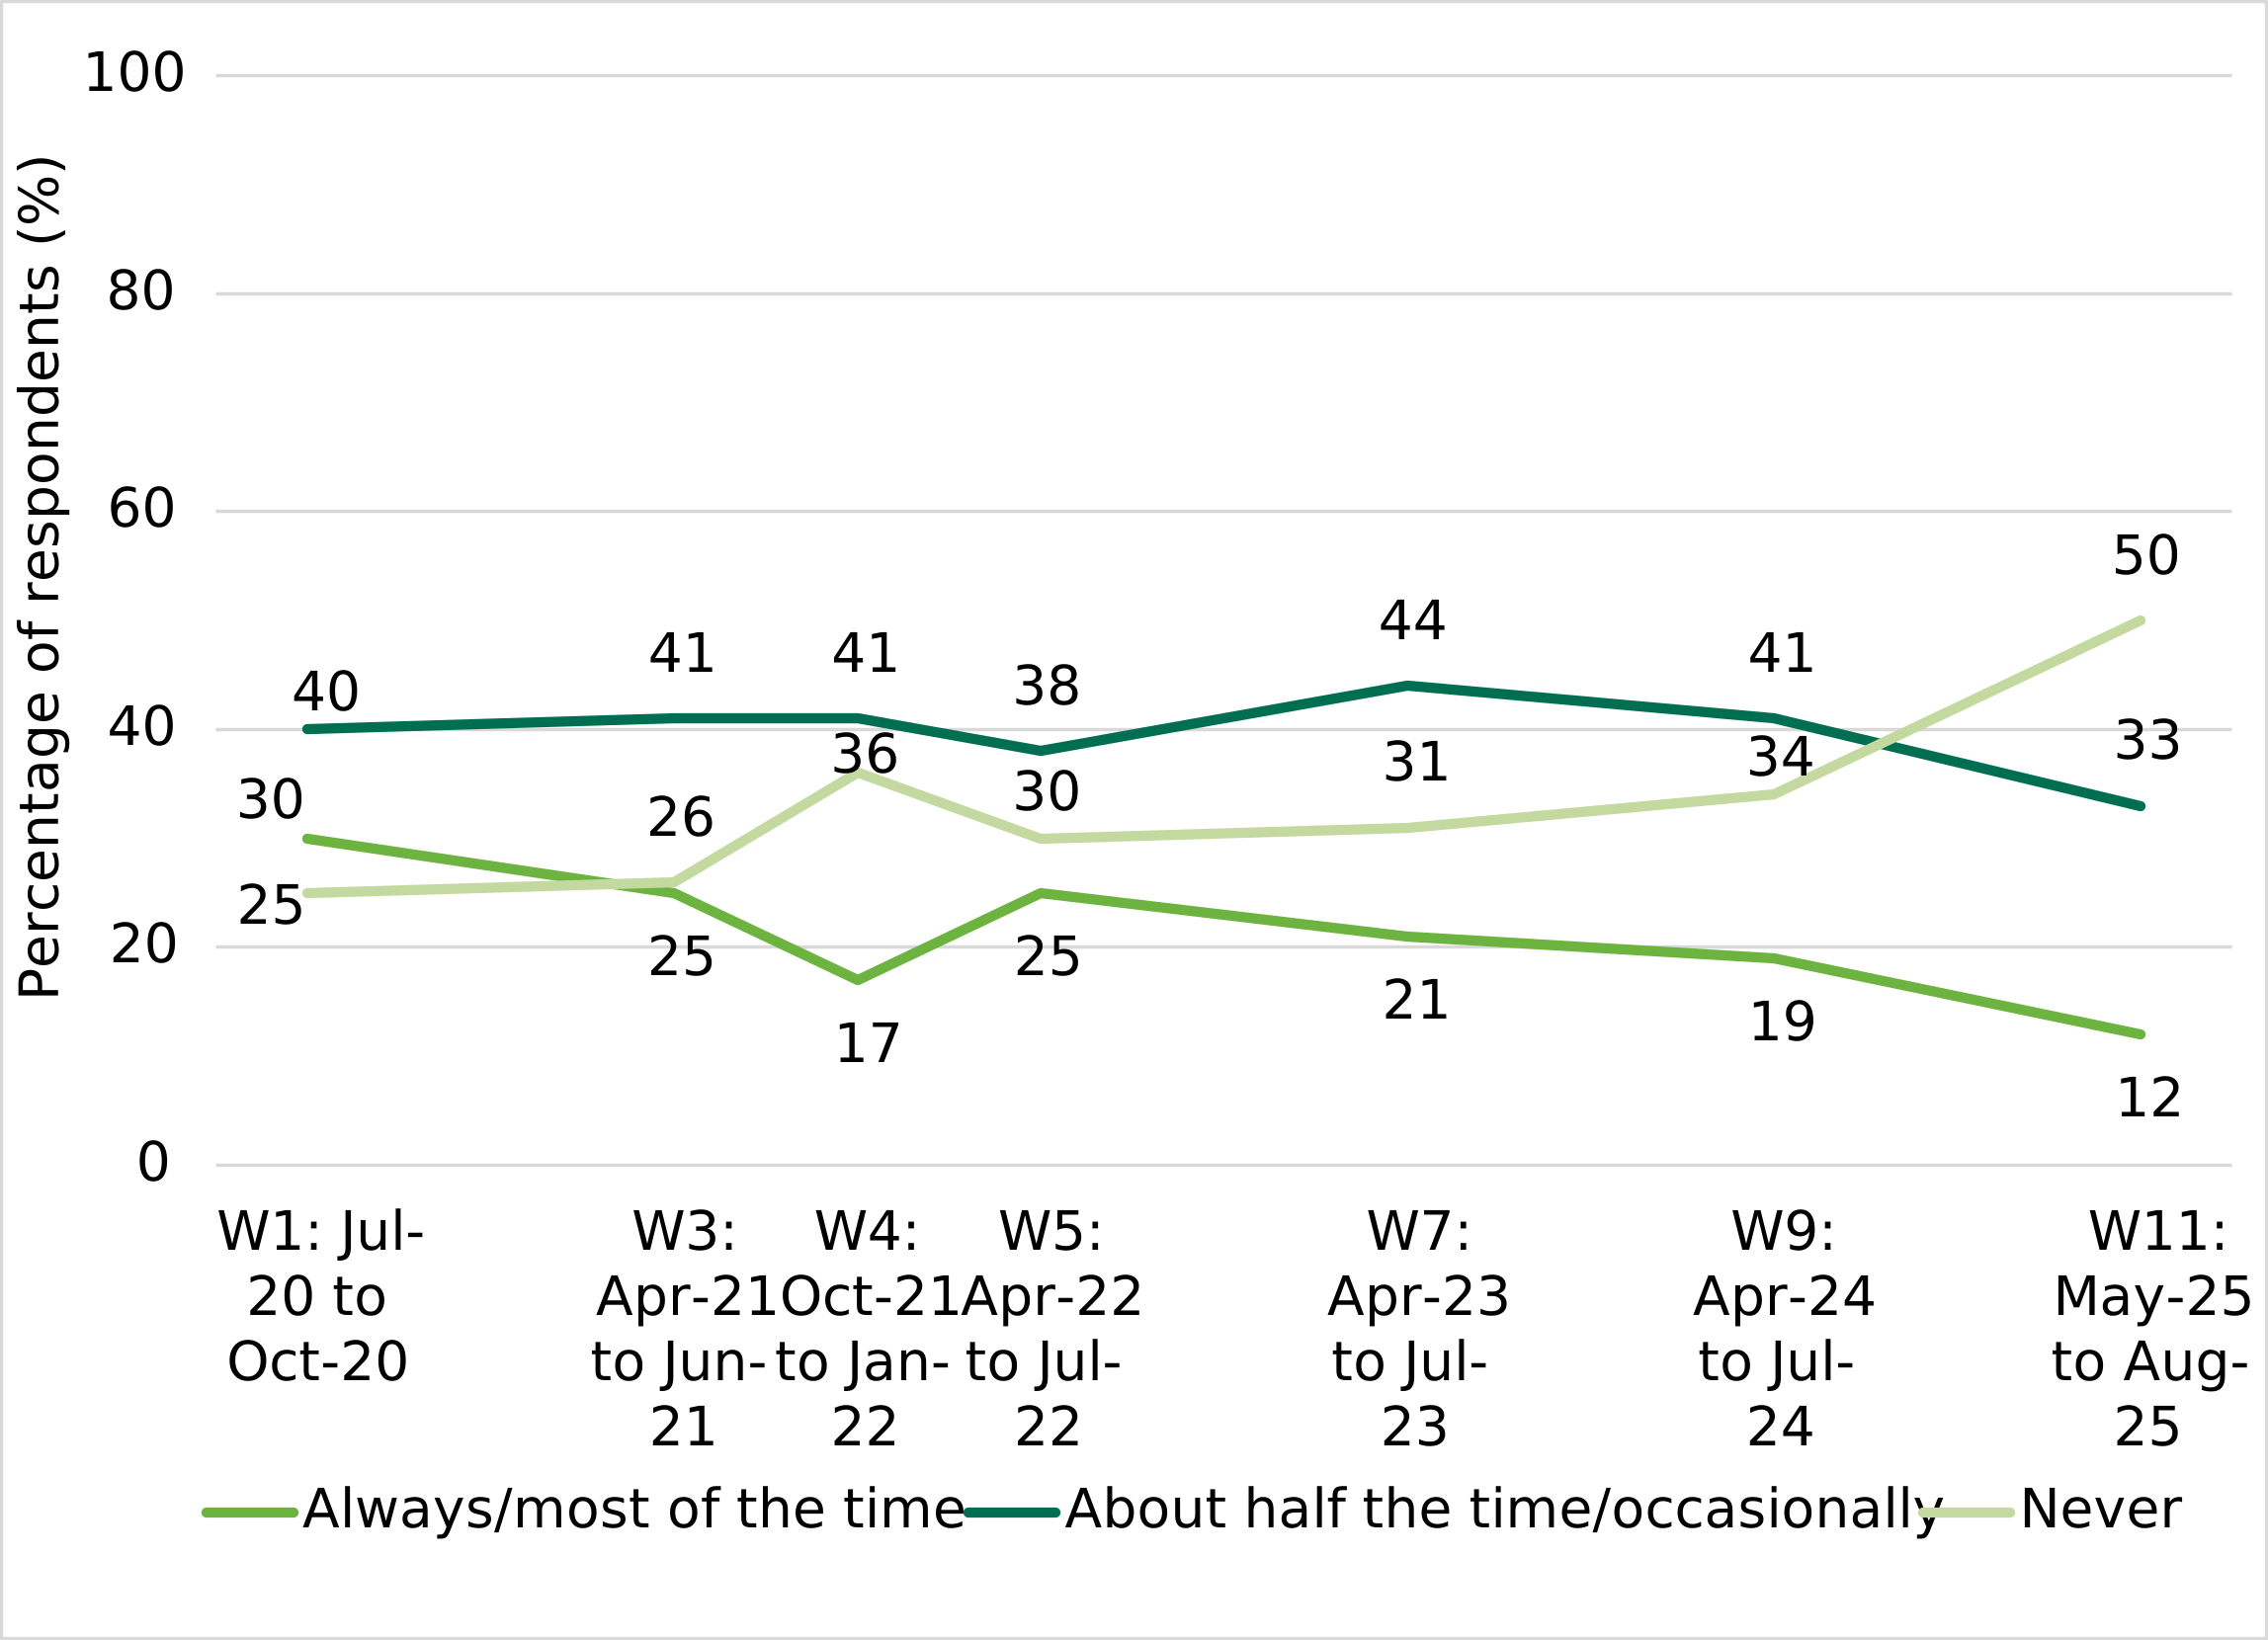
Respondents were asked how frequently they check for information about the environmental impact of food when purchasing food (see Appendix B, Q29). In Wave 11, 12% of respondents reported checking for information about the environmental impact of food ‘always or most of the time’, while 50% reported ‘never’ doing so. Compared with Wave 1, this represented a notable decline in the proportion who reported checking this information ‘always or most of the time’ (from 30% to 12%), and a notable increase in the proportion who reported ‘never’ checking (from 25% to 50%). Those checking either half the time or occasionally remained stable (38-44%) across waves 1 through to 9 before declining slightly in Wave 11 (33%)** (Figure 19).
Figure 19. Frequency of checking environmental impact information when shopping in Northern Ireland.
Source: Food and You 2: Waves 1, 3, 4, 5, 7, 9 and 11.
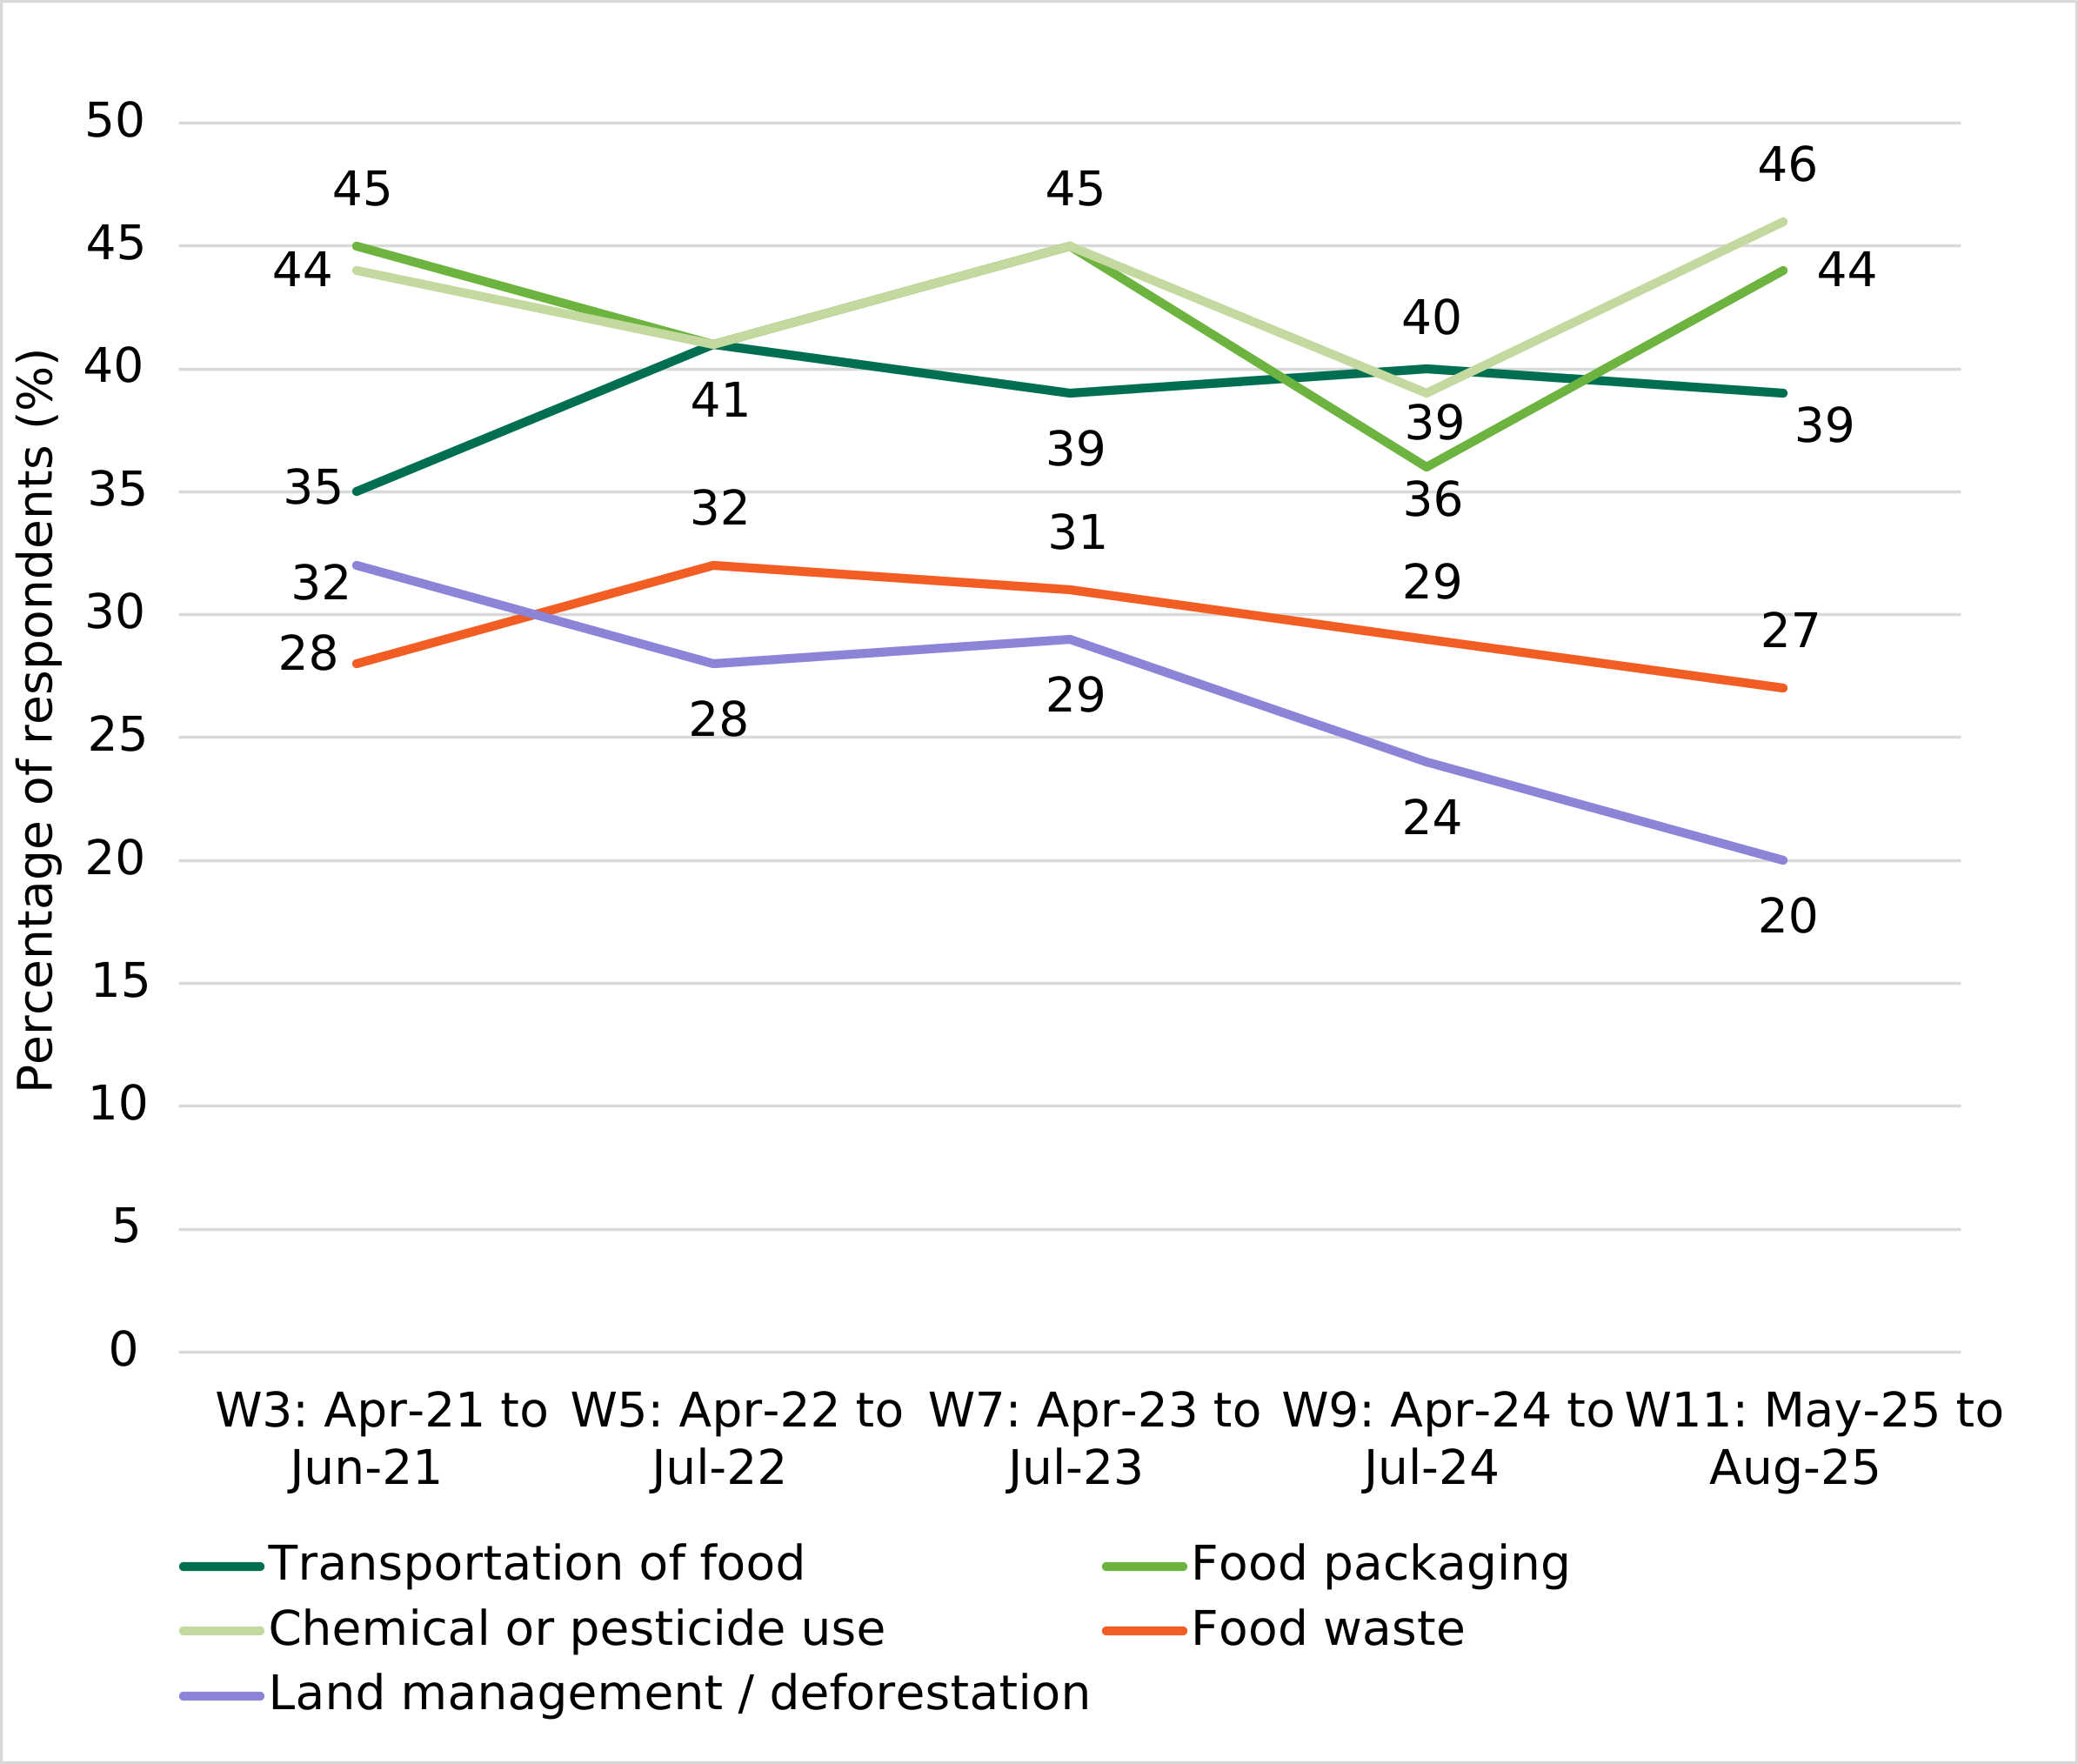
Respondents were also asked, from a list of options, what they thought contributed most to the environmental impact of food (see Appendix B, Q30). The top five factors selected most frequently by participants across waves were the use of chemicals and pesticides (39%-46%), food packaging (36%-45%), the transportation of food (35%-41%), food waste (27%-32%) and land management and/or deforestation (20%-32%) (Figure 20).
In Wave 11, 46% of respondents selected chemical or pesticide use, a slight increase from Wave 5 (41%)** and Wave 9 (39%)** but broadly in line with the other waves. Food packaging was selected by 44% of respondents in Wave 11, a slight increase from Wave 9 (36%)**, but was otherwise broadly consistent across waves. The proportion selecting the transportation of food was 39% in Wave 11 and was broadly in line with the other waves. In Wave 11, 27% selected food waste, a slight decline from 32% in Wave 5**, while remaining broadly consistent with the other waves.
In contrast, the perceived contribution of land management and/or deforestation on the environmental impact of food has declined notably, from 32% in Wave 3 to 20% in Wave 11.
Figure 20. Top 5 important factors thought to contribute most to the environmental impact of food by respondents in Northern Ireland[footnote 20].
Source: Food and You 2: Waves 3, 5, 7, 9 and 11.
9. Chapter 6: Food allergies, intolerances and other hypersensitivities
9.1 Introduction
This chapter presents the prevalence of respondents’ self-reported food hypersensitivities, their confidence in allergen labelling, and their experiences of eating out or ordering takeaway food. This chapter draws on both Wave 11 data and trends data.
‘Food hypersensitivity’ is a term that refers to a bad or unpleasant physical reaction which occurs as a result of consuming a particular food. There are different types of food hypersensitivity including a food allergy, food intolerance and coeliac disease.
9.2 Prevalence of food hypersensitivities
In Wave 11, 25% of respondents in Northern Ireland reported having a food hypersensitivity and 72% reported that they did not. This represents a slight increase from Wave 10**, when 18% reported having a food hypersensitivity. However, Wave 11 levels were broadly in line with those observed in Waves 1 and 2, when 24% reported a food hypersensitivity and 73% reported none (see Appendix B, Q31).
Across all respondents in Wave 11, 14% of respondents reported that they had a food intolerance, 4% reported having a food allergy, 1% reported having coeliac disease and 6% had an unspecified negative reaction to food (Figure 21) (see Appendix B, Q32)[footnote 21].
Figure 21. Prevalence of different types of food hypersensitivity in Northern Ireland (Wave 11).
| Hypersensitivity type | Percentage of respondents (%) |
|---|---|
| Food intolerance | 14 |
| Food allergy | 4 |
| Coeliac disease | 1 |
| Unpleasant reaction to food not specified | 6 |
Source: Food and You 2: Wave 11.
9.3 Eating out with a food hypersensitivity
The FSA provides guidance for food businesses on providing allergen information. Food businesses in the retail and catering sector are required by law to provide allergen information and to follow labelling rules. The type of allergen information which must be provided depends on the type of food business. However, all food business operators must provide allergen information for prepacked and non-prepacked food and drink. Foods which are pre-packed or pre-packed for direct sale (PPDS) are required to have a label with a full ingredients list with allergenic ingredients emphasised.
Food businesses can use precautionary allergen labelling (PAL) to voluntarily provide information about the unintentional presence of the 14 most potent and prevalent allergens, for example ‘may contain’ or ‘produced in a factory with’.
9.4 Confidence in allergen labelling
Respondents who did food shopping and took into account the dietary requirements of themselves or someone else in their household, were asked how confident they were that the information provided on food labelling allows them to identify foods that will cause a bad or unpleasant physical reaction. Overall, 85% of respondents reported being confident (i.e. very confident or fairly confident) in the information provided on food labels (see Appendix B, Q33). This is in line and comparable with all other waves, with the exception of Wave 6** which was slightly higher than all other waves at 91%.
Respondents were asked how confident (very/fairly) they were in identifying foods that will cause a bad or unpleasant physical reaction when buying foods which are sold loose, such as at a bakery or deli-counter. Results shown are based on those who reported using these various types of food outlets. Across waves, respondents were more confident in identifying these foods in-store at a supermarket (66-75%), at independent food shops (65-72%), and when buying food from a supermarket online (58-68%). Confidence in online supermarkets remained stable across waves, with the exception of Wave 5 (68%), which was notably higher than Waves 9, 10 and 11 (58-59%). However, respondents were less confident when buying food from food markets or stalls (37-53%) which declined notably from 53% in Wave 9 to 37% in Wave 11 (see Appendix B, Q34).
Availability and confidence in allergen information when eating out or ordering takeaways
Respondents with a food hypersensitivity were asked how often information which allowed them to identify food that might cause them a bad or unpleasant reaction was readily available when eating out or buying food. In Wave 11, 7% reported that this information was ‘always’ readily available, a slight decline since Wave 4 (15%)**. Three quarters (75%) reported that this was available less often (i.e. most of the time, about half of the time, or occasionally) a notable increase since Wave 2 (62%) and Wave 4 (63%). Nearly one in ten (8%) reported that this information was never readily available in Wave 11 which is broadly stable with previous waves (see Appendix B, Q35).
Respondents with a food hypersensitivity who eat out or order takeaway, were asked how comfortable they felt asking a member of staff for more information about food that might cause them a bad or unpleasant physical reaction. Most respondents (65%) in Wave 11 reported that they were comfortable (i.e. very comfortable or fairly comfortable) asking staff for more information, a notable decline from 78% in Wave 9 but comparable with all other waves. Around a fifth (21%) reported they were not comfortable doing this (i.e. not very comfortable or not at all comfortable) in Wave 11 which is comparable with most other waves (see Appendix B, Q36).
10. Chapter 7: Food safety in the home
10.1 Introduction
This chapter presents respondents’ knowledge and self-reported behaviours relating to food safety at home, including cleaning, cooking, chilling, avoiding cross-contamination and use-by dates. This chapter draws on both Wave 11 and trends data.
10.2 Handwashing in the home
The FSA recommends that everyone should wash their hands before they prepare, cook or eat food, after handling raw food and before preparing ready-to-eat food.
The majority of respondents who cook reported that they always wash their hands before preparing or cooking food across all waves (72-80%). Although the proportion in Wave 11 (74%) was slightly lower than in Waves 2 (80%) and 6 (79%), it was broadly in line with the other survey waves**. However, around a fifth to a quarter (20-26%) across all waves reported that they do not always (i.e., most of the time or less often) wash their hands before preparing or cooking food with 26% reporting this in Wave 11. Across waves, a very small minority (0-2%) reported never doing this (see Appendix B, Q37)
Most respondents who cook raw meat, poultry, or fish (90-94%), reported that they always wash their hands immediately after handling these products across all waves with 92% reporting this in Wave 11. However, 6-9% reported that they do not always (i.e., most of the time or less often) wash their hands immediately after handling raw meat, poultry or fish with nearly 1 in 10 (8%) reporting this in Wave 11, and 0-1% reported never doing this across all waves (see Appendix B, Q38).
Respondents were asked how often, if at all, they washed their hands before eating at home. This behaviour was less prevalent than other handwashing behaviours in the home, with around half of respondents (46-54%) reporting always doing this across waves, with 46% reporting this in Wave 11, a slight decline from 54% in Wave 1**. A similar proportion (44-50%) reported that they did this most of the time or less often with 50% reporting this in Wave 11 and 1-3% stated they never did this (see Appendix B, Q39).
10.3 Chilling
The FSA provides guidance on how to chill food properly to help stop harmful bacteria growing. When asked what temperature the inside of a fridge should be, 65% of respondents in Wave 11 correctly stated that the inside of a fridge should be between 0°C and 5°C, a slight decline from 70% in Wave 1**. A further 15% said the temperature should be above 5°C, 3% said it should be below 0°C, and 16% said they did not know. Across waves, the proportion giving the correct answer ranged from 64% to 70%, while 15-17% reported that the temperature should be above 5°C, between 3-4% selected below 0°C, and 9-16% reported that they did not know (see Appendix B, Q40).
10.4 If and how respondents check fridge temperature
In Wave 11, 56% of respondents who had a fridge reported they had monitored its temperature, with the proportion ranging from 54% to 62% across waves. In Wave 11, 47% reported manually checking this and 9% reported that the fridge has an internal temperature alarm (see Appendix B, Q41). Of the respondents who manually check the temperature of their fridge, 43% reported that they check the temperature of their fridge at least once a week, as recommended by the FSA, with no changes across waves (see Appendix B, Q42).
10.5 Cooking
The FSA recommends cooking food at the correct temperature for the correct length of time to ensure that harmful bacteria are killed. When cooking pork, poultry and minced meat products the FSA recommends that the meat is steaming hot and cooked all the way through, that none of the meat is pink and that any juices run clear.
Respondents were asked to indicate how often they cook food until it is steaming hot and cooked all the way through. The majority (80%) of respondents who cook reported that they always cook food until it is steaming hot and cooked all the way through in Wave 11, a slight decrease from 85% in Wave 8**, however mirroring the same levels observed in Wave 1 (80%) and in most other waves. The proportion who reported not always doing this has risen slightly since Wave 8 (15%) to 20% in Wave 11** (see Appendix B, Q43).
Respondents were also asked how often they ate chicken or turkey when the meat was pink or had pink juices. In Wave 11, 91% of respondents reported that they never ate chicken or turkey when the meat was pink or had pink juices. Across waves, the vast majority of respondents (90-96%) reported never doing this. However, 3-8% reported that they did this at least occasionally, with 7% reporting this in Wave 11 (see Appendix B, Q44).
10.6 Reheating
The FSA recommends reheating food thoroughly and only ever reheating leftovers once, because repeatedly changing temperatures provides more chances for bacteria to grow and cause food poisoning.
Respondents were asked to indicate how they check food is ready to eat when they reheat it. In Wave 11, the most commonly reported method was checking whether the middle was hot, selected by 52% of respondents. This was broadly similar to the proportions reported across other waves (48-56%). The next most commonly reported method was using the instructions on the label, selected by 46% of respondents in Wave 11, which was also broadly in line with the levels observed in other waves (43-48%) (Figure 22) (see Appendix B, Q45).
Figure 22. Methods used by respondents in Northern Ireland when reheating food to check it’s ready to eat (Wave 11).
| Method used | Percentage of respondents (%) |
|---|---|
| Check the middle is hot | 52 |
| Follow label instructions | 46 |
| See it’s bubbling | 33 |
| Stir it | 32 |
| Use a timer | 32 |
| See steam coming from it | 30 |
| Check it is an even temperature throughout | 28 |
| Taste it | 22 |
| Use a thermometer / probe | 19 |
| Put my hand over / touch it | 12 |
Source: Food and You 2: Wave 11.
When respondents were asked how many times, they would consider reheating food after it was cooked for the first time, the majority reported that they would only reheat food once with around 8 in 10 (81-86%) reporting this across all waves, around 1 in 10 (7-10%) reporting twice, and a minority reporting (1-3%) more than twice (see Appendix B, Q46).
Leftovers
Respondents were asked how long they would keep leftovers in the fridge before eating them. The majority (69-75%) reported they would eat leftovers within 2 days across all waves, with 75% reporting this in Wave 11. The proportion of respondents willing to eat leftovers within 3 to 5 days fluctuated across waves, ranging from 14% in Wave 1 to 24% in Wave 10. In Wave 11, 19% reported this, which was higher than Wave 1 but broadly in line with most previous waves(see Appendix B, Q47).
10.7 Avoiding cross-contamination
The FSA provides guidelines on how to avoid cross-contamination. The FSA recommends that people do not wash raw meat because doing so can splash harmful bacteria onto hands, work surfaces, ready-to-eat foods and cooking equipment, which could then cause food poisoning.
Across all waves, the proportion of respondents reporting never washing raw chicken declined slightly from 71% in Wave 5 to 64% in Wave 11**. Whilst those reporting washing raw chicken at least occasionally (i.e. occasionally or more often) increased slightly from 27% in Wave 5 to 33% in Wave 11** (see Appendix B, Q48).
10.8 Use-by and best before dates
Respondents were asked about their understanding of the different types of date labels and instructions on food packaging, as storing food for too long or at the wrong temperature can cause food poisoning. Use-by dates relate to food safety, whereas best before (BBE) dates relate to food quality.
In Wave 11, over two-thirds of respondents (68%) correctly identified the use-by date as the information which shows that food is no longer safe to eat, which has remained broadly stable across waves. 1 in 10 respondents (10%) incorrectly identified the best before date as the date which shows food is no longer safe to eat, a slight decrease from 15% in Wave 1**, but broadly stable with all other waves (see Appendix B, q49).
11. Appendix A: Technical information and definitions
- Food security means that all people always have access to enough food for a healthy and active lifestyle (World Food Summit, 1996). The United States Department of Agriculture (USDA) has created a series of questions which indicate a respondent’s level of food security. Food and You 2 incorporates the 10 item U.S. Adult Food Security Survey Module and uses a 12-month time reference period. Respondents are assigned to one of the following food security status categories:
- high: no reported indications of food-access problems or limitations.
- marginal: one or two reported indications—typically of anxiety over food sufficiency or shortage of food in the house. Little or no indication of changes in diets or food intake.
- low: reports of reduced quality, variety, or desirability of diet. Little or no indication of reduced food intake.
- very low: reports of multiple indications of disrupted eating patterns and reduced food intake.
-
NS-SEC (The National Statistics Socio-economic classification) is a classification system which provides an indication of socio-economic position based on occupation and employment status.
-
Northern Ireland Multiple Deprivation Measure (NIMDM) is the official measure of relative deprivation of a geographical area. NIMDM classification is assigned using postcode or place-name information. It is a multidimensional measure intended to reflect living conditions in an area, including income, employment, health, education, access to services, housing, community safety and the physical environment. Small areas in Northern Ireland are ranked from most deprived to least deprived using the NIMDM.
- The Food Hygiene Rating Scheme (FHRS) helps people make informed choices about where to eat out or shop for food by giving clear information about the businesses’ hygiene standards found at the time of local authority food hygiene inspections. Ratings are given to places where food is supplied or sold directly to people, such as restaurants, pubs, cafés, takeaways, hotels, schools, hospitals, care homes, supermarkets, and other retailers.
The FSA runs the scheme in partnership with district councils in Northern Ireland, and with local authorities in England and Wales. In Northern Ireland, district council food safety officers are responsible for checking food hygiene standards at food premises to assess compliance with legal requirements through unannounced hygiene inspections. Businesses are given a rating from 0 to 5. A rating of 5 indicates that hygiene standards are very good and a rating of 0 indicates that urgent improvement is required.
Food businesses are provided with a sticker which shows their FHRS rating. In Northern Ireland and Wales food businesses are legally required to display their FHRS rating, however in England businesses are encouraged to display their FHRS rating[footnote 22]. FHRS ratings are also available on the FSA website and via other third-party apps
Table 1: Summary of Wave 1 to 11 fieldwork dates and responses in Northern Ireland.
| Wave | Fieldwork dates | No. of respondents in Northern Ireland | No. of households in Northern Ireland |
|---|---|---|---|
| 1 | 29 July 2020 - 6 October 2020 | 2,079 | 1,389 |
| 2 | 20 November 2020 - 21 January 2021 | 1,566 | 997 |
| 3 | 28 April 2021 - 25 June 2021 | 1,626 | 1,088 |
| 4 | 18 October 2021 - 10 January 2022 | 1,575 | 1,036 |
| 5 | 26 April 2022 - 24 July 2022 | 1,875 | 1,243 |
| 6 | 12 October 2022 – 10 January 2023 | 1,644 | 1,088 |
| 7 | 28 April 2023 – 10 July 2023 | 1,526 | 1,009 |
| 8 | 12 October 2023 - 8 January 2024 | 1,550 | 1,017 |
| 9 | 24 April 2024 – 1 July 2024 | 1,470 | 1,006 |
| 10 | 9 October 2024 - 7 February 2025 | 1,454 | 949 |
| 11 | 19 May 2025 - 7 August 2025 | 1,564 | 1,082 |
12. Appendix B: Survey questions featured in report
The survey questions included in this report are set out below. For each item, the list provides the full question wording, response options, wave(s) fielded, base size(s), base description and any relevant guidance notes. Please note the base for these questions is not always the full sample. In some cases, findings relate only to a particular subgroup of respondents, for example because of survey routing, the questions being online only or because the data has been rebased for analytical purposes.
Question 1: How confident are you that A) the food you buy is safe to eat B) the information on food labels is accurate (e.g. ingredients, nutritional information, country of origin)? Responses: very confident, fairly confident, not very confident, not at all confident, it varies, don’t know. Unweighted base in Wave 11: 1,564. All respondents in Northern Ireland answering.
Question 2: How much do you trust or distrust the Food Standards Agency to do its job? That is to make sure that food is safe and what it says it is. Responses: I trust it a lot, I trust it, I neither trust nor distrust it, I distrust it, I distrust it a lot, don’t know. Unweighted base in Wave 11: 944. All respondents in Northern Ireland in relevant questionnaires who know a lot or a little about the FSA and what it does answering.
Question 3: How confident are you that the Food Standards Agency / the government agency responsible for food safety in England, Wales and Northern Ireland…a) Can be relied upon to protect the public from food-related risks (such as food poisoning or allergic reactions from food). b) Is committed to communicating openly with the public about food-related risks. c) Takes appropriate action if a food related risk is identified? Responses: very confident, fairly confident, not very confident, not at all confident, don’t know. Unweighted base in Wave 11: 1,559. All respondents in Northern Ireland in relevant questionnaires who have stated whether or not they have heard of the FSA. Please note: Respondents with little or no knowledge of the FSA were asked about ‘the government agency responsible for food safety’ and those with at least some knowledge of the FSA were asked about the FSA specifically
Question 4: Question/Responses: Derived variable, see USDA Food Security guidance and Technical Report. Unweighted base in Wave 1-11: 66,345. All respondents in England, Wales and Northern Ireland.
Question 5: Question/Responses: Derived variable, see USDA Food Security guidance and Technical Report. Unweighted base across waves 1-11: 17,246 (range between 1,390 in Wave 10 and 2,003 in Wave 1). All respondents in Northern Ireland. Please note: Those with high or marginal food security are referred to as food secure. Those with low or very low food security are referred to as food insecure. More information on how food security is measured and how classifications are assigned and defined can be found in Appendix A and on the USDA Food Security website.
Question 6: In the last 12 months, have you, or anyone else in your household, received a free parcel of food from a food bank or other emergency food provider? Responses: Yes, No, Prefer not to say. Unweighted base across waves 2-11: 9,725 (range between 867 in Wave 9 and 1,079 in Wave 3). All online respondents in Northern Ireland in relevant questionnaires answering. Please note: this question was not included in Wave 1. Please note: in 2020, a government-led scheme delivered boxes of emergency food to clinically vulnerable people across the UK. This was a large-scale scheme, for example, over one million boxes were delivered to clinically vulnerable people in England.
Question 7: Nowadays, do you ever a) eat food from a café / coffee shop / sandwich shop? b) eat out in a pub / bar?, c) eat food from a takeaway, ordered directly from a takeaway shop or restaurant? d) eat food from a takeaway, ordered through an online ordering and delivery company (e.g. Just Eat, Deliveroo, Uber Eats)? e) eat out in a restaurant? f) eat food ordered from an online marketplace (e.g. Amazon, Gumtree, Etsy, etc)? g) eat food ordered through a food-sharing app (e.g. Olio or Too Good To Go)? h) eat food ordered from social media (e.g. Facebook, Instagram, Nextdoor etc)? i) eat food ordered from someone who made it in a home kitchen? Responses Yes, No. Unweighted base across waves 2, 4, 6, 8-11: 6,760 (range between 867 in Wave 9 and 1,037 in Wave 6). All online respondents in Northern Ireland in relevant questionnaires answering.
Question 8: At the moment, how often, if at all, do you eat out or buy food to take out for…? A) Breakfast, B) Lunch, C) Dinner. Responses: Several times a week, About once a week, About 2-3 times a month, About once a month, Less than once a month, Never, Can’t remember. Unweighted base in Wave 11 = 951. All online respondents in Northern Ireland.
Question 9: Generally, when you eat out, what do you consider when deciding where to go? Please think about eating out in restaurants, pubs / bars, and cafés / coffee shops / sandwich shops. Please select all that apply. Responses: Location, Price, Offers, deals or discount available, Quality of food, Type of food (e.g., cuisine or vegetarian/vegan options), Whether information about calories is provided, Whether allergen information is provided, Whether healthier options are available, Ambiance / atmosphere, Cleanliness of the place, Recommendations from family or friends, Reviews (e.g., on TripAdvisor, Google, social media, or in newspapers and magazines), My previous experience of the place, Quality of service, Whether it is an independent business or part of a chain, Food Hygiene Rating, Whether the place is child-friendly, None of these, Don’t know, I don’t eat out. Unweighted base in Wave 11: 936. All online respondents in Northern Ireland answering excluding those who don’t eat out.
Question 10: Generally, when ordering food from takeaways (either directly from a takeaway shop or restaurant or from an online food delivery company like Just Eat, Uber Eats or Deliveroo) what do you consider when deciding where to order from? Responses: My previous experience of the takeaway, Quality of food, Price (including cost of delivery), Type of food (for example cuisine or vegetarian/vegan options), Recommendations from family or friends, Food Hygiene Rating, Location of takeaway, Whether there is a delivery or collection option, Offers, deals or discount available, Delivery/ collection times, Whether food can be ordered online for example through a website or app, Reviews for example on TripAdvisor, Google, social media, or in newspapers and magazines, Whether it is an independent business or part of a chain, Whether healthier options are provided, Whether allergen information is provided, Whether information about calories is provided, None of these, Don’t know. Unweighted base in Wave 11: 850. All online respondents in Northern Ireland excluding those who do not order from takeaways.
Question 11: Have you heard of the Food Hygiene Rating Scheme? Responses: Yes, I’ve heard of it and know quite a lot about it, Yes, I’ve heard of it and know a bit about it, Yes, I’ve heard of it but don’t know much about it, Yes, I’ve heard of it but don’t know anything about it, No, I’ve never heard of it. Unweighted base in Wave 11: 1,564. All respondents in Northern Ireland answering.
Question 12: Have you ever seen this sticker before? Responses: Yes, No, Don’t know/ Not sure. Unweighted base in Wave 11: 1,564. All respondents in Northern Ireland answering.
Question 13: In the last 12 months, have you checked the hygiene rating of a food business? You may have checked a rating at the business premises, online, in leaflets or menus whether or not you decided to purchase food from there. Responses: Yes, I have checked the Food Hygiene Rating of a food business, No, I have not checked the Food Hygiene Rating of a food business, Don’t know. Unweighted base in Wave 11: 1,562. All respondents in Northern Ireland answering.
Question 14: How did you check these ratings? Responses: I looked at an FHRS sticker displayed at the food business (such as in a business’ window or on the door), I checked the food business’ own website, I checked an online food ordering website or app (e.g., Just Eat, Deliveroo, Uber Eats), I checked on the Food Standards Agency’s website; I checked on another website, I checked on an app (e.g., Scores on the Doors; Food Hygiene Rating), I checked in a local newspaper, Other (please specify), Don’t know. Unweighted base in Wave 11: 879. All respondents in Northern Ireland who have checked the Food Hygiene Rating of a food business in the last 12 months answering.
Question 15: How easy or difficult is it to find Food Hygiene Rating Scheme ratings when ordering or shopping for food online? Response: Very easy to find, Quite easy to find, Neither easy nor difficult to find, Quite difficult to find, Very difficult to find, I do not look for Food Hygiene Rating Scheme ratings when ordering or shopping for food online, Don’t know. Unweighted base in Wave 11: 1,542. All respondents in Northern Ireland answering.
Question 16: How easy or difficult is it to find Food Hygiene Rating Scheme ratings when eating out or shopping for food in person? Response: Very easy to find, Quite easy to find, Neither easy nor difficult to find, Quite difficult to find, Very difficult to find, I do not look for Food Hygiene Rating Scheme ratings when eating out or shopping in person, Don’t know. Unweighted base in Wave 11: 1,555. All respondents in Northern Ireland answering.
Question 17: How often do you a) eat sweets and chocolate? b) drink sugary fizzy drinks and diluted squash? c) eat chips and other fried foods? d) eat fruit and vegetables? e) eat oily fish (e.g., salmon, trout, herring, sardines and mackerel)? Responses: Every day, Most days, 2-3 times a week, About once a week, 2-3 times a month, About once a month, Less than once a month, Never, Can’t remember. Unweighted base in Wave 11: 951. All online respondents in Northern Ireland answering.
Question 18: Are you currently taking any vitamin and /or mineral supplements? Responses: Yes, No. Unweighted base in Wave 11: 951. All online respondents in Northern Ireland answering.
Question 19: What vitamin and/or mineral supplements do you take? Responses: Multi-vitamin or mineral, B vitamin(s) or B complex, Vitamin B12 injection, Vitamin C, Vitamin D, Fish oils or Omega 3, Folic acid, Iron, Magnesium, Other. Unweighted base in Wave 11: 491. All online respondents in Northern Ireland that are currently taking any vitamin and /or mineral supplements.
Question 20: How often do you take vitamin and/or mineral supplements? Please think about the vitamin and/or mineral supplements you take most frequently. Responses: Every day, Most days, About once a week, Several times a month, About once a month, Once or a few times over the past year, Can’t remember. Unweighted base in Wave 11: 491. All online respondents in Northern Ireland that are currently taking any vitamin and /or mineral supplements.
Question 21: What do you take vitamin and/or mineral supplements for? Responses: In case of pregnancy or currently pregnant, Vitamin and/or mineral deficiency, Due to tiredness, For general health and wellbeing, Due to age or getting older, For a specific health condition, To improve sports performance, To improve/ fortify my diet, Other reason, Prefer not to say / Don’t know. Unweighted base in Wave 11: 491. All online respondents in Northern Ireland that are currently taking any vitamin and /or mineral supplements.
Question 22: Have you been advised by a medical professional (e.g. a GP or dietician) to take these vitamin and/or mineral supplements? Responses: Yes, No, Don’t know/ Prefer not to say. Unweighted base in Wave 11: 491. All online respondents in Northern Ireland that are currently taking any vitamin and /or mineral supplements.
Question 23: Thinking about the food that you eat, which, if any, of the following changes have you made in the last 12 months for health reasons? Responses: Stopped eating or eaten less red meat, Stopped eating or eaten less poultry, Eaten more fish, Stopped eating or eaten less dairy (e.g., milk, cheese, butter) or eggs, Eaten less processed food, Eaten more fruit and/or vegetables, Eaten less foods high in fat or saturated fat, Eaten less sugar or food/drink high in sugar, Eaten less salt or food high in salt, I have made other changes (please specify), I have not made any changes to the food I eat for health reasons in the last 12 month, Don’t know. Unweighted base in Wave 11: 951. All online respondents in Northern Ireland answering.
Question 24: When shopping for food, how often, if at all, do you check…A) Use-by dates. B) Best before dates. C) List of ingredients. D) Allergen information. E) Nutritional information (e.g., calories, fat, sugar, salt). F) Country of origin. G) Food assurance scheme logos. Responses: Always, Most of the time, About half the time, Occasionally, Never, Don’t know. Unweighted base across waves 1, 3, 5, 7, 9 and 11: 5,523 (range between 802 in Wave 9 and 1100 in Wave 1). All online respondents in Northern Ireland in relevant questionnaires who ever do food shopping for themselves or their household answering.
Question 25: What types of promotions, if any, did you use when shopping for food and drinks in the last two weeks? Please remember to exclude promotions for alcohol and non-food / drink items. Responses: Promotions that give you more items (e.g., ‘buy one get one free’ or ‘3 for 2’), Lunch or dinner meal deals, Seasonal sales, Offers that give you the item at a lower price (e.g., half price), End-of-day reductions (e.g., ‘yellow sticker’ deals), Loyalty or membership discounts (e.g., Tesco Clubcard, Nectar Card), I have not bought food or drink on price promotion in the last two weeks, I do not remember. Unweighted base in Wave 11: 879. All online respondents in Northern Ireland who ever do food shopping for themselves or their household.
Question 26: Which of the following reasons apply to why you have used promotions that give you more items / offers that give you the item at a lower price / promotions that give you more items and offers that give you the item at a lower price}? Responses: I was stocking up on items, I made the purchase on impulse, It reduced the cost of my shopping, I wanted to try an item that I had not tried before, I planned to buy that item / those items anyway, I cannot remember, I do not know. Unweighted base in Wave 11: 713, All online respondents in Northern Ireland who take advantage of promotions which give them more items or items at a lower price.
Question 27: In the last two weeks, which of the following, did you buy on impulse because they were on price promotion? Responses: Fruit and vegetables (including fresh, frozen, tinned or dried fruits and vegetables), Chocolates, sweets, Cakes, sweet biscuits, puddings, pastries, Ice cream, Dairy products (e.g., milk, butter, cheese, yoghurt), Crisps, Nuts or popcorn, Soft drinks (e.g., sugary fizzy drinks or squash), Processed meat, Fish, Cereals with added sugar (e.g., Coco Pops, Crunchy Nut, Frosties), Cereals with little to no added sugar (e.g., Weetabix, Porridge Oats, Cornflakes), I did not make impulse purchases of these items on promotion in the last two weeks, I do not remember. Unweighted base in Wave 11: 838. All online respondents in Northern Ireland who take advantage of promotions which give them more items or items at a lower price.
*Question 28: What is most important to you when you are choosing which foods to buy? Select up to three answers. Responses: Price/value for money, Quality, Freshness, Taste, Appearance of food, Healthiness, Use-by date/how long it will keep for, Country of origin, Ingredients, That it is ethical, That it is eco-friendly, Farming methods (for example, organic or free-range farming), How it is made or how it is produced, Choice/availability/variety, Buying what my household/ children want, Trust in supplier, Safety of product, Convenience/how easy it is to cook or prepare, Other, Don’t know. Unweighted base across waves 3, 5, 7, 9 and 11: 5,395 (range between 867 in Wave 9 and 1,563 in Wave 11). All respondents in Northern Ireland in relevant waves answering. Please note: this question was not included in Waves 1, 2, 4, 6, 8 or 10. Please also note that the potential options for this question have changed over waves, however this does not affect the results reported here.
Question 29: When purchasing food, how often do you do the following… b) check for information on environmental impact. Responses: always, most of the time, about half the time, occasionally, never, don’t know. Unweighted base across waves 1, 3, 4, 5, 7, 9 and 11: 7,600 (range between 867 in Wave 9 and 1,558 in Wave 11). All respondents in Northern Ireland in relevant waves answering. Please note: these questions were not included in Waves 2, 6, 8 or 10.
Question 30: What do you think contributes most to the environmental impact of food? Please select up to three answers. Responses: Transportation of food, Food packaging, The way in which crops are grown, Food processing, Chemical or Pesticide use, Production of meat, Food waste, Land management / deforestation, Consumer demand / trends, Water usage, Other, please specify, Don’t know. Unweighted base across waves 3, 5, 7, 9 and 11: 5,394 (range between 867 in Wave 9 and 1,562 in Wave 11). All respondents in Northern Ireland in relevant waves answering. Please note: this question was not included in Waves 1, 2, 4, 6, 8 or 10.
Question 31: Do you suffer from a bad or unpleasant physical reaction after consuming certain foods, or avoid certain foods because of the bad or unpleasant physical reaction they might cause? Responses: Yes, No, Don’t know, Prefer not to say. Unweighted base across waves 1- 11: 17,850 (range between 1,451 in Wave 10 and 2,062 in Wave 1). All respondents in Northern Ireland in relevant questionnaires answering.
Question 32: This data is derived from multiple questions, see the Technical Report for further details. See data tables (REACTYPE_1 to REACTYPE_18 combined NET). Unweighted base = 1,561, All respondents in Northern Ireland who have named a food from which they suffer from a bad or unpleasant physical reaction after consuming certain foods, or have named a food they avoid because of the bad or unpleasant physical reaction they might cause answering. Wave 11. Please note: the figures shown do not add up to 100% as not all responses are shown.
Question 33: How confident are you that the information provided on food labels allows you to identify foods that will cause you, or another member of your household, a bad or unpleasant physical reaction? Responses: Very confident, Fairly confident, Not very confident, Not at all confident, It varies from place to place, Don’t know. Unweighted base across waves 3, 5, 6, 7, 9, 10 and 11: 3,229 (range between 394 in Wave 9 and 505 in Wave 3). All online respondents in relevant questionnaires who consider the dietary requirements of themselves / someone else in the household when shopping for food. Please note: this question was not included in Waves 4 or 8 and data from waves 1 and 2 is no longer comparable due to rebasing of question in wave 11.
Question 34: When buying food that is sold loose (e.g. at a bakery or deli counter), how confident are you that you can identify foods that will cause you or another member of your household a bad or unpleasant physical reaction? Consider food sold loose from the following sources…A) Supermarkets in store. B) Supermarkets online. C) Independent food shops. D) Food markets/stalls. Responses: Very confident, Fairly confident, Not very confident, Not at all confident, It varies from place to place, Don’t know. Unweighted base across waves 3, 5, 6, 7, 9, 10 and 11: a) 3,114 (range between 367 in Wave 9 and 485 in Wave 3), b) 2,527 (range between 278 in Wave 9 and 410 in Wave 3), c) a) 3,021 (range between 352 in Wave 9 and 469 in Wave 3) and d) a) 2,765 (range between 314 in Wave 9 and 434 in Wave 3). All online respondents in relevant questionnaires who consider the dietary requirements of themselves / someone else in the household when shopping for food, excluding those who respond ‘I don’t buy food from here’ or ‘I don’t buy food sold loose’ answering.
Question 35: When eating out or buying food to take out, how often, if at all, is the information you need to help you identify food that might cause you a bad or unpleasant physical reaction readily available? By readily available we mean that you are able to access the information in writing (e.g. on a menu or food label) without needing to ask a member of staff to provide it to you. Responses: Always, Most of the time, About half of the time, Occasionally, Never, Don’t know. Unweighted base across waves 3, 5, 6, 7, 9, 10 and 11: 1,281 (range between 169 in Wave 9 and 210 in Wave 11). All online respondents in Northern Ireland in relevant questionnaires who eat out or order takeaway, who suffer from a bad or unpleasant physical reaction after consuming certain foods, or avoid certain foods because of the bad or unpleasant physical reaction they might cause answering.
Question 36: How comfortable do you feel asking a member of staff for more information about food that might cause you a bad or unpleasant physical reaction? Responses: Very comfortable, Fairly comfortable, Not very comfortable, Not at all comfortable, It varies from place to place, Don’t know. Unweighted base across waves 3, 5, 6, 7, 9, 10 and 11: 1,281 (range between 169 in Wave 9 and 210 in Wave 11). All online respondents in Northern Ireland in relevant questionnaires who eat out or order takeaway, who suffer from a bad or unpleasant physical reaction after consuming certain foods, or avoid certain foods because of the bad or unpleasant physical reaction they might cause answering.
Question 37: When you are at home, how often, if at all, do you wash your hands before starting to prepare or cook food? Responses: Always, Most of the time, About half the time, Occasionally, Never, I don’t cook, Don’t know. Unweighted base across waves 1, 2, 4, 5, 6, 8- 11: 8,293 (range between 860 in Wave 2 and 1,111 in Wave 1). All online respondents in Northern Ireland in relevant questionnaires answering
Question 38: When you are at home, how often, if at all, do you wash your hands do you wash your hands immediately after handling raw meat, poultry or fish? Responses: Always, Most of the time, About half the time, Occasionally, Never, Don’t know. Unweighted base across waves 4, 5, 6 and 8- 11: 6,173 (range between 767 in Wave 9 and 947 in Wave 6). All online respondents in Northern Ireland in relevant questionnaires who ever do some food preparation or cooking for their household, excluding those who don’t cook meat, poultry or fish answering.
Question 39: Question: When you are at home, how often, if at all, do you wash your hands before eating? Responses: Always, Most of the time, About half the time, Occasionally, Never, Don’t know. Unweighted base across waves 4, 5, 6 and 8- 11: 7,020 (range between 867 in Wave 9 and 1,193 in Wave 1). All online respondents in Northern Ireland in relevant questionnaires answering
Question 40: What do you think the temperature inside your fridge should be? Responses: Less than 0 degrees C (less than 32 degrees F), Between 0 and 5 degrees C (32 to 41 degrees F), More than 5 but less than 8 degrees C (42 to 46 degrees F), 8 to 10 degrees C (47 to 50 degrees F) (2%), More than 10 degrees C (over 50 degrees F), Other, Don’t know. Unweighted base across waves 1, 2, 4, 5, 6 and 8- 11: 9,542 (range between 865 in Wave 9 and 1,544 in Wave 11). All respondents in Northern Ireland in relevant questionnaires, excluding ‘I don’t have a fridge’ answering.
Question 41: Do you, or anyone else in your household, ever check your fridge temperature? Responses: Yes, No, I don’t need to - it has an alarm if it is too hot or cold, Don’t know. Unweighted base across waves 1, 2, 4, 5, 6 and 8 - 11: 9,539 (range between 862 in Wave 9 and 1,551 in Wave 11). All respondents in Northern Ireland in relevant questionnaires, excluding ‘I don’t have a fridge’ answering.
Question 42: How often, if at all, do you or someone else in your household check the temperature of the fridge? Responses: At least daily, 2-3 times a week, Once a week, Less than once a week but more than once a month, Once a month, four times a year, once or twice a year, Never, Don’t know. Unweighted base across waves 1, 2, 4, 5, 6 and 8- 11: 4,572 (range between 411 in Wave 9 and 739 in Wave 11). All respondents in Northern Ireland in relevant questionnaires in households where someone checks the temperature of their fridge answering.
Question 43: How often, if at all, do you cook food until it is steaming hot and cooked all the way through? Responses: Always, Most of the time, About half of the time, Occasionally, Never, Don’t know. Unweighted base across waves 1, 2, 4, 5, 6 and 8- 11: 8,293 (range between 788 in Wave 9 and 1,111 in Wave 1). All online respondents in Northern Ireland in relevant questionnaires who ever do some food preparation or cooking for their household answering.
Question 44: How often, if at all, do you eat chicken or turkey when the meat is pink or has pink or red juices? Responses: Always, Most of the time, About half of the time, Occasionally, Never, Don’t know. Unweighted base across waves 1, 2, 4, 5, 6 and 8- 11: 8,479 (range between 821 in Wave 9 and 1,135 in Wave 1). All online respondents in Northern Ireland in relevant questionnaires who are not vegan, vegetarian or pescatarian, excluding those who do not eat chicken or turkey answering.
Question 45: When reheating food, how do you know when it is ready to eat? Select all that apply. Responses: I check the middle is hot, I follow the instructions on the label, I can see it’s bubbling, I use a timer to ensure it has been cooked for a certain amount of time, I check it’s an even temperature throughout, I can see steam coming from it, , I taste it, I stir it, I put my hand over it/touch it, I use a thermometer/probe, None of the above, I don’t check. Unweighted base across waves 1, 2, 4, 5, 6 and 8- 11= 7,994 (range between 768 in Wave 9 and 1,057 in Wave 1). All online respondents in Northern Ireland relevant questionnaires who ever do some food preparation or cooking for their household, excluding those responding ‘I don’t reheat food’ and those who have ‘Not stated’ whether or not they reheat food answering.
Question 46: How many times would you consider reheating food after it was cooked for the first time? Responses: Not at all, Once, Twice, More than twice, Don’t know. Unweighted base across waves 1, 2, 4, 5, 6 and 8- 11: 7,983 (range between 768 in Wave 9 and 1,046 in Wave 1). All online respondents in Northern Ireland in relevant questionnaires who reheat food answering.
Question 47: When is the latest you would consume any leftovers stored in the fridge? Responses: The same day, Within 1-2 days, Within 3-5 days, More than 5 days later, It varies too much, Don’t know. Unweighted base across waves 1, 2, 4, 5, 6 and 8- 11: 8,968 (range between 867 in Wave 9 and 1,193 in Wave 1). All online respondents in Northern Ireland in relevant questionnaires answering.
Question 48: How often, if at all, do you wash raw chicken? Responses: Always, Most of the time, About half of the time, Occasionally, Never, Don’t know. Unweighted base across waves 5, 6 and 9- 11: 4,984 (range between 788 in Wave 9 and 1,415 in Wave 11). All respondents in Northern Ireland in relevant questionnaires who ever do some food preparation or cooking for their household answering.
Question 49: Which of these shows when food is no longer safe to eat? Responses: Use-by date, Best before date, Sell by date, Display until date, All of these, It depends, None of these, Don’t know. Unweighted base across waves 2, 4, 5, 6 and 8 - 11= 7,775 (range between 867 in Wave 9 and 1,037 in Wave 6). All online respondents in Northern Ireland in relevant questionnaires answering.
© Crown copyright 2026
This publication (not including logos) is licensed under the terms of the Open Government Licence v3.0 except where otherwise stated. Where we have identified any third-party copyright information you will need to obtain permission from the copyright holders concerned.
For more information and to view this licence:
- visit the National Archives website
- email psi@nationalarchives.gov.uk
- write to: Information Policy Team, The National Archives, Kew, London, TW9 4DU
For enquiries about this publication, contact the Food Standards Agency.
Project reference: FS430662
Find us on Facebook: facebook.com/FoodStandardsAgency / facebook.com/FSAInNI
Follow us on LinkedIn / LinkedIn NI
-
Findings for Scotland are reported separately by FSS. ↩
-
Please note some findings in the food security chapter, refer to England, Wales and Northern Ireland and are clearly labelled accordingly. ↩
-
Further findings regarding trust and confidence in food systems and the FSA, including cross country comparisons can be found in the Food and You 2 Wave 11 report and accompanying data tables. ↩
-
Those who know a lot or little about the FSA. ↩
-
Percentages may not sum due to rounding. ↩
-
Respondents aged 16-24 not included due to low base size for this group. ↩
-
Further findings on FHRS measures and trends are published separately in the England/Wales/Northern Ireland FHRS report. Accordingly, data included here only refers to Northern Ireland specific questions on eating out and takeaway use. ↩
-
Data for respondents with an income of £96,000 or more is not reported due to a small number of respondents being in this group. ↩
-
Data for respondents aged 16-24 and 75 or older are not reported due to a small number of respondents being in this group. ↩
-
Percentages may not sum to 100 due to rounding ↩
-
Including takeaway ordered directly from a takeaway shop or restaurant or via an online food delivery company. ↩
-
Responses to other FHRS questions (not included in this report) as well as data from England and Wales are available in the full dataset and tables. A more detailed Wave 11 FHRS report which comments on findings across England, Wales and Northern Ireland will be published separately. ↩
-
Percentages may not sum to 100% due to rounding and the exclusion of ‘Can’t remember’ responses. ↩
-
Questions on environmental impact and sustainability in this chapter were co-funded by Defra. ↩
-
Note, respondents were asked to exclude alcohol and non-food/drink items and respondents could select more than one type of promotion from those listed. ↩
-
Respondents aged 16-24 and over 75 not reported due to low base size. ↩
-
Less than 1% of respondents selected ‘can’t remember’ and ‘don’t know’ and therefore aren’t included in this graph ↩
-
Figures may not sum to net totals due to rounding. ↩
-
Top six choices presented due to healthiness and taste being of equivalent rank over time. Full dataset can be found in accompanying wave and trend data tables, including other reasons that were selected by fewer respondents. ↩
-
Top five choices presented. Full dataset, including other response options, can be found in accompanying wave and trend data tables. ↩
-
Please note: the figures in Figure 21 do not add up to 100% as not all responses are shown. ↩
-
Legislation for the mandatory display of FHRS ratings was introduced October 2016 in Northern Ireland. ↩