Non-association independent schools inspections and outcomes in England, August 2018: main findings
Updated 21 September 2020

© Crown copyright 2020
This publication is licensed under the terms of the Open Government Licence v3.0 except where otherwise stated. To view this licence, visit nationalarchives.gov.uk/doc/open-government-licence/version/3 or write to the Information Policy Team, The National Archives, Kew, London TW9 4DU, or email: psi@nationalarchives.gov.uk.
Where we have identified any third party copyright information you will need to obtain permission from the copyright holders concerned.
This publication is available at https://www.gov.uk/government/statistics/non-association-independent-schools-inspections-and-outcomes-in-england-august-2018/non-association-independent-schools-inspections-and-outcomes-in-england-august-2018-main-findings
This release contains:
- most recent inspections and outcomes as at 31 August 2018
- provisional data for inspections completed between 1 September 2017 and 31 August 2018
- revised data for inspections completed between 1 September 2016 and 31 August 2017
Non-association independent school inspection outcomes have remained broadly the same.
At the end of August 2018, 69% of schools inspected were judged good or outstanding at their most recent inspection. This is one percentage point higher than the proportion judged good or outstanding as at 31 August 2017.
Ineffective safeguarding judgements remain high.
Ten per cent of schools assessed failed the safeguarding judgement.
1. Introduction
There are over 2,300 independent schools in England. Of these Ofsted inspect 1,076 non-association independent schools, which fall into two categories: independent special schools (43%) and other independent schools (57%).
Independent schools, which are members of associations, are inspected by the Independent Schools Inspectorate (ISI) or the School Inspection Service (SIS).
2. Inspection outcomes profile as at 31 August 2018
Infographic stating 'The proportion of non-association independent schools judged good or outstanding is 69%'.
By the 31 August 2018, 1,011 non-association independent schools had received a standard inspection [footnote 1]. Sixty-nine per cent were judged good or outstanding, 18% were judged requires improvement and 13% were judged inadequate at their most recent inspection (Figure 1) [footnote 2]. The proportion of schools judged good or outstanding has increased by one percentage point since 31 August 2017.
Figure 1: Overall effectiveness of non-association independent schools at their most recent inspection, since 31 August 2013
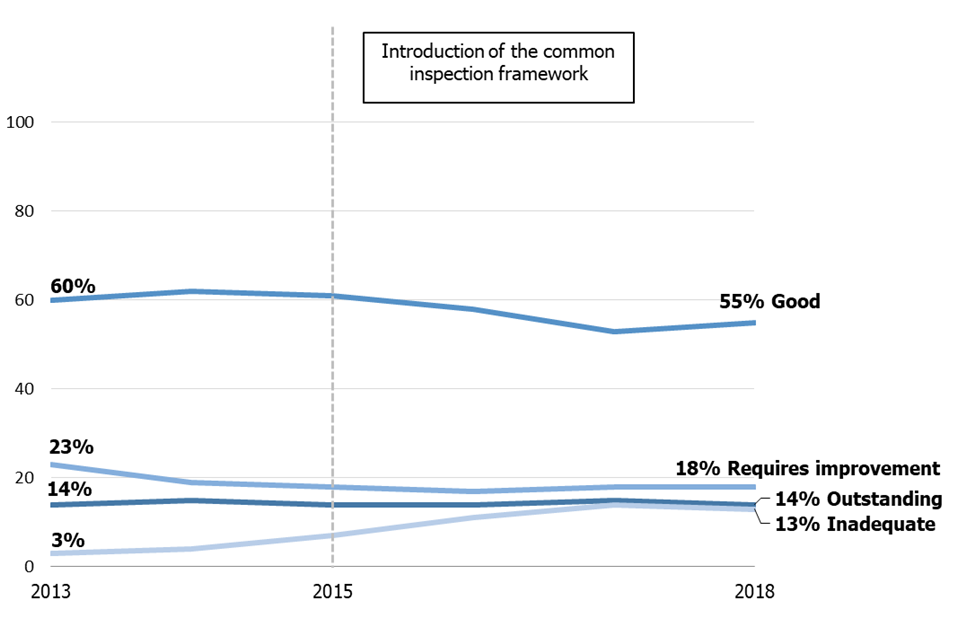
A figure showing the proportion of schools judged good or outstanding has been declining since 31 August 2013.
2.1 Independent special schools
Infographic stating 'More independent special schools were judged outstanding, compared with other independent schools'.
The proportion of independent special schools judged good or outstanding has remained stable, at 78%, since 31 August 2017. A higher proportion of independent special schools were judged outstanding when compared with other independent schools: 18% and 11%, respectively (Figure 2).
Figure 2: Most recent overall effectiveness of non-association independent schools as at 31 August 2018, by type
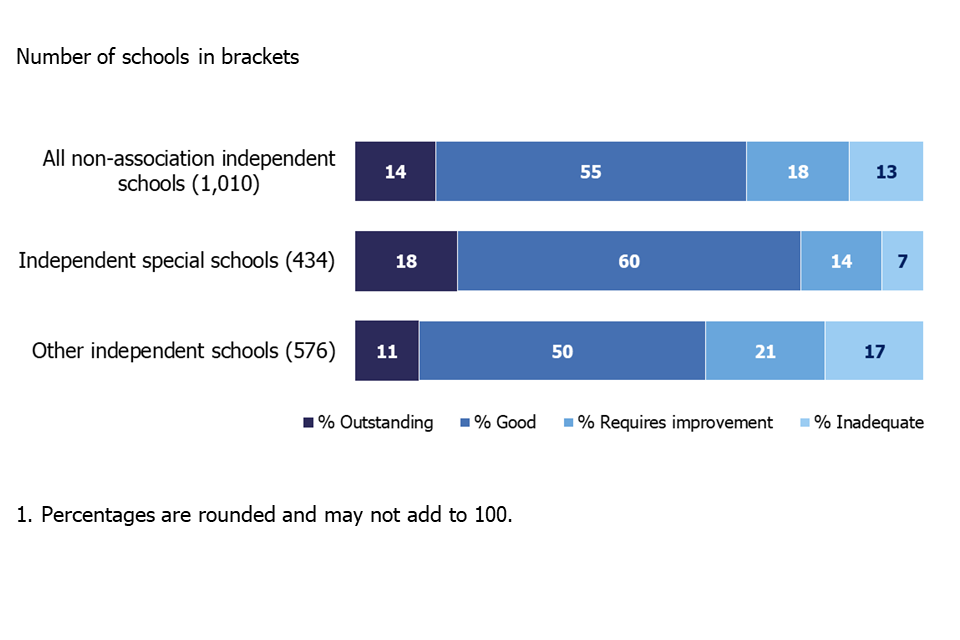
Figure showing inspection outcmes for independent special schools aree much better than those of other independent schools.
2.2 Ofsted regions
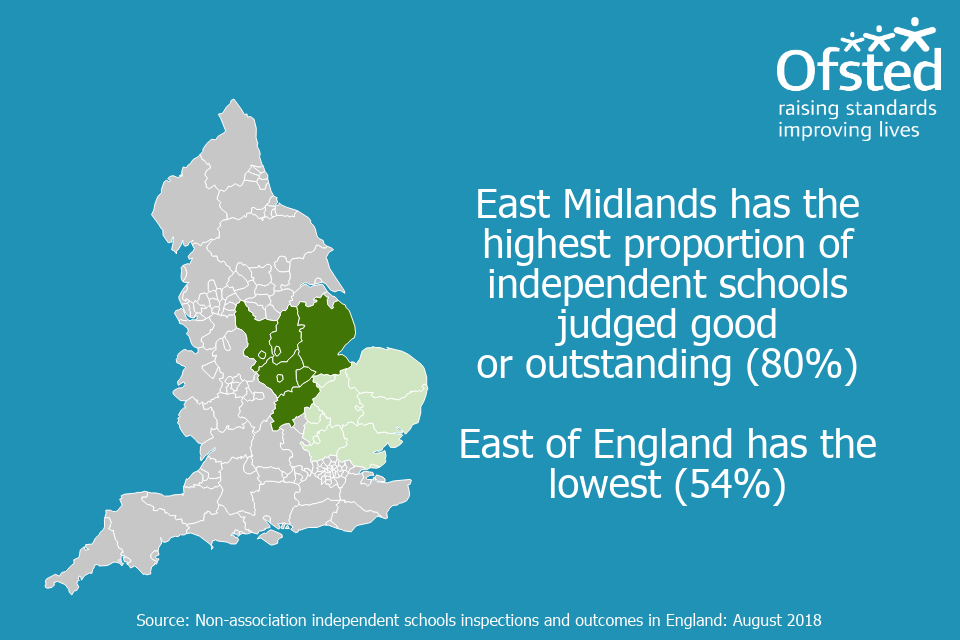
Infographic stating, 'East Mindlands has the highest proportion of independent schools judged good or outstanding (80%). East of England has the lowest (54%)'.
The number of non-association independent schools varies considerably between the Ofsted regions. London has the highest number of schools (272), and the South West has the lowest (70 schools).
Of those inspected, the East Midlands continues to have the highest proportion of schools judged good or outstanding (80%). The East of England has the lowest proportion of schools judged good or outstanding (54%). London and the South West have the highest proportions of inadequate schools (19% and 20% respectively). It is important to note that whilst there is some regional variation, the percentage judged good or outstanding can be influenced by a range of factors.
Table 1: Proportion of non-association independent schools judged good or outstanding as at 31 August 2018, by Ofsted region
| Ofsted region | % judged good or outstanding |
|---|---|
| England | 69 |
| East Midlands | 80 |
| South East | 77 |
| North West | 73 |
| North East, Yorkshire and the Humber | 70 |
| West Midlands | 67 |
| London | 65 |
| South West | 65 |
| East of England | 54 |
2.3 Independent faith schools
Inspection outcomes for faith schools[footnote 3] remain substantially weaker than non-faith schools. Three-quarters of non-faith schools were judged good or outstanding compared with just over half of faith schools. Nearly a quarter of all faith schools were judged inadequate at their most recent standard inspection (Figure 4).
Figure 4: Most recent overall effectiveness of non-association independent schools as at 31 August 2018, by faith
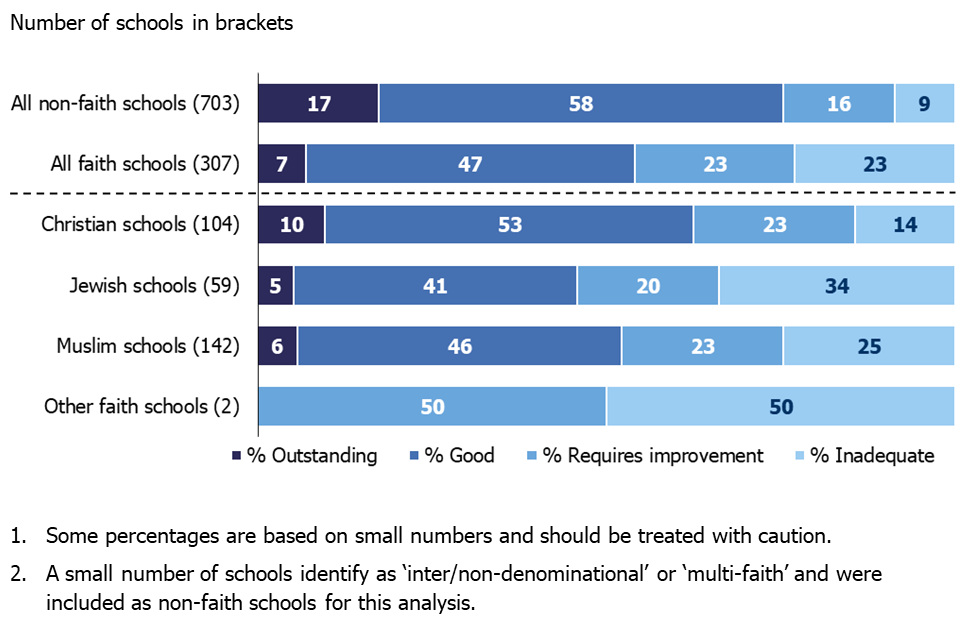
Figure showing the proportion of non-association independent schools judged good or outstanding varies widely by faith.
There is variation across the different faith groups. Less than 50% of Jewish schools were judged good or outstanding at their most recent inspection compared with 63% of Christian schools and 52% of Muslim schools. Jewish and Muslim schools were more likely than Christian schools to be inadequate, with 34% of Jewish and 25% of Muslim schools judged inadequate at their most recent inspection compared with 14% of Christian schools (Figure 4).
3. Inspections between 1 September 2017 and 31 August 2018
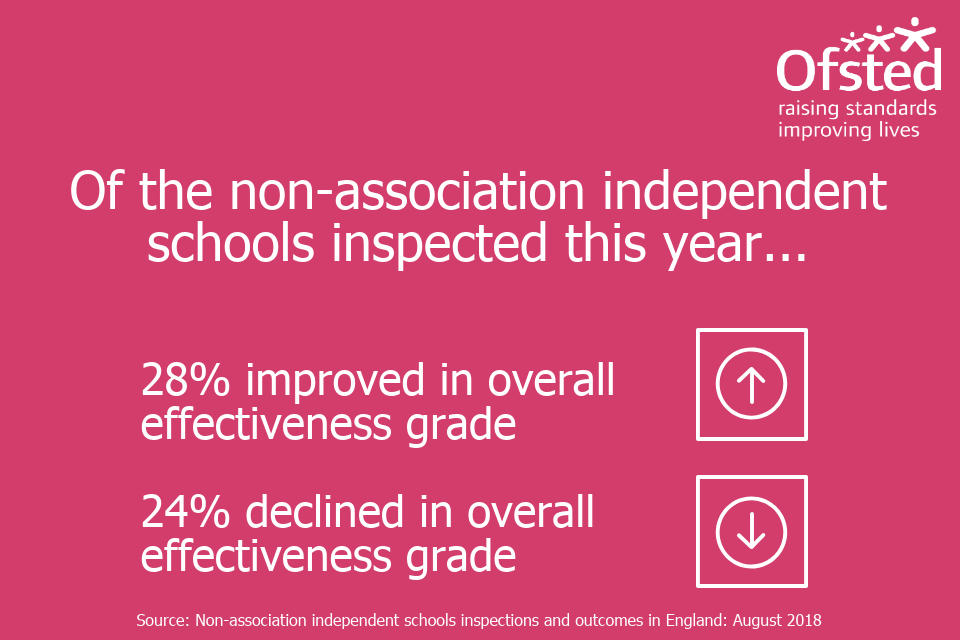
Infographic stating 'Of the non-association independent schools inspected this year, 28% improved in overall effectiveness grade and 24% declined'.
Between 1 September 2017 and 31 August 2018, Ofsted carried out 553 standard inspections of non-association independent schools [footnote 4]. Twelve per cent of these (65 schools) were judged to be inadequate (Figure 5), with 44 schools being found ineffective for safeguarding.
Figure 5: Overall effectiveness of non-association independent schools inspected in each academic year, since 1 September 2012
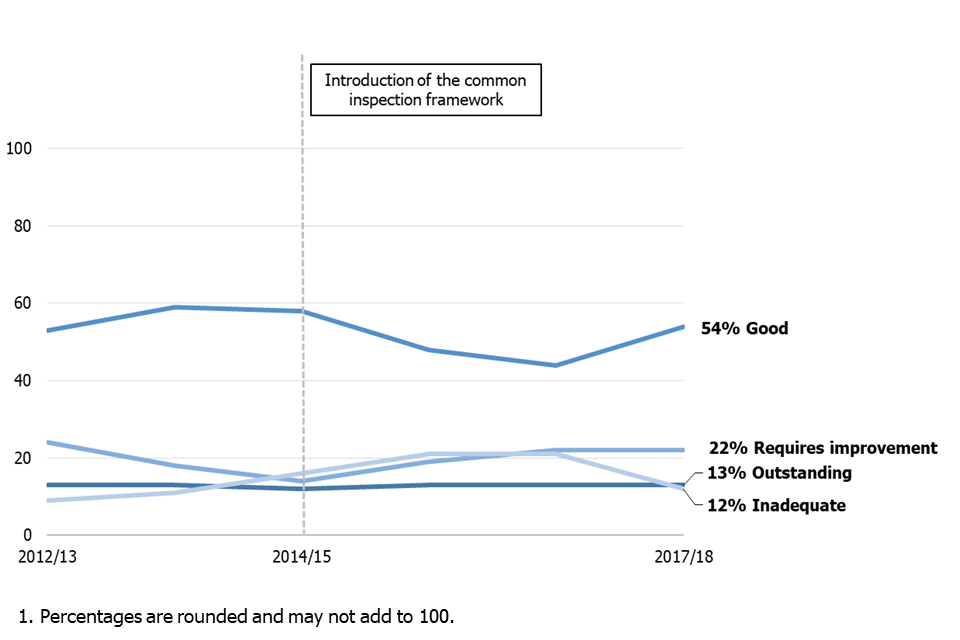
Figure showing inspection outcomes by academic year.
It is important to recognise that because of the way schools are selected for inspection, in any one year, the sample of schools inspected is not necessarily representative of all independent schools. This might partly explain the rise in the proportion of schools judged good this academic year, as well as the decline in schools judged inadequate.
Of the 553 schools inspected, 454 have had a previous inspection. Of these, 108 (24%) declined from their previous inspection, 216 (48%) remained at the same grade, and 128 (28%) improved on their judgement [footnote 5].
4. Safeguarding
Infographic stating 'By 31 August 2018, 10% of independent schools inspected failed the safeguarding judgement'.
A separate safeguarding judgement was introduced with the common inspection framework in September 2015. Since then, 982 independent schools have been assessed for safeguarding at their most recent standard inspection. Although the proportion of schools receiving ineffective safeguarding judgements fell by 5 percentage points since last year, it remains high. By 31 August 2018, 10% of schools failed in this judgement.
Independent special schools are more likely to be effective at safeguarding than other independent schools (94% compared with 87%). By 31 August 2018, all schools (97) that had ineffective safeguarding received an overall effectiveness grade of inadequate, as stipulated by the inspection handbook.
5. Compliance with independent school standards
Infographic stating 'Almost a quarter of schools failed to comply with the independent school standards at their most recent inspection'.
As well as being judged on their overall effectiveness at inspection, non-association independent schools are also judged on their compliance with the 8 parts of the independent school standards. Based on their most recent inspection, 77% of schools met all the standards. No inadequate schools met all the standards.
Schools are least likely to meet the standards in the quality of leadership and management. Just over a fifth of schools did not meet this standard when inspected this academic year (Table 2) [footnote 6]. All of the 65 schools judged inadequate this year failed to meet standards for leadership and management.
Table 2: Compliance with standards of non-association independent schools inspected in the current academic year (1 September 2017 – 31 August 2018)
| Met the standard (%) | Did not meet the standard (%) | |
|---|---|---|
| Part 1: Quality of education | 86 | 14 |
| Part 2: Spiritual, moral, social and cultural development of pupils | 95 | 5 |
| Part 3: Welfare, health and safety of pupils | 87 | 13 |
| Part 4: Suitability of staff, supply staff and proprietors | 95 | 5 |
| Part 5: Premises of and accommodation at schools | 90 | 10 |
| Part 6: Provision of information | 95 | 5 |
| Part 7: Manner in which complaints are to be handled | 98 | 2 |
| Part 8: Quality of leadership in and management of schools | 78 | 22 |
Ofsted also carry out progress monitoring inspections of schools judged not to have met all standards at their last inspection. The progress made towards meeting these standards was poor this academic year. Of the 118 progress monitoring inspections this year, only 52 schools have now improved to meet the standards checked on these inspections.
6. Revisions
Provisional data indicated that there were 338 standard inspections between 1 September 2016 and 31 August 2017 (published by 30 September 2017). Revised data shows that there were an additional 15 inspections, where the report was published by 30 September 2018. One of these schools was judged good, 2 schools were judged requires improvement and 12 schools were inadequate.
The addition of these inspections changed the profile of overall effectiveness for schools inspected in the last academic year. The proportion of schools judged outstanding fell by one percentage point from 13% to 12%. The proportion of schools judged good fell from 44% to 42% and those schools judged inadequate increased from 21% to 24%. Further details can be found in the revised tables in the charts and tables file accompanying this release.
Revisions to data in this publication are published in line with Ofsted’s revisions policy for official statistics.
7. Notes
Data in this release is from inspections undertaken between 1 September 2017 and 31 August 2018 and most recent inspections of open schools at 31 August 2018, where the inspection report was published by 30 September 2018. If an inspection report is not published by 30 September 2018 then the previous inspection, where available, will be reported as the school’s most recent inspection.
From September 2015, data in this official statistics release reflects judgements made on inspections conducted under sections 99, and 109(1) and (2) of the Education and Skills Act 2008. The regulations set out the standards on which inspectors report. This includes the extent to which the school meets the requirements of the Education (Independent School Standards) Regulations 2014 (referred to as the independent school standards).
The accompanying methodology and quality report for this release sets out the main uses of this data, further contextual information and arrangements for quality assurance. It also provides information about strengths and limitations of the statistics.
In 2016, the National Statistician published guidance covering management information and official statistics.
8. Further information
8.1 Contact for comments or feedback
If you have any comments or feedback on this publication, please contact Anita Patel on 03000 130 914 or Anita.Patel@ofsted.gov.uk.
8.2 Annual report
Findings from our forthcoming Annual Report will be published on 4 December 2018.
8.3 Acknowledgements
Thanks to the following for their contribution to this statistical release: Folasade Ariyibi, Austen Norris, Jade Price-Stephens and John Willman.
-
The remaining schools that have not been inspected are new or those that moved inspectorate and have yet to receive their first inspection. ↩
-
One school that had a standard inspection did not receive an outcome for overall effectiveness and is excluded. ↩
-
A school is defined as a faith school based on whether they have declared either a religious character, a religious ethos, or both. This information is updated by the school on get information about schools (GIAS). ↩
-
Two schools that had a standard inspection did not receive an outcome for overall effectiveness and are excluded. ↩
-
The data excludes two schools that did not receive an outcome for overall effectiveness at either their current or previous standard inspection. ↩
-
Two inspections did not receive an outcome for the parts of the independent school standards. ↩