
Appendix 1: Nature-based solutions for water resources case studies
Published 17 August 2026
Applies to England

© Crown copyright 2026
This publication is licensed under the terms of the Open Government Licence v3.0 except where otherwise stated. To view this licence, visit nationalarchives.gov.uk/doc/open-government-licence/version/3 or write to the Information Policy Team, The National Archives, Kew, London TW9 4DU, or email: psi@nationalarchives.gov.uk.
Where we have identified any third party copyright information you will need to obtain permission from the copyright holders concerned.
This publication is available at https://www.gov.uk/government/publications/nature-based-solutions-for-water-resources-handbook/appendix-1-nature-based-solutions-for-water-resources-case-studies
These case studies show how NbS can be used to support water resources in different hydrological and geological catchment settings across England.
They explore practical examples where working with natural processes has helped to:
- improve groundwater recharge
- support river flows during dry periods
- increase resilience to drought
Together, they provide evidence to support the design and delivery of NbS for water resources.
1. Conceptual modelling case studies
Chalk conceptualisations
This section presents the findings from case studies in the Cam, Test and Wensum catchments.
Figure 1 illustrates the locations of the 3 case study catchments within a hydrogeological map of the UK. These are named the Cam, Test and Wensum catchments.
Figure 1: Locations of chalk catchment case studies
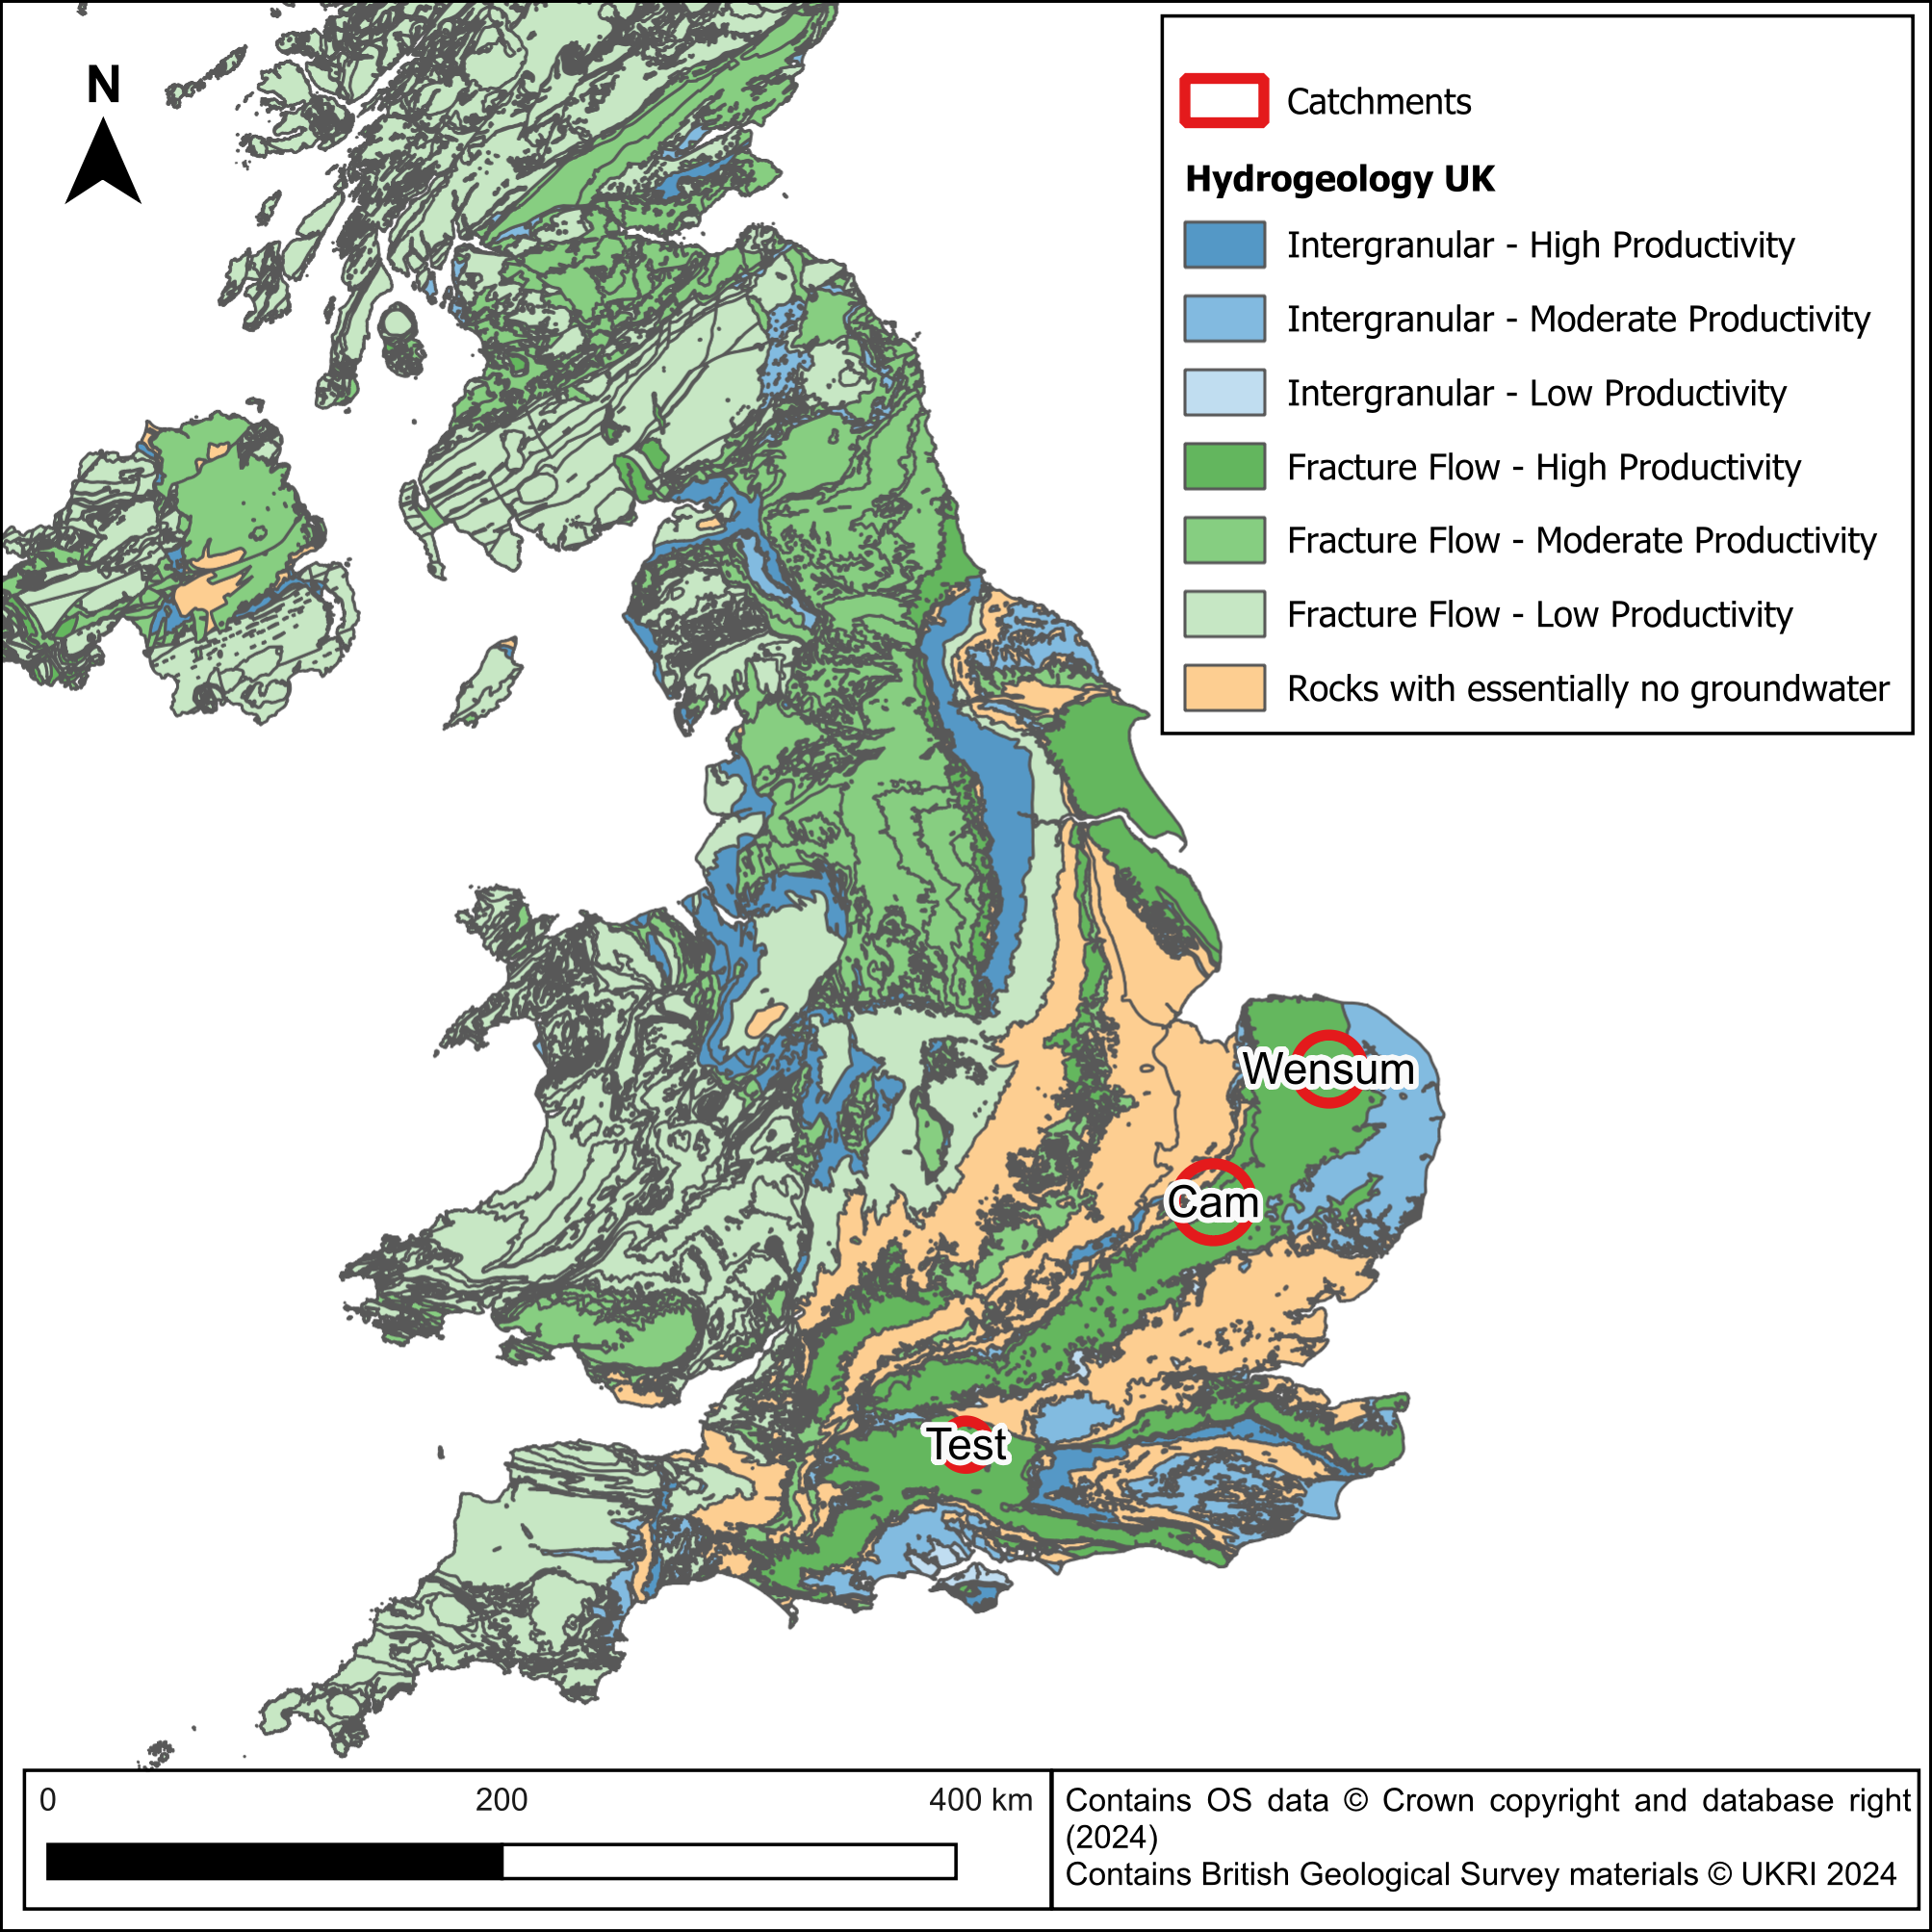
Table 1 shows the proportion of rainfall, evapotranspiration, runoff, infiltration, and baseflow (groundwater input to river flows) in these 3 chalk case study catchments. This table shows that even within chalk catchments the water cycle can be very different and the approach to NbS for water resources should reflect this.
Table 1: Water balance (mm per year) across catchments
| Cam | Test | Wensum | |
|---|---|---|---|
| Rainfall | 419 | 915 | 624 |
| Actual evapotranspiration | 314 | 496 | 420 |
| Runoff | 18 | 113 | 32 |
| Interflow | 17 | 7 | 45 |
| Recharge | 76 | 386 | 136 |
| Baseflow | 47 | 45 | 114 |
| Baseflow Index (BFI) range (%) | 42 to 94 | 92 to 94 | 51 to 75 |
Upper Cam
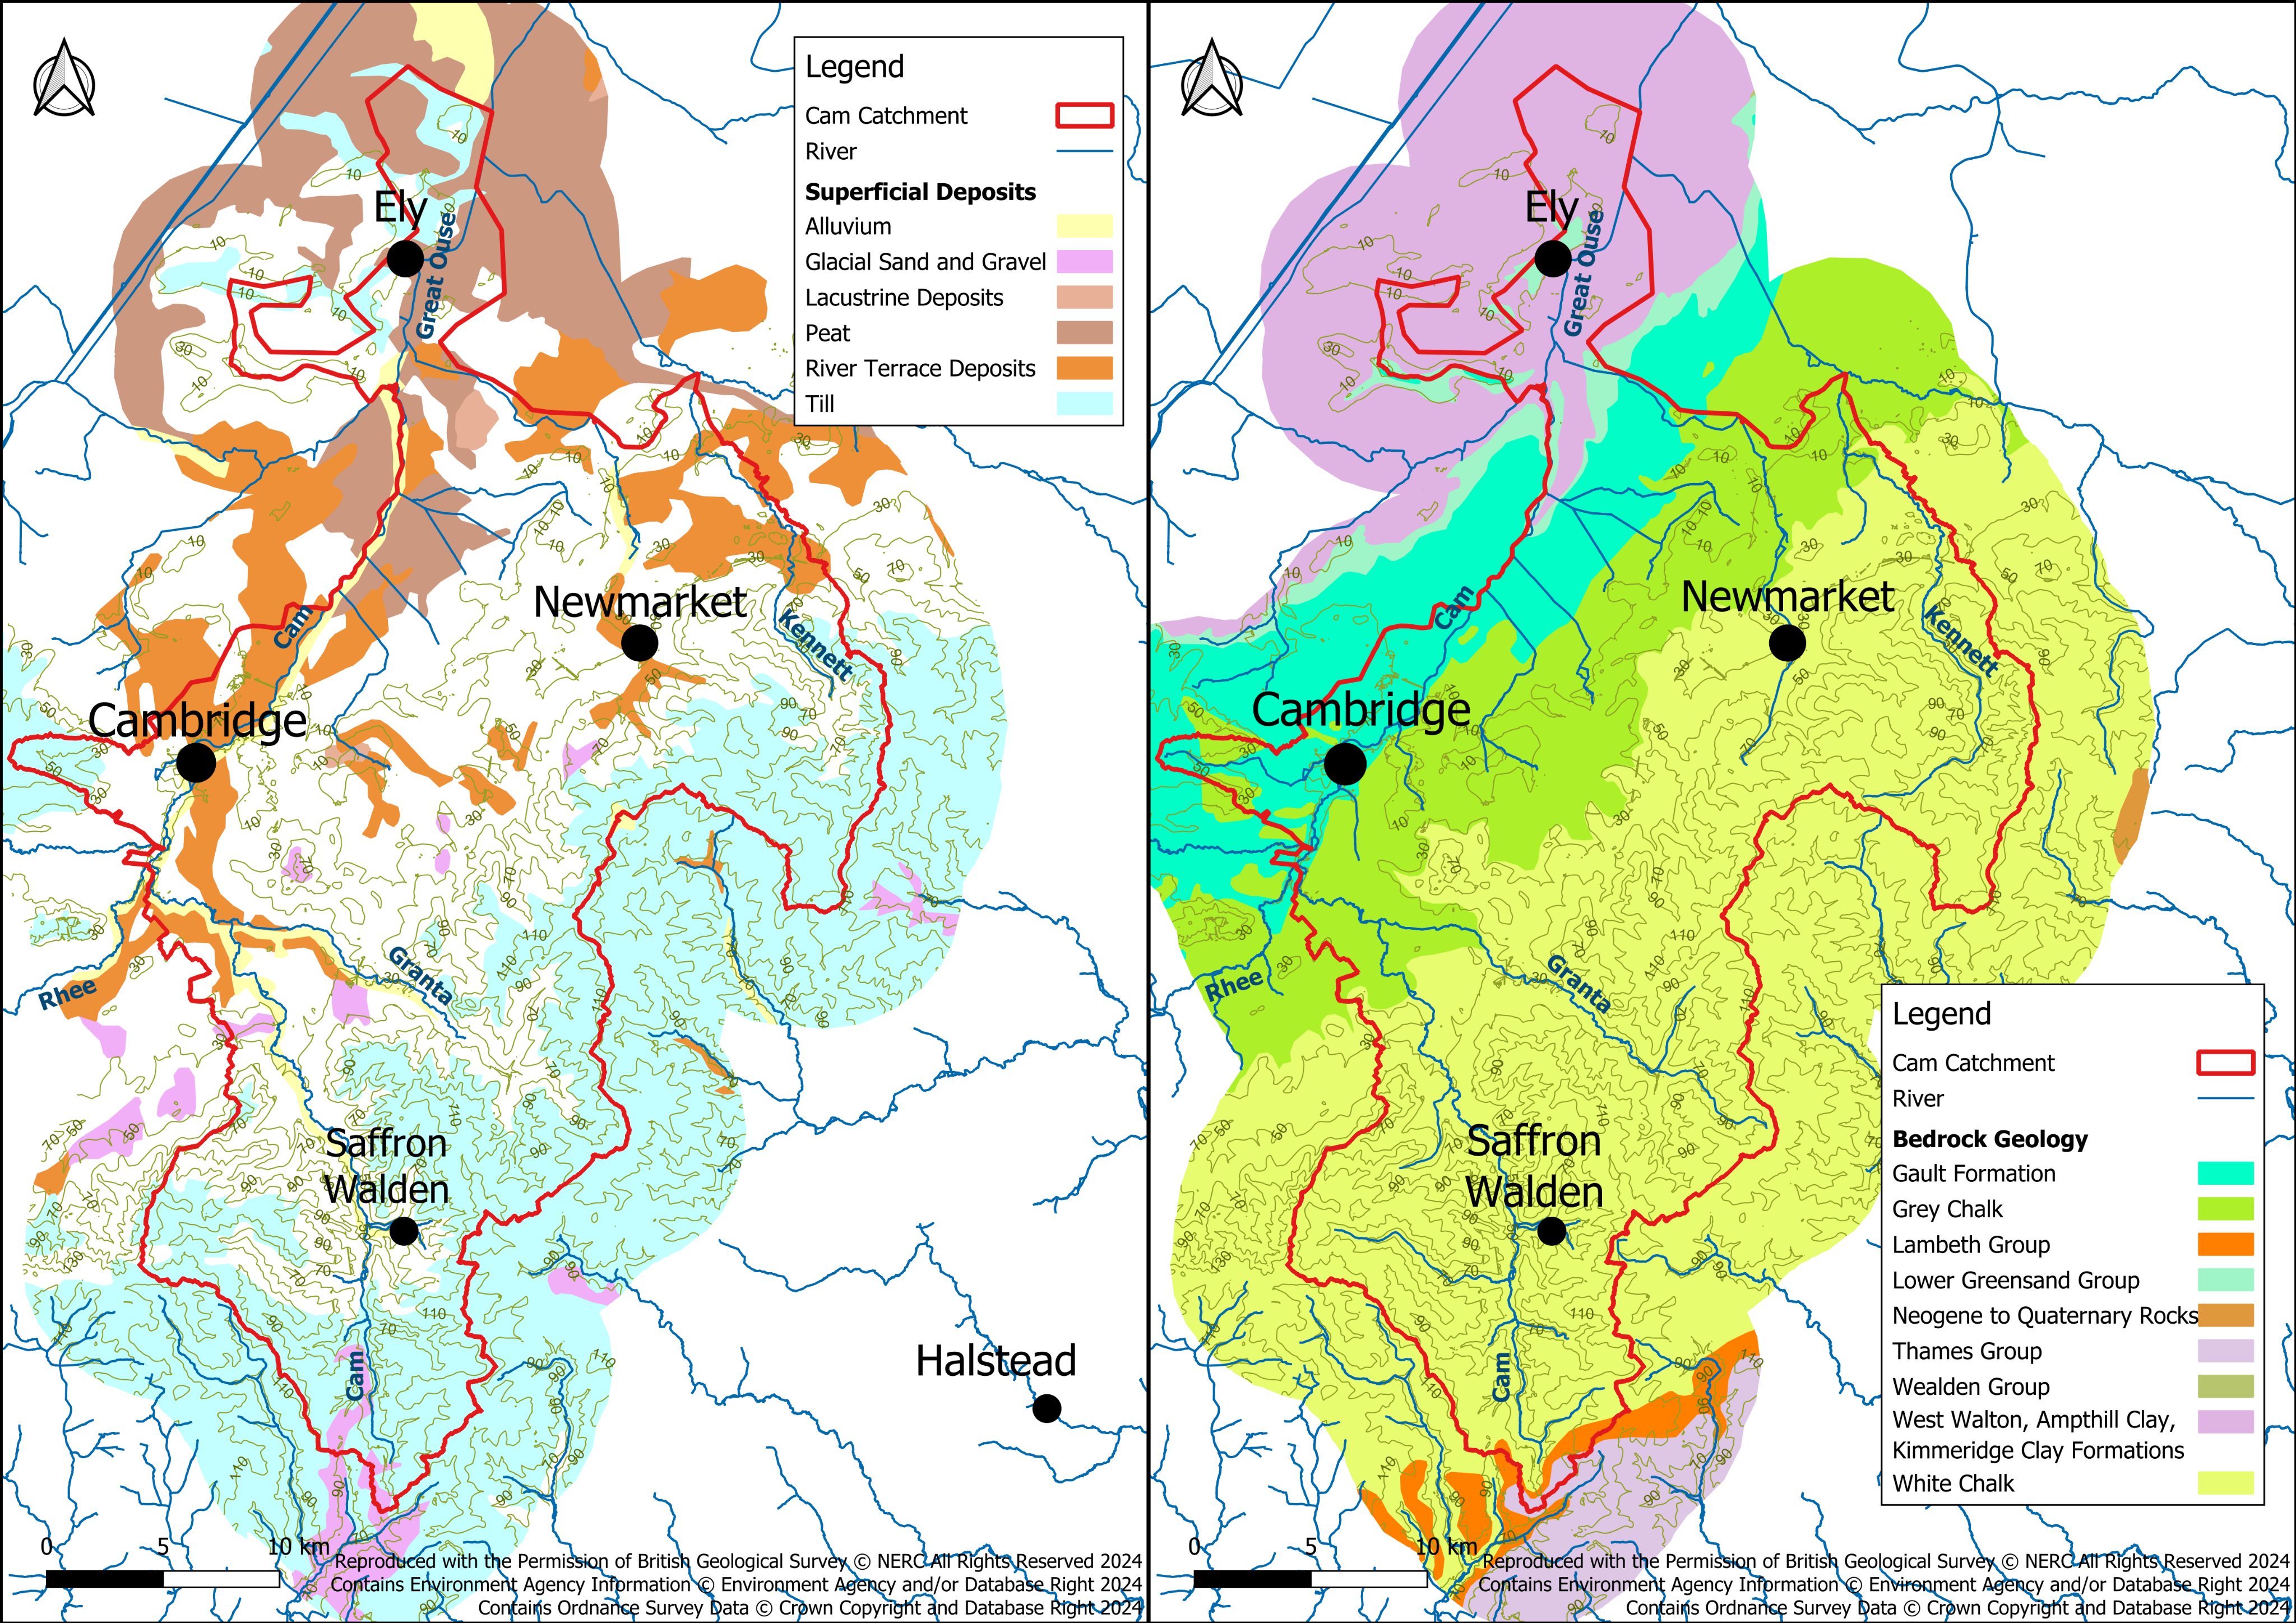
The topography and geology underlying the Upper Cam’s catchment, including superficial and bedrock units, are shown in Figure 2.
The Cam catchment is dominated by higher ground in the south and slopes north and north-westwards towards Cambridge and the River Ouse. The terrain falls from approximately 100 metres Above Ordnance Datum (mAOD) in the south to -1.5mAOD in the north. In the east of the catchment, around the source of the Granta and River Kennett, elevations remain high at approximately 100mAOD.
Upland areas are dominated by low-permeability glacial till, covering most of the south and east of the catchment, the rises west of Cambridge and around Ely towards the downstream extent of the catchment.
Glaciofluvial sediments can be found in a pocket in the upper area of the catchment, and along some of the valley floors south of Cambridge. The valley edges throughout the catchment consist of glaciofluvial sand and gravel deposits as well as river terrace deposits. These also occur as outcrops in the valleys and along tributaries of the Cam, Granta and Kennett rivers. The north of the catchment has limited superficial deposits with mostly peat present and outcropping clay bedrock.
The bedrock across the catchment is oldest in the north and becomes younger towards the southern boundary. The sequence dips slightly south-east.
Chalk bedrock underlies most of the area and outcrops across the eastern and central parts of the catchment, south of Cambridge.
Cambridge sits on the mudstone and marl of the Gault Formation, which extends northeast along the Cam to its confluence with the Great Ouse.
The north of the catchment, above the Cam’s confluence with the Ouse, is underlain by an area of the undifferentiated clay units: the West Walton, Ampthill Clay and Kimmeridge Clay Formations, with pockets of Lower Greensand Group.
Figure 2: Topography, superficial deposits and bedrock units within the Cam catchment
Upper Cam conceptual model
A hydrogeological conceptual model is a description of how a hydrogeological system is believed to behave. It describes how water enters an aquifer system, flows through the system and leaves the aquifer system.
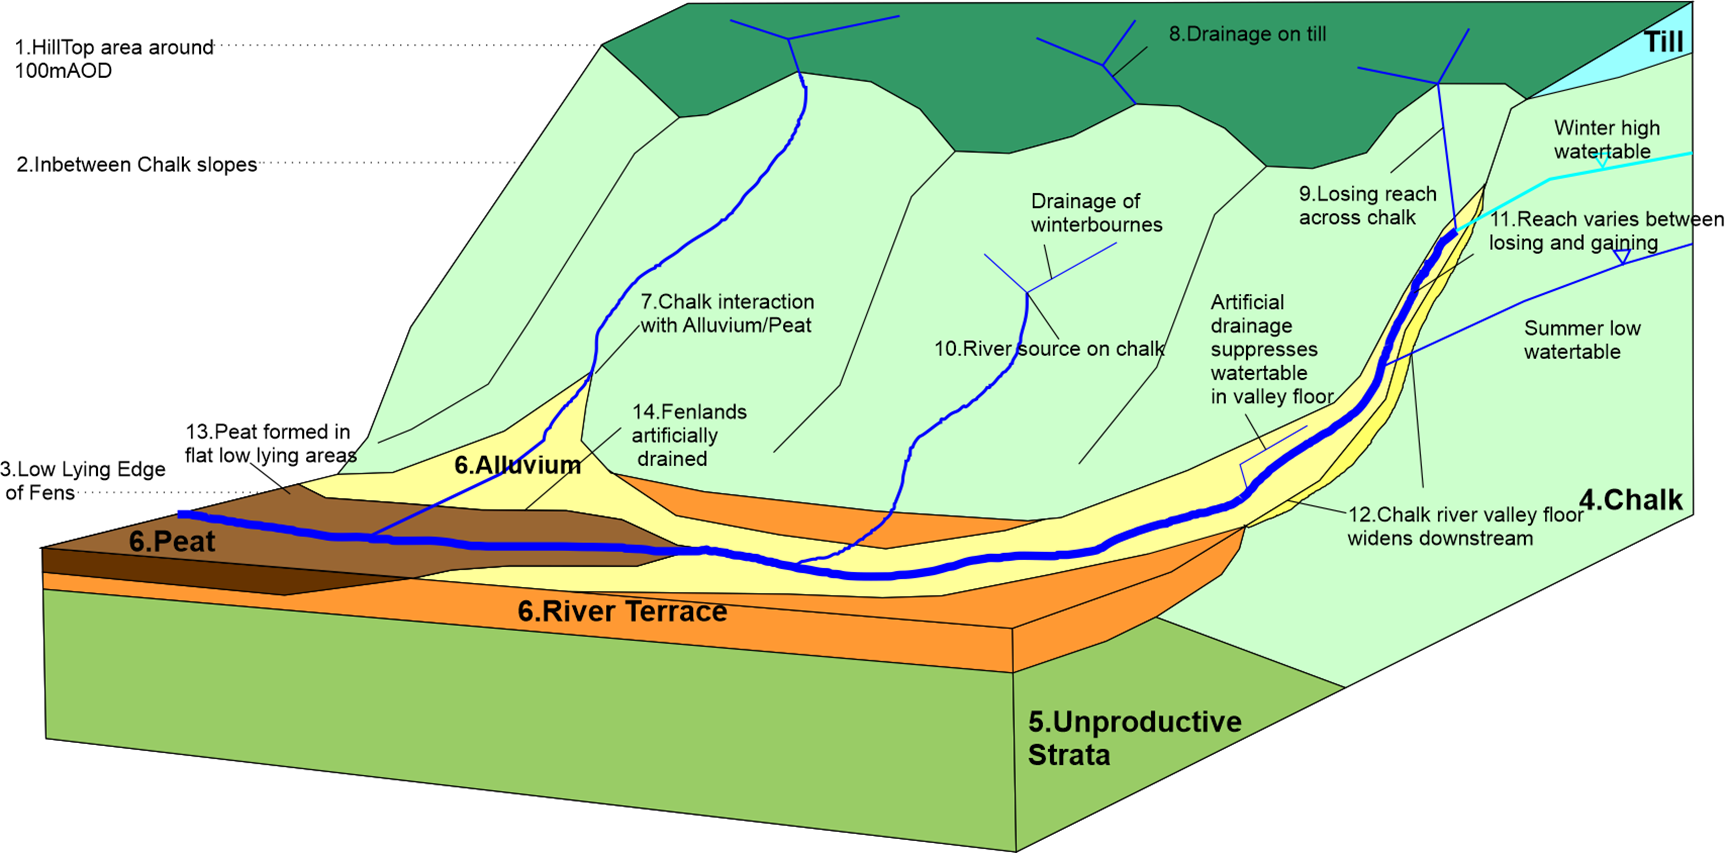
The conceptual model for the Cam catchment is shown in Figure 3. It focuses on the elements that could be affected by NbS and therefore has a focus on the shallow system. It has the following features.
The catchment is covered by 3 distinct topographical zones:
- the hilltop area in the east of the catchment at around 100mAOD (1)
- the intermediate chalk slopes (2)
- the low-lying edge of the fens (3)
Geology and hydrogeology:
- most of the area is underlain by chalk which forms a principal aquifer (4)
- across the lowland areas, the area is underlain mainly by unproductive clay strata (5)
- along the valley floors, the superficial deposits transition downstream, from a narrow band of alluvium to a wider valley filled with high-permeability river terrace deposits, progressing to peat as the valleys widen and flatten into the fens (6)
- the superficial deposits of the fens are generally underlain by low-permeability bedrock – on the eastern edge, there is some interaction with the chalk, with seepage faces on the edge of the peat or alluvium (7)
There are 7 main hydrogeological or hydrological settings for streams and rivers in the area:
- drainage network on the low-permeability till that removes runoff from the area (8)
- streams or drains that run from the edge of the till across the higher ground of chalk, and lose water to the ground, even in high water table conditions (9)
- baseflow-fed streams that rise on the chalk (10)
- reaches of streams or rivers on chalk in the valley floor that are usually gaining but lose water to ground in dry conditions (11)
- permanently gaining chalk river reaches, sufficiently low down the system that they always receive water from the water table (12)
- lowland rivers passing through peat and clay (13)
- lowland drainage systems (14)
Figure 3: Schematic conceptual model of the Cam catchment, JBA Cam report
Catchment specific interventions
A wide suite of NbS interventions can be implemented across the Cam catchment which promote infiltration and limit runoff generation. This is due to the varying nature of the geology within the Cam catchment, including high-permeability bedrock catchments covered by patchy low-permeability drift (high runoff next to a high-recharge area). The presence of putty chalk at the top of the chalk may limit infiltration potential in places.
The long list of NbS options can be simplified into the following categories:
- soil improvement
- land use change
- runoff attenuation features (RAFs)
- floodplain and river restoration
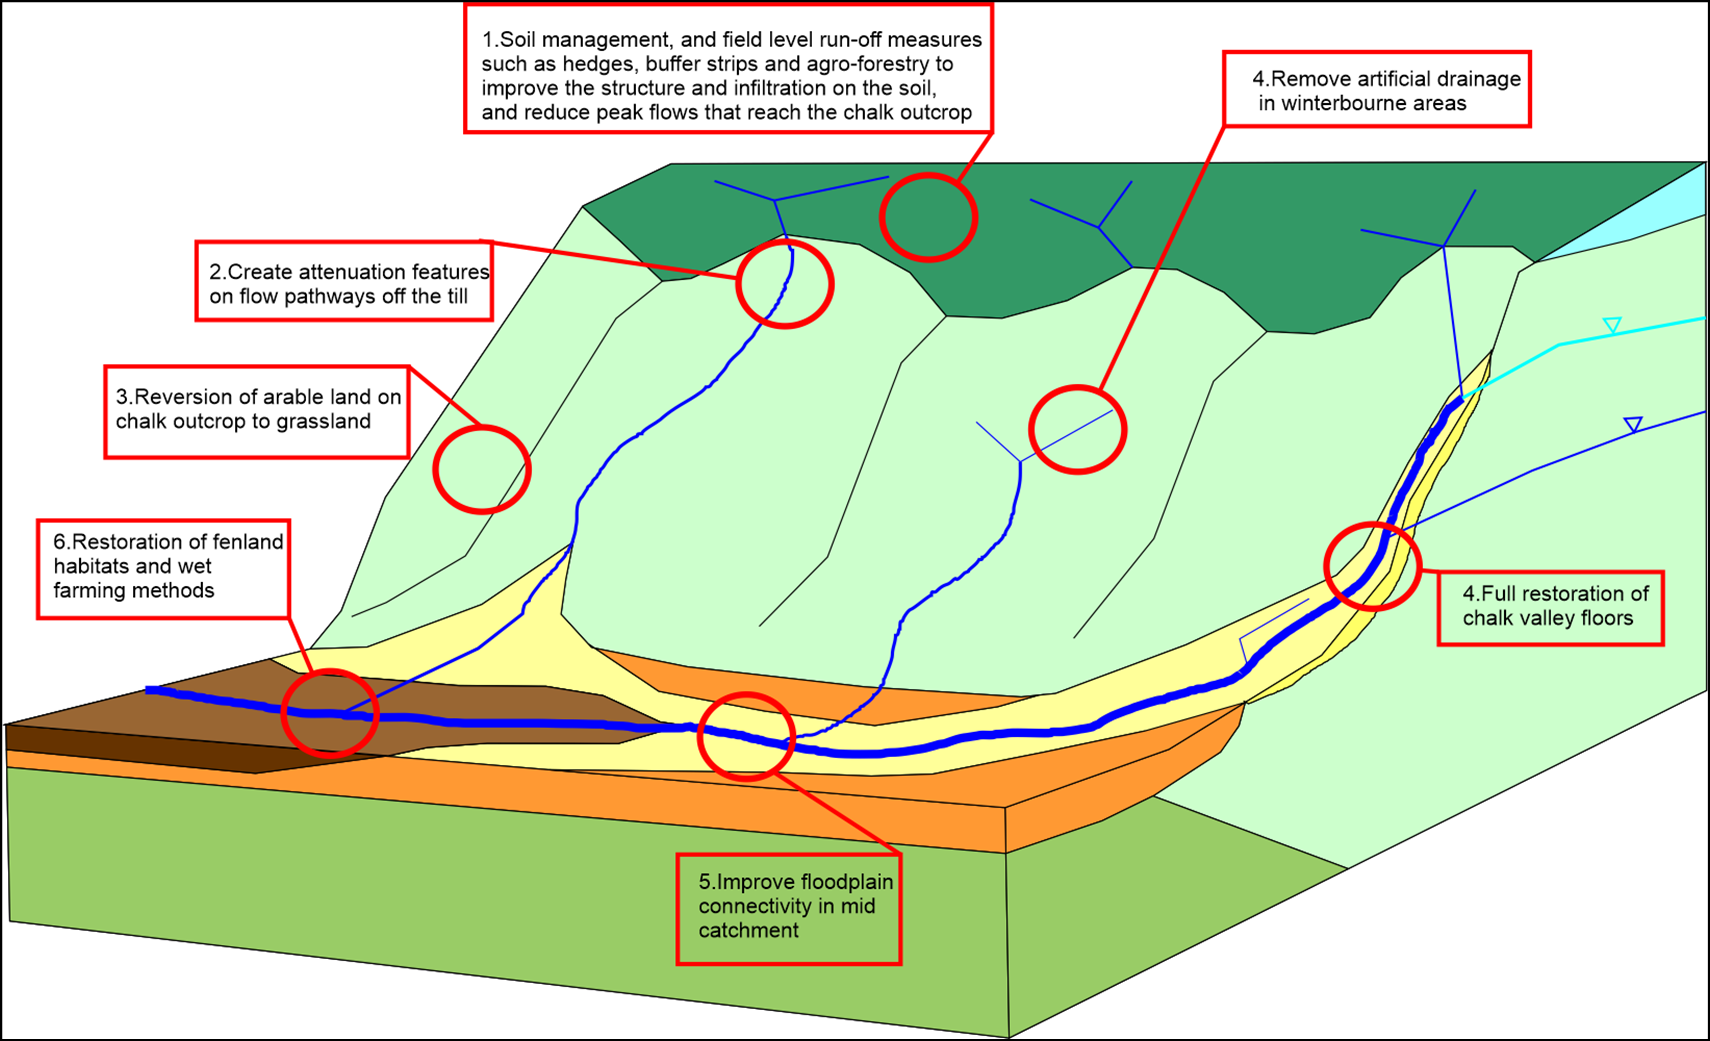
Figure 4 summarises the intervention types that are specific to the hydrogeological controls of the Cam catchment. This identifies several distinct settings:
- Improving infiltration on the till soils that dominate the plateau, by adding slowly draining surface water RAFs. This includes soil management techniques and roughness strips within fields. Surface water storage features for farm use could also be located in this area. If the runoff from here is slowed down, then there will be more scope for infiltration of peak flows once they arrive at the chalk outcrop.
- Create RAFs on chalk deposits on the edge of the till. These will enable enhanced runoff recharge of chalk downstream of the outcrop edge. The higher in the catchment that recharge occurs, the longer the pathway through the subsurface and the greater the baseflow benefit for low flows.
- On the chalk outcrop, taking land out of arable production that needs spray irrigation and reversion to chalk grassland could reduce the overall losses or water uses from the catchment.
- Improving resilience of streams to low groundwater levels in the chalk by re-naturalising the channel and storing more water within the valley floors through riparian restoration. Remove artificial drainage in winterbourne areas.
- Improving floodplain connectivity through the mid-catchment. Mapping identifies lots of reaches where connectivity could be improved, with increased storage of water in these areas.
- Changing management practices in the fenland areas to allow water levels to be maintained at a higher level, increasing the storage in the system. Restoration of fenland habitats and wet farming methods would have the potential to further support baseflows in drought conditions.
Figure 4: Cam catchment interventions, JBA Cam report
For more detail of the NbS elements that are specific to the upper chalk catchments, see the NbS for water resources technical handbook.
Upper Test
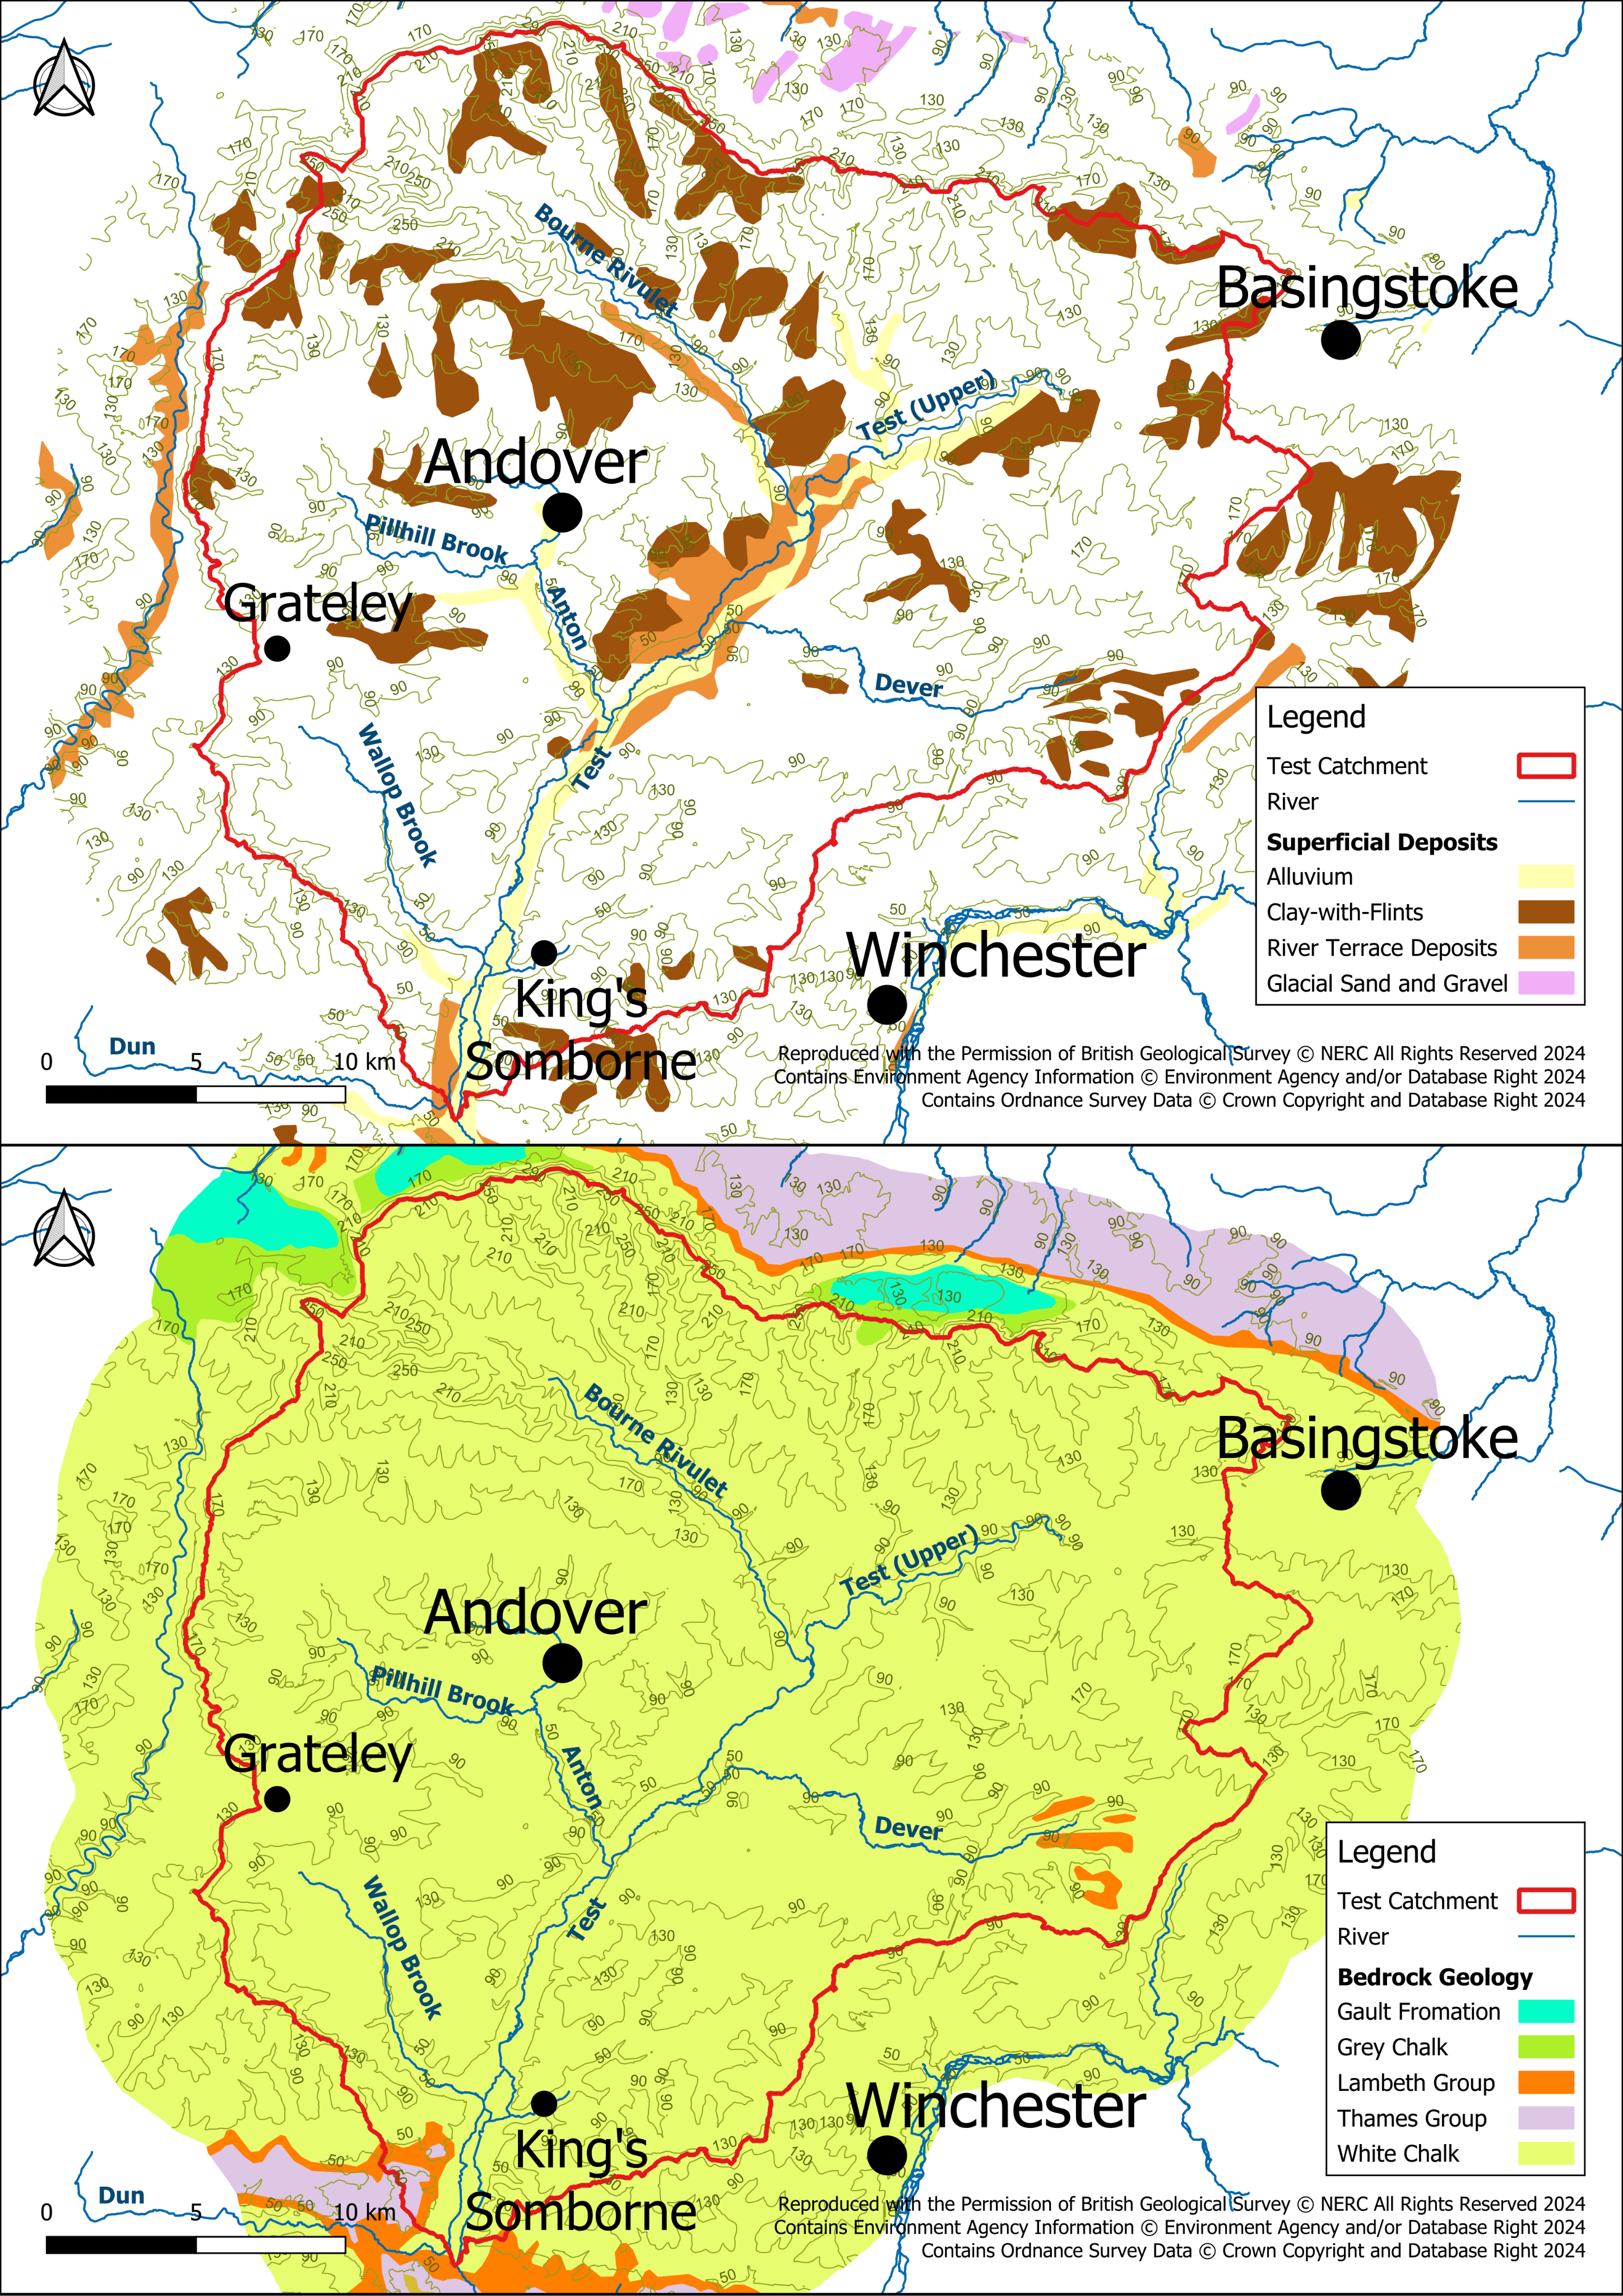
The topography and geology underlying the Upper Test catchment, including superficial and bedrock units of the area, are shown in Figure 5.
The Bourne Rivulet forms the western part of the catchment and flows towards the south-east. It is surrounded by a horseshoe of relatively steep-sloping hills with elevations of up to 300mAOD. The Bourne Rivulet emerges into the lower part of the catchment at an elevation of 90mAOD and flows to its confluence with the River Test.
The north-eastern part of the catchment comprises the Upper River Test catchment, where elevations are lower (maximum of 220mAOD), and the hills slope gently towards the south-west. Similarly, the River Test emerges in the centre of the catchment and drains towards its outlet, just upstream of the Bourne Rivulet confluence.
The Middle Test catchment comprises the relatively small area draining into the Test as the river flows towards the south-west with only a 10m drop in elevation.
The catchment continues south and has a similar topography, covering the Dever, Anton and Wallop Brook around Andover.
The superficial geology varies across the area but is limited in extent. Clay-with-flints mostly occurs on areas of high elevation, with additional patchy exposure throughout the catchment. Alluvial bands occur along the stream valley floors. A broader band of alluvium is seen in the wider Test valley. River terrace deposits outcrop at the edge of the valley floor in the upper and middle Test catchment.
The valley floor of the Test can be split into 2 areas: upstream and downstream of the confluence with the Bourne Rivulet. The lower reach is mapped as fen peat in the published soil mapping.
Above the Bourne Rivulet confluence, the valley floor is narrower and dominated by sand, gravel and alluvium deposits, with less peat.
Much of the wider area is free of drift, but there are some areas of clay-with-flints around the north, south and east, river terrace deposits around the main River Test, and alluvium deposits within the main Test valley.
The youngest outcropping bedrock unit in the catchment is the Lambeth Group which has a limited exposure, with an unconformity at its base. The majority of the catchment is covered by the White Chalk Subgroup which frequently outcrops.
Figure 5: Topography, superficial deposits and bedrock units within the Test catchment
Conceptual model
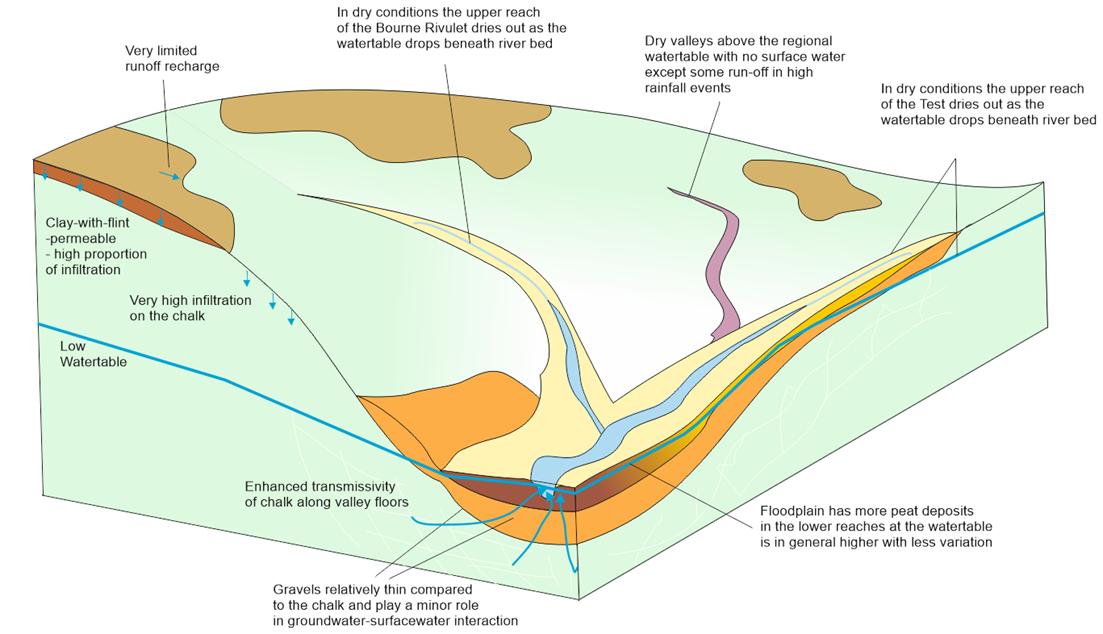
The conceptual model for the Test catchment is shown in Figure 6. It has the following features:
Topography:
- the Upper Test and Bourne Rivulet both have relatively narrow valley floors which widen beneath their confluence
- the highest ground is in the north-west and is split by a series of narrow dry valleys
Chalk:
- the whole area is underlain by chalk which acts as a principal aquifer
- the transmissivity of the chalk is highly variable, with the highest transmissivity underlying the valley floors and some dry valleys
Clay-with-flints:
- clay-with-flints lies on top of the hills
- it is moderately permeable and little to no runoff from it is observed
- some interflow is observed to discharge at the edge of the deposits
- dolines (sinkholes) within clay-with-flints areas form localised zones of rapid infiltration
Valley floor:
- the deposits of the valley floors differ upstream and downstream of the main confluence
- upstream of the confluence the Test and Bourne Rivulet, the valleys are narrow with 0.5 to 2m of silty alluvium underlain by 1.5 to 5m of gravel
- downstream of the confluence, the valley is wider. It is underlain by about 5m of gravel overlain by 0.5 to 4m of alluvium and peats
Surface water-groundwater interactions:
- the pattern of surface-groundwater interaction reflects and is controlled by the distribution of sediment within the valleys
- where peat deposits are found, downstream of the main confluence, the river is in an area of gaining baseflow even in dry conditions
- the superficial deposits are relatively thin compared to the chalk and so have a limited role at the groundwater-surface water interface
- the Bourne Rivulet and Upper Test suffer more from low flows, as in dry periods these can be losing reaches or partly dry, or groundwater flow bypasses them to discharge directly to the lower part of the Test
Infiltration patterns:
- infiltration on the chalk is rapid and there is very limited runoff from it
- the clay-with-flints has limited impact on slowing infiltration – runoff infiltration from the clay-with-flints onto the chalk is very limited
- runoff and surface water flooding of dry valleys may occur in extreme events
Figure 6: Schematic conceptual model of the Test catchment
Catchment-specific interventions
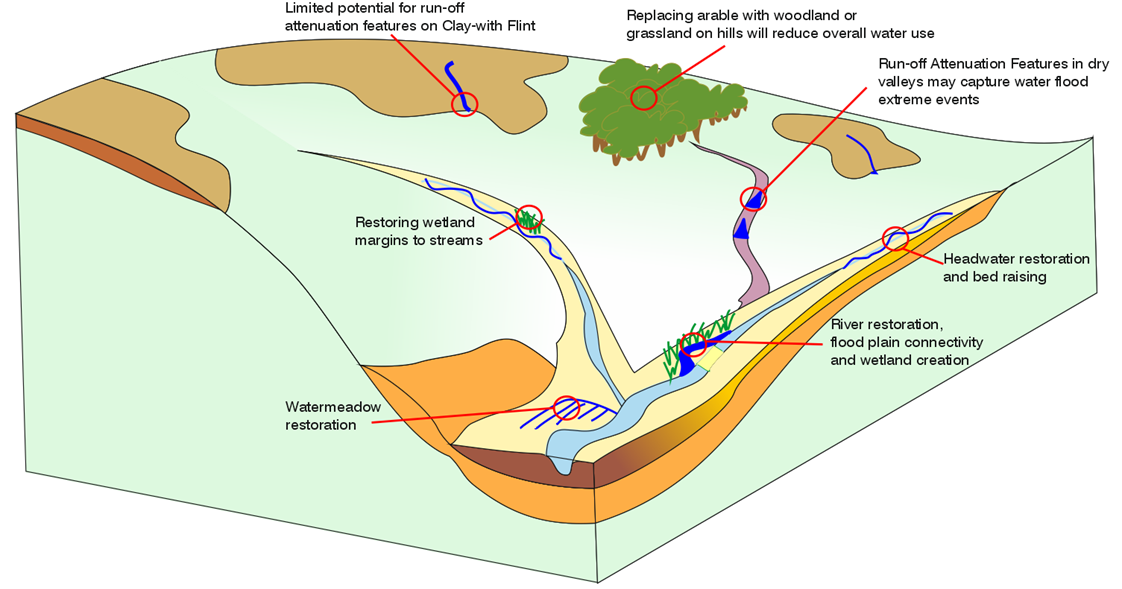
There is already a very high rate of infiltration and limited runoff on the chalk and the clay-with-flints deposits. Surface water flood mapping suggests that in extreme events, dry valleys above the regional chalk water table can form flow paths, which rapidly transport runoff to the main valley floors. Runoff is not seen in a typical year but is seen in extreme events. This means that there is little scope for reducing runoff generation or capturing runoff as there is so little to begin with.
Outside of modifying runoff, there are 2 main ways the landscape could be modified to improve water resources:
- changing land cover to reduce evapotranspiration and the need for consumptive abstractions
- floodplain restoration to increase the amount of groundwater stored within the superficial deposits of the floodplain
If land is converted from arable farming for biodiversity gain, grassland and beech woodland are 2 likely options. Calder (2002) summarises the finding of a study at Blackwood, near Micheldever Station, immediately bordering the south-east corner of the area of interest:
A new study was commissioned, this time involving full instrumentation of both the beech woodland and grass at the 2 original field sites in Hampshire – Black Wood and Bridgets Farm (Roberts and others 2001). The principal conclusions of this second investigation are: that there is no significant difference in the seasonal reduction in water content of the soil under beech woodland and grass; that evaporation from grass over a 12-month period from March 1999 was 106% that from the beech woodland, that is, 36 mm higher; and that drainage under beech was greater than that under grass by 34 mm over a 12 month period and by 90 mm over an 18 month period, that is, a flux 111 to 114% of that under grass. The results of this new study “give very strong support to the previous work… which concluded that, compared to grassland, afforestation with beech woodland has little impact on recharge to chalk groundwater” (Roberts and others 2001).
Roberts and others (2001) draw attention to the likely impact of soil type, suggesting that in shallow soils over chalk (as at Black Wood and Bridgets Farm) there is a significant upward flux from the micro-porous bedrock into the soil (where the roots are confined) that helps satisfy evaporative demand throughout summer in most years, even under grass.
Based on this study, in most years there may be little difference between the water demands of grassland and beech woodland, due to the thick capillary fringe of the chalk which readily allows water to be accessed. Only in very dry years do the shallow root systems of grassland lead to lower evapotranspirative losses compared to beech woodland. This observation is specific to large beech woodlands on chalk. In most other situations, woodlands have greater losses, including wet woodland on floodplains where trees like willow and poplar have high water demands (Creating and managing riparian woodland, UK Forestry Standard Practice Guide).
Overall, this very high-permeability catchment has little opportunity to change the functioning of the water cycle. There is little runoff to capture, and the differences between the water budgets of many of the land use types are limited.
The identified options are summarised in the conceptual model showing the locations of potential interventions in Figure 7. Some of these interventions, such as woodland planting, although marginal in terms of water resources benefits, may contribute a range of other benefits such as to water quality (through reducing diffuse pollutant loads).
Figure 7: Test catchment interventions
Wensum
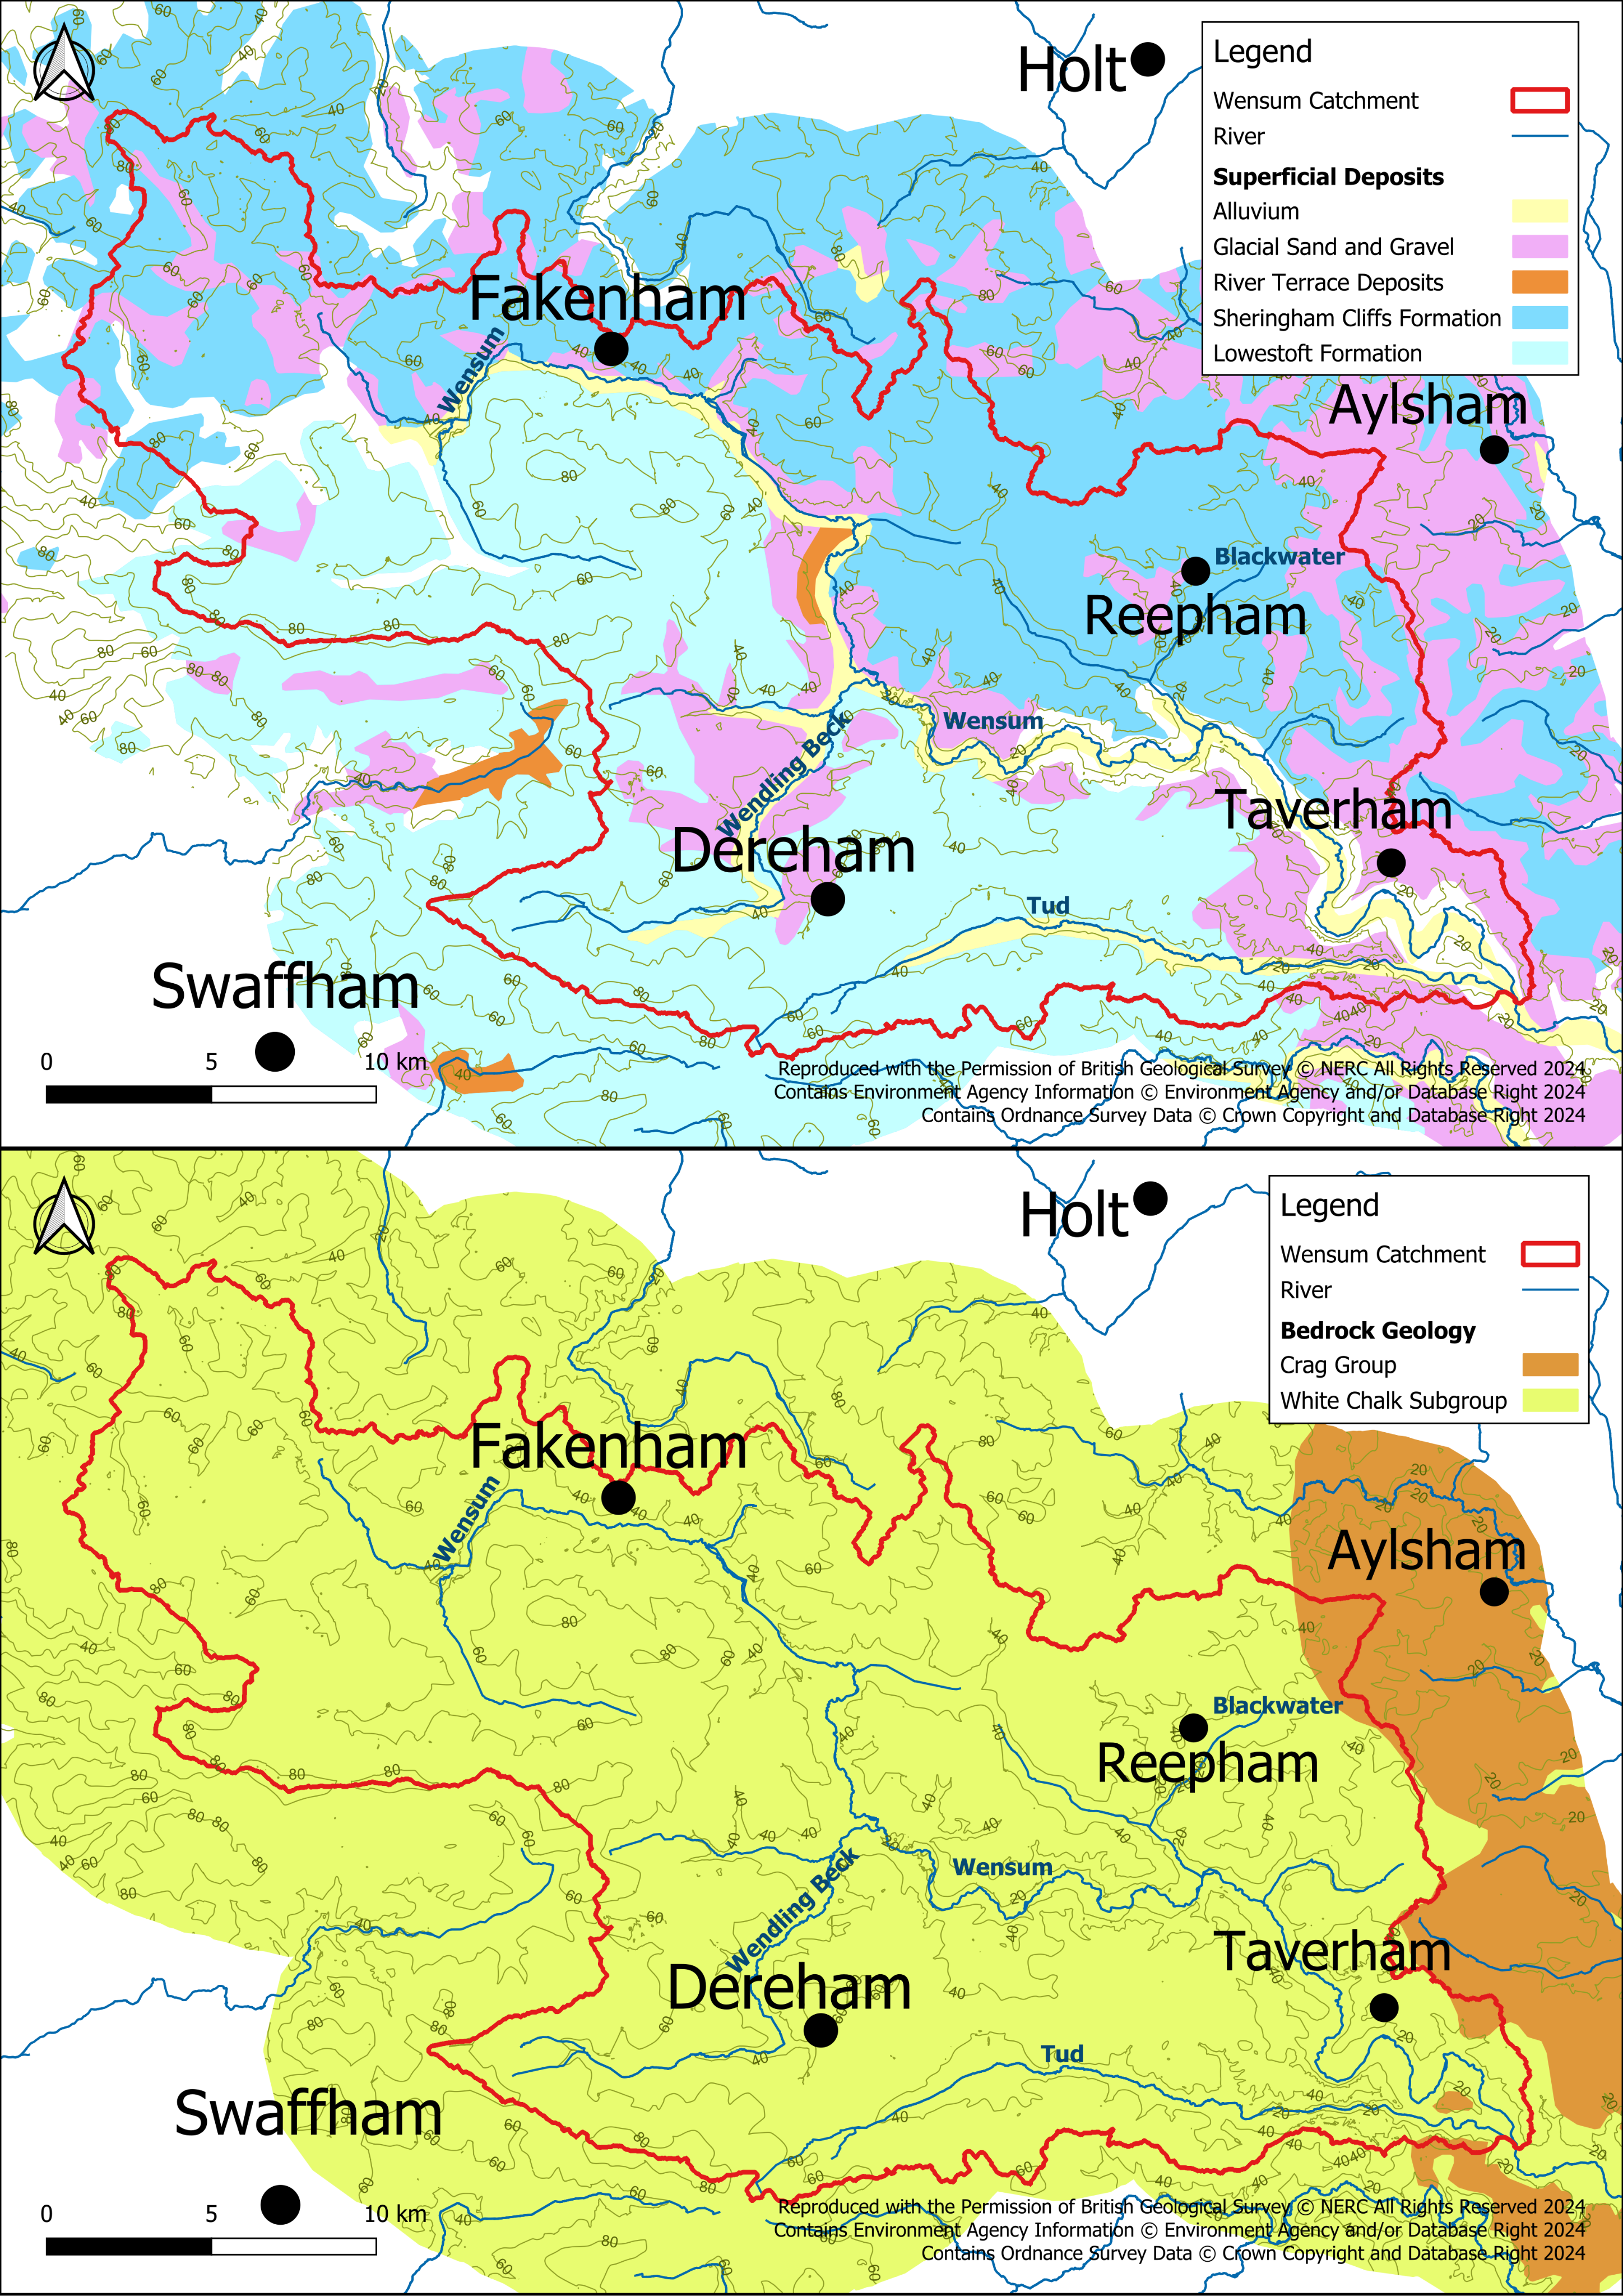
The topography and geology underlying the Wensum catchment, Norfolk, including superficial and bedrock units of the area, are shown in Figure 8.
The Wensum catchment begins with the Tutt in the west at around 80mAOD and slopes eastwards to its lowest in the Wensum floodplain at around 10mAOD, with the river flowing generally eastward. The Wensum catchment includes several tributaries, including the River Blackwater, Wendling Beck and the Tud. Downstream of the Wensum’s confluence with the Tud, the Wensum enters the River Yare, south-east of Norwich city centre.
The majority of the catchment is underlain by till deposits with low to moderate permeabilities. The superficial deposits across the catchment can be split into the following areas:
- South of the catchment – the south area of the catchment is dominated by low-permeability Lowestoft Till which can be found at higher elevations in the lower catchment. Throughout the valley floors, alluvium deposits can be found along river courses with river terraces on the valley sides. Glacial sands and gravels can be found scattered throughout the catchment overlying till in many areas.
- North and centre of the catchment – the high ground of the north and centre of the Wensum Catchment is overlain by Sheringham Cliffs Formation, predominantly the clay, silt, sand, and gravel members (moderate-permeability till). Glaciofluvial deposits are outcropping along the edge of the valley floor and are found along the main channel of the Wensum and partially along its confluence with Wendling Beck.
- East of the catchment – Around the Wensum’s confluence with the River Yare, the glacial sands and gravels outcrop along the valley sides surrounding the alluvium along the valley floor.
The White Chalk Subgroup underlies the whole area, dipping gently. There are only small areas of chalk outcropping due to the erosion of drift deposits in river valleys, for example in the west and east of the Wensum River valley. The Crag Group overlies the chalk in 2 locations on the eastern fringes of the catchment. The Crag Group infills depressions in the eroded chalk surface and varies in composition from sand to gravels.
Figure 8: Topography, superficial deposits and bedrock units within the Wensum catchment
Conceptual model
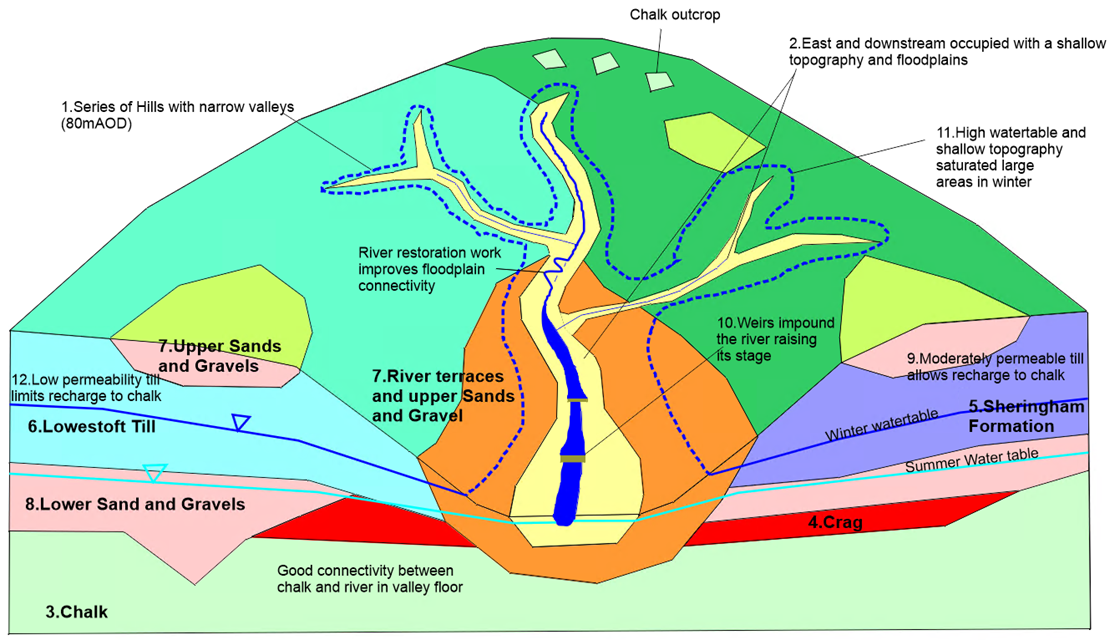
The Wensum catchment conceptual model is shown in Figure 9. It focuses on the elements that could be affected by NbS and therefore has a focus on the shallow groundwater system. It has the following features:
Topography:
- the west is occupied by a series of hills at around 80mAOD with narrow valleys
- the east and downstream end is occupied by ground at around 10mAOD and a wide floodplain
Geology and hydrogeology:
- the whole area is underlain by chalk which forms a principal aquifer
- the overlying Crag Group is limited to the far east of the catchment
The superficial deposits are complex:
- north of the Wensum, the hills are covered by moderately permeable till deposits (Sheringham Cliffs Formation)
- south of the Wensum, the hills are covered by low-permeability till deposits (Lowestoft Formation)
- there are 2 sets of high-permeability glaciofluvial deposits in the area – an upper layer sitting on top of the till covering patches of the hillside and the valley in the east, and a lower layer sitting under the till and resting on the chalk
- recharge to the underlying chalk aquifer is controlled by the thickness and permeability of the till. It is lowest where there are thick, low-permeability till deposits (Lowestoft Formation)
Water table:
- the Wensum is impounded by a series of weirs – this raises the water table within the valley floor
- in wet winters much of the low-lying moderately permeable till (Sheringham Cliffs Formation) area has a water table close to the surface. Underdrainage in fields is active during this period
- the low-permeability till (Lowestoft Till) area is generally elevated with narrower valleys, so the areas of winter saturation are limited to the valley floors
Figure 9: Wensum catchment conceptual model
Catchment specific interventions
Due to the varying nature of the geology within the Wensum catchment, including moderate and lower permeability aquifers, several types of NbS can be considered in different parts of the catchment which promote infiltration and limit runoff generation. The long list of NbS options can be simplified into the categories: soil improvement, land use change, RAFs, and floodplain and river restoration.
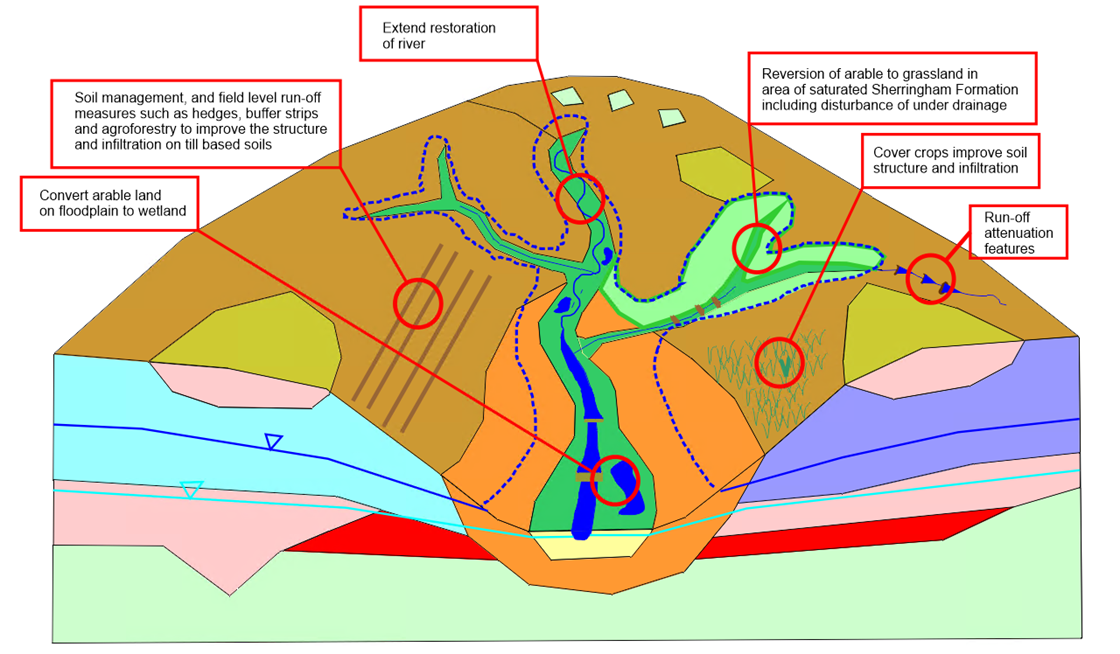
Figure 10 summarises intervention types that are specific to the area’s hydrogeological setting. The work identified 3 main settings.
Hillsides
This covers both the low-permeability Lowestoft Till Formation and the moderately permeable Sheringham Cliffs Formation:
- improving infiltration on the till soils: this mainly focuses on soil management techniques including cover crops and roughness strips within fields
- ‘catchment’ RAFs on hillslopes capturing runoff from Lowestoft Till to divert this into high-permeability sand and gravel deposits
In the valley floor
Package of work that allows the river to be maintained closer to bank-full for longer periods and for the valley floor to be saturated for longer including:
- river restoration
- conversion of land such as arable land back to wetland where appropriate
- weir removal should be accompanied by bed raising to ensure groundwater levels do not drop
Saturated valley margins
- reversion to grassland and removal of drainage including underdrainage in areas of seasonal saturation – this would allow areas that are naturally seasonally waterlogged to hold their water for longer
- improved soil management techniques such as cover crops, and non-inversion tillage to improve soil structure and infiltration – this can be accompanied by wider measures such as buffer strips set as right angles to the slope to capture runoff
- RAFs to store water on the land and capture runoff
Figure 10: Wensum catchment interventions
For more detail of the catchment interventions, see the NbS for water resources technical handbook.
Summary of NbS options in chalk catchments
Groundwater modelling using regional groundwater models with different scenarios of NbS interventions has been done for the 3 chalk catchments. This section presents and compares some of these results.
Table 2 summarises the names of the modelling scenarios and the broad categories that they fall into.
Table 2: Choices of NbS scenarios
| Category | Description | NbS Scenario |
|---|---|---|
| Water use (Land use change) | Conversion of arable land use to pasture and horticulture | Arable to pasture, arable to horticulture |
| Runoff infiltration split (soil improvement) | Reduction of rapid runoff by improving soil health | 50% runoff factor |
| Runoff attenuation features (RAFs) | A range of RAFs were modelled from within-field RAFs, to ones located on drains, to ones more akin to infiltration basins | RAF (various) |
| Floodplain and river restoration | Raising water levels to store more water within the floodplain in alluvial aquifers | River restoration |
Water use
The water use suite of measures is perhaps the least sensitive to the underlying geology. In considering how to improve water resources by using this suite of measures, it is important to identify land uses which have lower evapotranspiration rates or lower water use (be this from rainfall or irrigation).
Choices of modelled water use NbS measures in the 3 case study catchments include:
- conversion of arable land use to pasture
- conversion of arable land use to horticulture
Horticulture is a land use type in the regional groundwater models that represents a low water use mix of crops (such as strawberries) compared to arable and so was used to assess the impacts of changing crop types. Table 3 shows the evapotranspiration rate in the 3 case study catchments. It also shows the percentage change in the evapotranspiration rate from the baseline (no NbS measures) after implementation of NbS measures. Table 3 shows that the evapotranspiration rate in the Test catchment is generally higher than in the Wensum and Cam catchments.
Table 3: Actual evapotranspiration (mm/year) across case study catchments through water use NbS modelling scenarios (percentage change from baseline in brackets)
| Scenario | Cam | Test | Wensum |
|---|---|---|---|
| Baseline | 314 | 495 | 420 |
| Arable to pasture | 316 (+0.8%) | 515 (+3.9%) | 430 (+2.4%) |
| Arable to horticulture | 303 (-3.4%) | 489 (-1.3%) | 403 (-3.9%) |
The evapotranspiration results show that conversion of arable land use to pasture resulted in an increase of 0.8% to 3.9% in evapotranspiration rates across the 3 catchments, with the maximum change in the Test catchment. The results also show that the conversion of arable to horticulture land use reduces the evapotranspiration rate in all 3 catchments, with a maximum reduction of 3.9% in the Wensum catchment. The parameterisation of arable land use characteristics is based on an averaged crop mix, for which a representative set of values have been derived. In practice, the effects of crop rotation will influence rates of actual evapotranspiration between years.
Model results of recharge and BFI in water use NbS scenarios and their changes from the baseline (no NbS interventions) are presented in Table 4 and Table 5.
Table 4: Recharge (mm/year) to groundwater across case study catchments through water use NbS modelling scenarios (percentage change from baseline in brackets)
| Scenario | Cam | Test | Wensum |
|---|---|---|---|
| Baseline | 76 | 386 | 136 |
| Arable to pasture | 74 (-3.2%) | 367 (-5%) | 129 (-4.9%) |
| Arable to horticulture | 84 (+10.4%) | 393 (+1.7%) | 147 (+7.9%) |
Table 5: Baseflow Index (BFI) percentages across case study catchments through water use NbS modelling scenarios (percentage change from baseline in brackets)
| Scenario | Cam at Dernford | Test at Chilbolton | Wensum at Costessey Mill |
|---|---|---|---|
| Baseline | 54.3 | 93.6 | 75.7 |
| Arable to pasture | 53.8 (-0.9%) | 93.3 (-0.3%) | 76.2 (+0.6%) |
| Arable to horticulture | 54.8 (+0.9%) | 93.8 (+0.2%) | 75.9 (+0.2%) |
Results show that conversion of arable land use to pasture results in reductions in recharge to groundwater in all 3 catchments, with a maximum reduction of 5% from the baseline in the Test catchment. Results also show that conversion of arable to horticulture land use results in more recharge compared to the baseline with a maximum increase of 10.4% in the Cam catchment. This is mainly due to higher evapotranspiration rates for pasture compared to the horticulture land use. A similar trend is also seen in BFI (with an exception in the Wensum catchment). There is a maximum reduction of 0.9% in BFI from the baseline in the arable to pasture conversion scenario in the Cam catchment and a maximum increase of 0.9% in BFI from the baseline in the arable to horticulture conversion scenario in the Cam catchment. The arable to pasture conversion model results show an increase of 0.6% in the Wensum catchment at the Costessey Mill assessment point.
Overall, changing water use of land cover affects the amount of water in the system independent of geology. Conversion to pasture can offer extensive biodiversity benefits, whereas conversion to horticulture may have certain disbenefits, with more extended periods of bare earth leading to greater soil erosion.
Runoff infiltration splits and runoff capture and infiltration
The runoff infiltration splits and runoff capture and infiltration NbS measures involve suites of measures to reduce and capture surface runoff and increase infiltration. This can be achieved through soil improvements and the installation of RAFs. The potential for reducing the amount of runoff and increasing infiltration through soil improvements or using RAFs is particularly sensitive to the underlying geology.
The greatest benefit from soil improvements can be seen within the low-permeability areas where the rapid runoff is greatest. The RAFs also work best where there are 2 elements:
- a low or moderate-permeability area where lots of runoff is generated
- a high-permeability area where water can be collected and infiltrated to ground
Choices of modelled runoff infiltration split (soil improvement) and runoff capture and infiltration NbS measures in the 2 case study catchments, including the Cam and Wensum catchments include:
- 50% runoff factor – a 50% reduction in rapid runoff by improving soil health
- Implementation of RAFs of varying sizes and locations (see Table 2)
No soil improvement or RAF scenarios were developed for the Test catchment, as there is limited runoff on chalk to be captured to increase recharge and so no places in the model could be found to implement RAFs.
The results in terms of groundwater recharge and BFI in runoff infiltration splits and runoff capture and infiltration NbS scenarios and their changes from the baseline (no NbS interventions) are presented in Table 6 and Table 7.
Table 6: Recharge (mm/year) to groundwater across case study catchments through runoff infiltration splits and runoff capture and infiltration NbS modelling scenarios (percentage change from baseline in brackets)
| Scenarios | Cam | Wensum |
|---|---|---|
| Baseline | 76.4 | 135.7 |
| 50% runoff factor | 77.5 (+1.5%) | 138.9 (+2.4%) |
| RAFs | 80.0 (+4.7%) to 84.7 (+10.9%) | 139.4 (+2.7%) to 153.0 (+12.8%) |
Table 7: Baseflow index (BFI) as percentages across case study catchments through runoff infiltration splits and runoff capture and infiltration NbS modelling scenarios (percentage change from baseline in brackets)
| Scenario | Cam at Dernford (49% till) | Cam at Swaffham Bulbeck (12% till) | Wensum at Costessey Mill |
|---|---|---|---|
| Baseline | 54.3 | 93.7 | 75.7 |
| 50% runoff factor | 56.1 (+3.3%) | 93.7 (0%) | 78.4 (+3.6%) |
| RAFs | 59.1 (+8.8%) to 65.8 (+21.2%) | 93.7 (0%) | 77.0 (+1.7%) to 82.5 (+9%) |
Model results show that soil improvement and implementation of RAFs result in higher recharge and BFI in comparison to the baseline across the 2 catchments, with a maximum increase of 12.8% in recharge and 21.2% in BFI in the Wensum and Cam catchments respectively through implementation of RAFs. Soil improvement and reduction of runoff by 50% resulted in an approximate increase of 3% in both the Cam and Wensum catchments. However, in the areas with lower permeability till coverage in the Cam catchment, there is limited runoff and therefore, reduction of runoff by 50% does not show any betterment in BFI.
The BFI results show that the greatest benefit from soil improvements and implementation of RAFs can be seen within the low-permeability areas such as in the Wensum catchment and in areas within the Cam catchment with more coverage of low-permeability till, where the rapid runoff is greatest. The BFI results show no change through soil improvement or application of RAFs in high-permeability chalk areas in the Cam catchment with limited low-permeability till coverage.
Overall, for runoff interventions, they are most effective in catchments where lots of runoff can be generated but the geology allows some infiltration to occur.
Floodplain and river restoration
The floodplain and river restoration NbS for water resources measures involve actions that raise water levels to increase groundwater recharge and storage within the floodplain. This can be achieved by increasing riverbed levels and allowing more leakage from the stream to groundwater. Raising water levels, however, could result in a wider riparian or wetland zone and consequently higher evapotranspiration which in turn may reduce groundwater recharge.
The modelled floodplain and river restoration NbS measures include raising water levels by increasing riverbed levels in the 3 case study catchments.
Model results of groundwater recharge and BFI for the river restoration NbS scenario within the 3 catchments and the changes from the baseline (no NbS interventions) are presented in Table 8 and Table 9.
Table 8: Recharge (mm/year) to groundwater across case study catchments through the River Restoration NbS modelling scenario (percentage change from baseline in brackets)
| Scenario | Cam | Test | Wensum |
|---|---|---|---|
| Baseline | 76.4 | 386.4 | 135.7 |
| River restoration | 76.3 (-0.1%) | 386.1 (-0.1%) | 135.7 (0%) |
Table 9: Baseflow Index (BFI) as percentages across case study catchments through the River Restoration NbS modelling scenario (percentage change from baseline in brackets)
| Scenario | Cam at Dernford | Test at Chilbolton | Wensum at Costessey Mill |
|---|---|---|---|
| Baseline | 54.3% | 93.6% | 75.7% |
| River restoration | 53.8% (-0.9%) | 93.5% (-0.1%) | 75.6% (-0.1%) |
Modelling floodplain and river restoration NbS scenarios shows that raising water levels does not make a significant change in groundwater recharge or BFI in the 3 catchments and is unlikely to provide a useful benefit to water resources in general. This may reflect the small proportion of catchments that are occupied by floodplains.
2. Non-chalk conceptualisations
This section presents 2 case studies within geologies other than chalk, including the Wye, Herefordshire and Otter, Devon.
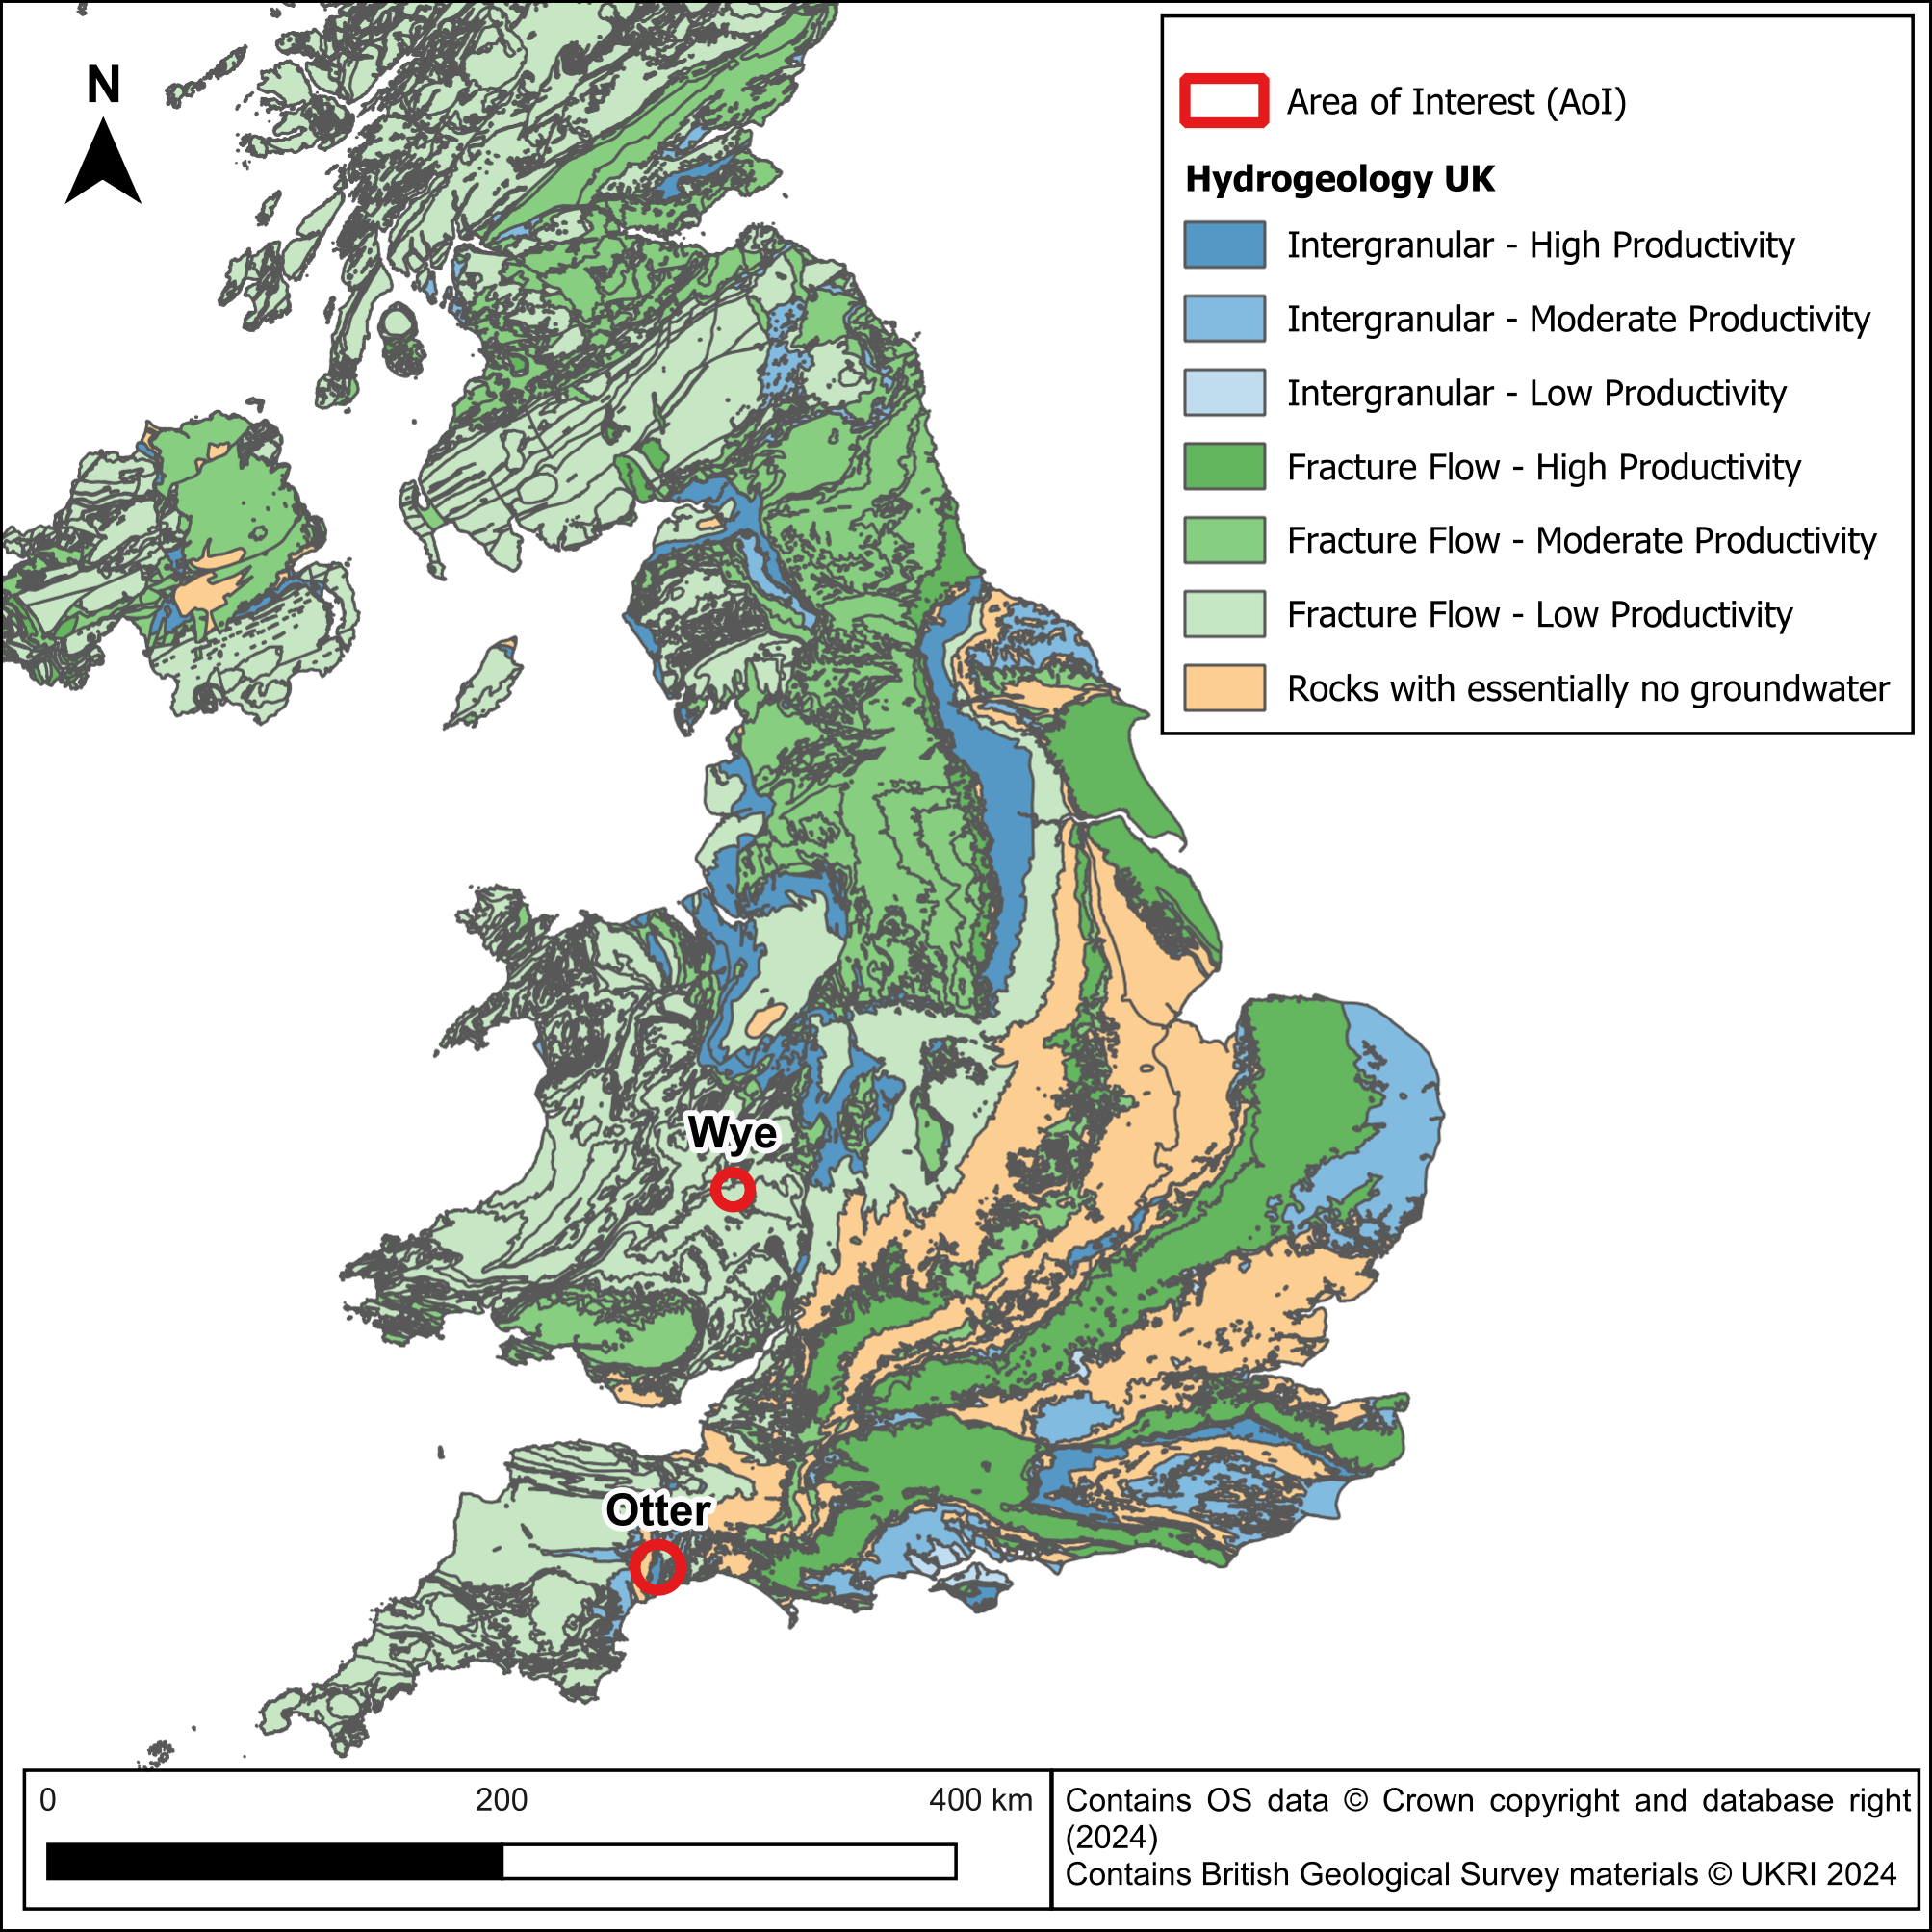
Table 10 presents the aquifer systems and the relevant case studies. Conceptual models of the areas have been developed for each aquifer system, and the potential NbS measures across each catchment then assessed. The locations of the 2 case study areas are shown in Figure 11.
Table 10: Aquifer systems and NbS case studied in geologies other than chalk
| Aquifer System | Case Study Catchment |
|---|---|
| Low-permeability (mudstone) bedrock catchments covered by low and high-permeability drift | Wye |
| High-permeability (sandstone) bedrock adjacent to the low-permeability (mudstone) bedrock catchments with limited covering drift | Otter |
Figure 11: Locations of the Wye and Otter case studies
Conceptual model and NbS for water resources potential area summary: Wye
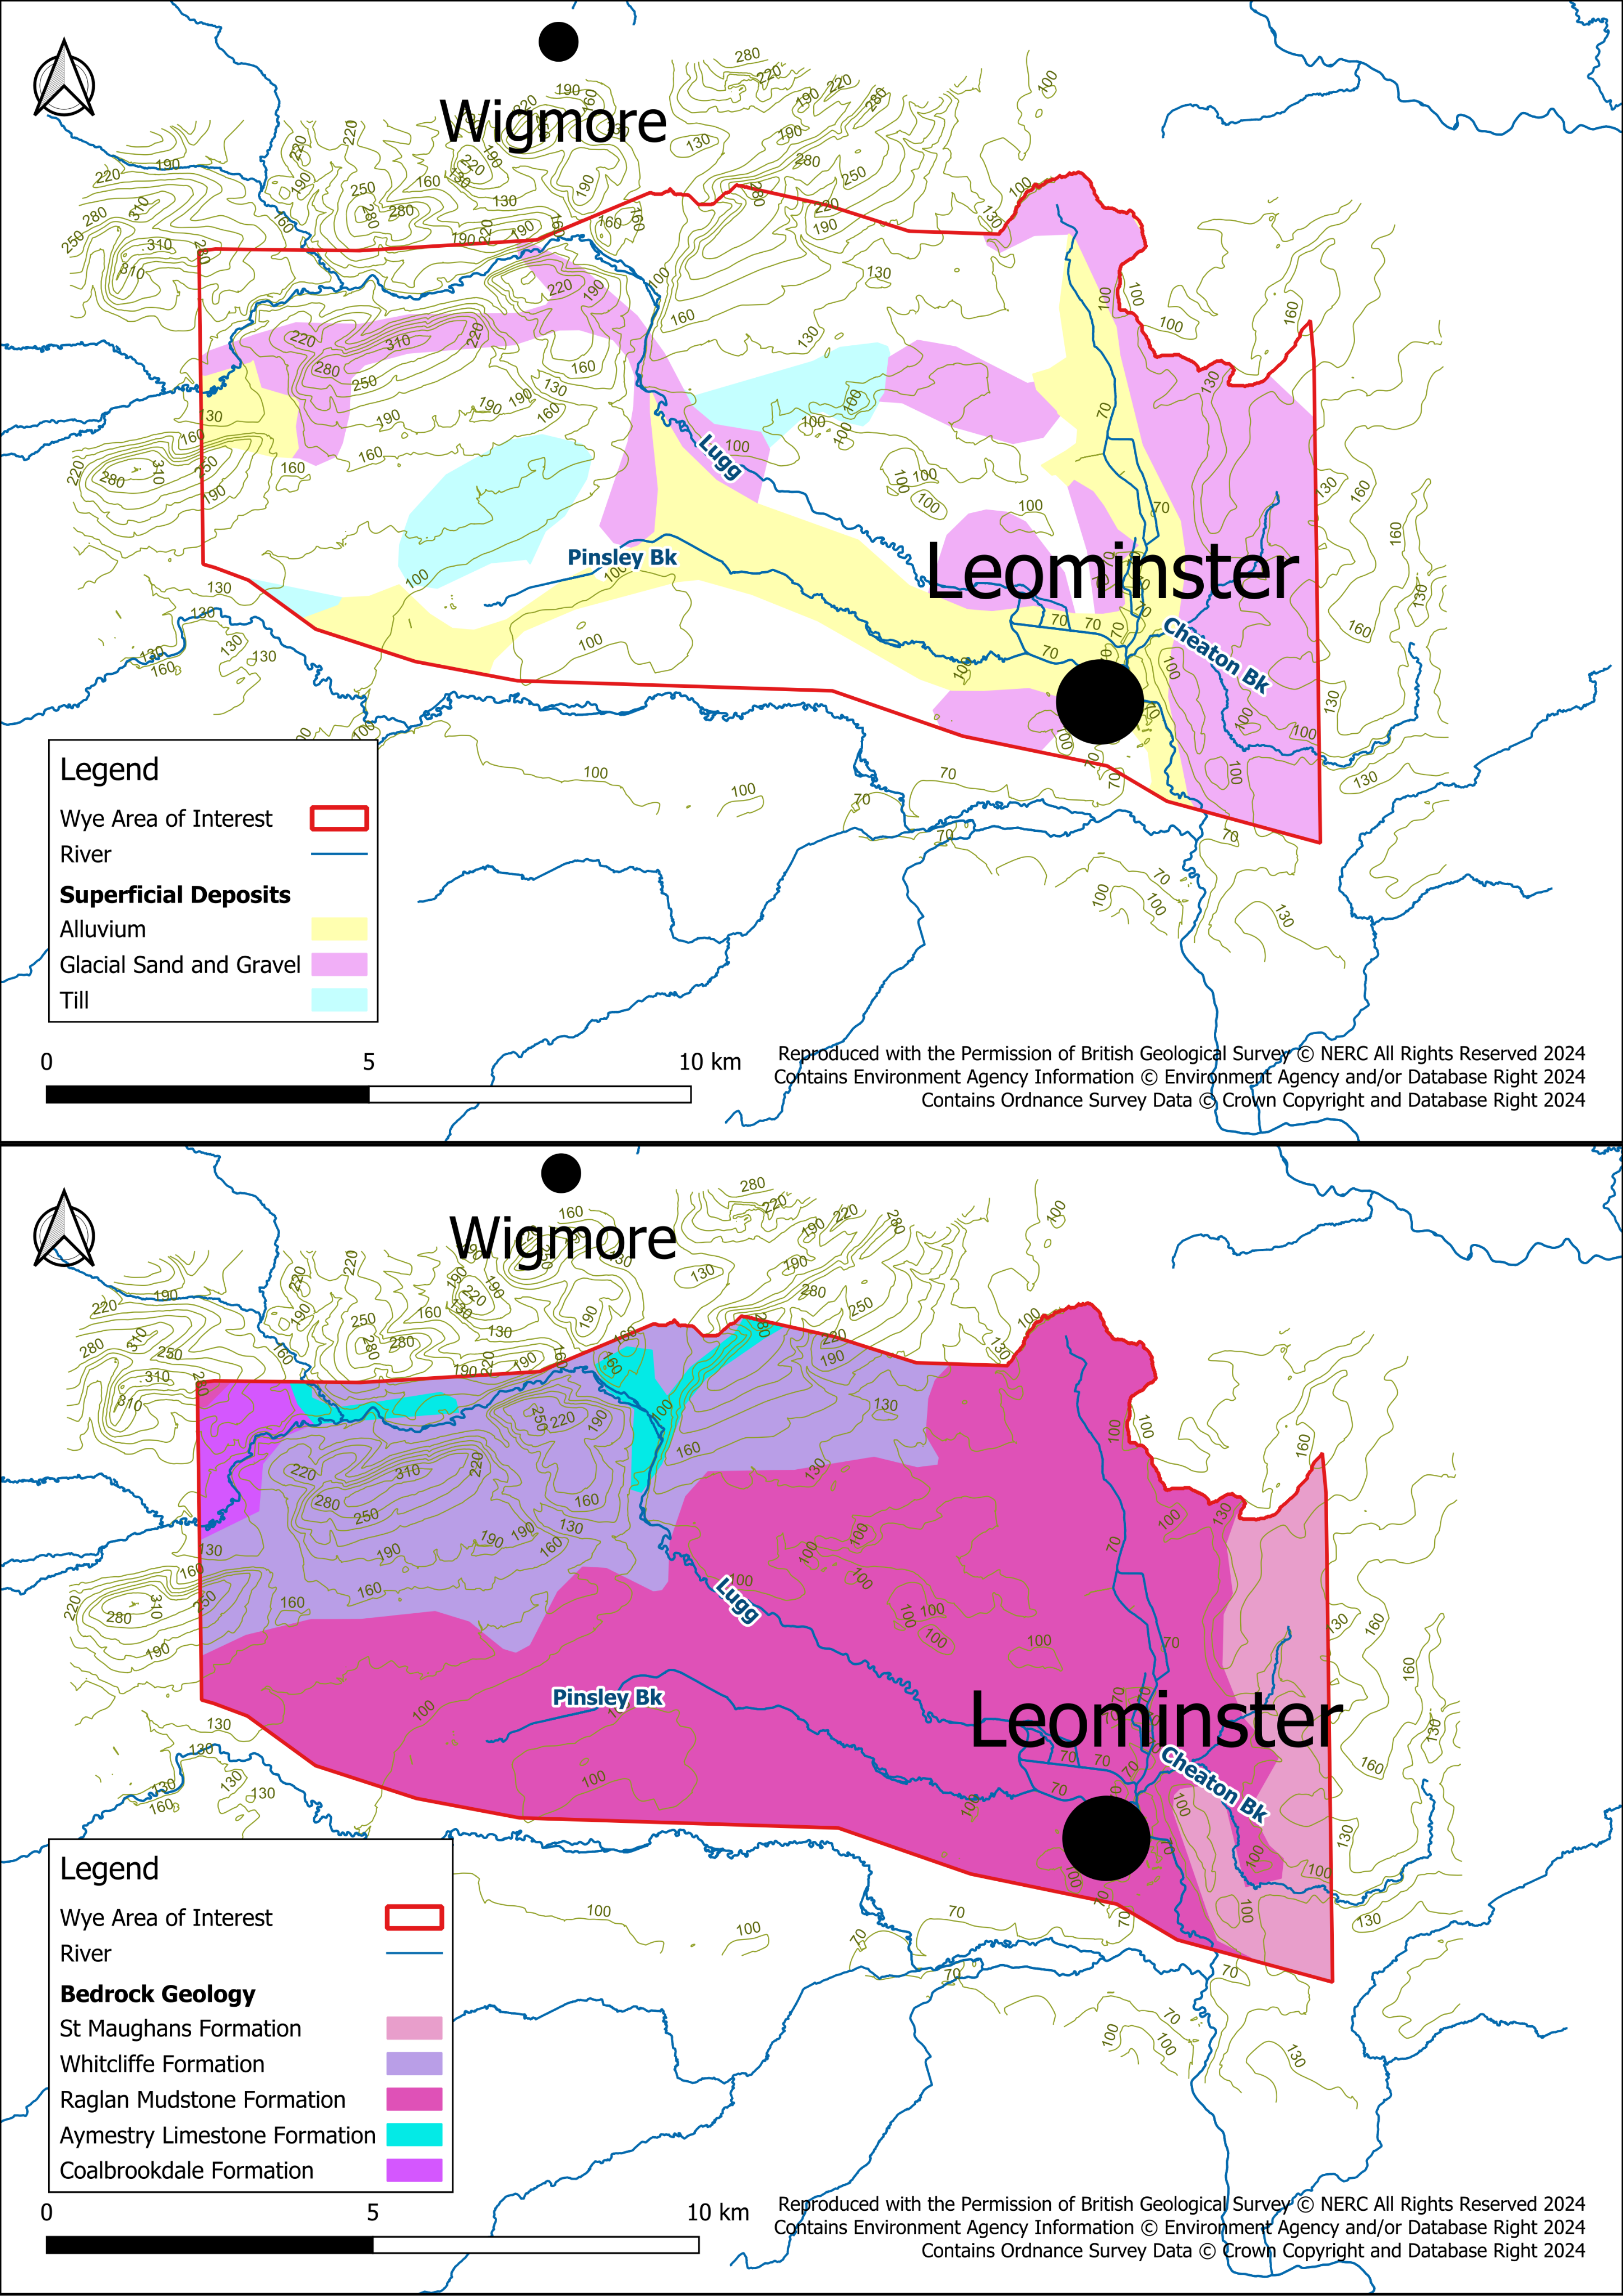
This section summarises the key findings from the Wye Study Area. The topography and geology underlying the Wye, including superficial and bedrock units, are shown in Figure 12.
The elevation is highest in the north-west of the Wye Study Area at approximately 280mAOD at its peak, decreasing towards the south-east (to approximately 65mAOD), following the path of the River Lugg.
Superficial alluvium, comprising clay, silt, sand and gravel, occurs along the valley of the River Lugg, in the centre of the Study Area, and along Ridgemoor Brook which runs north-south in the east of the Study Area. Glaciofluvial deposits outcrop along the edge of the Lugg valley and at the head of the Pinsley Brook valley.
Superficial till deposits occur throughout the Study Area in the higher areas and underlie the Lugg valley floor.
The eastern edge of the Wye Study Area is underlain by the St Maughan’s Formation comprising clay-rich argillaceous strata with subordinate sandstones. The majority of the central part of the Wye Study Area is covered by the Silurian Raglan Mudstone Formation which comprises interbedded siltstones and mudstones. The western part of the Wye Study Area is underlain by the Whitcliffe Formation comprising siltstones and a series of smaller outcrops of older strata on the upper parts of the hill.
The structure of the bedrock is made up of a syncline, leading to the younger rocks outcropping in the low areas in the centre and east, with older rocks forming the hills in the north-west.
Figure 12: Topography, superficial deposits and bedrock units within the Wye Area of Interest
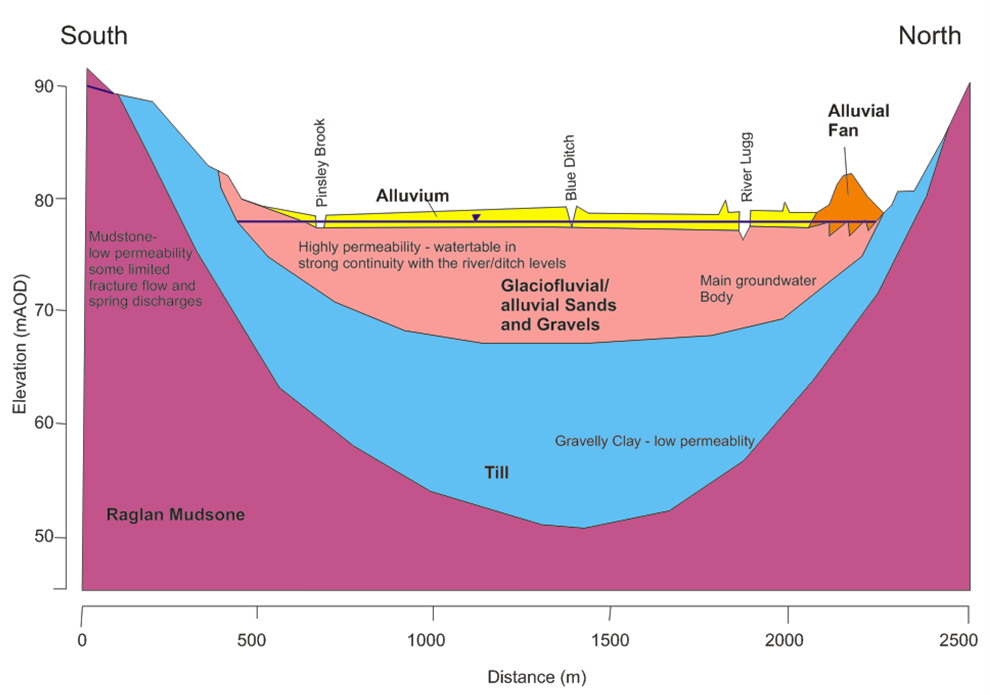
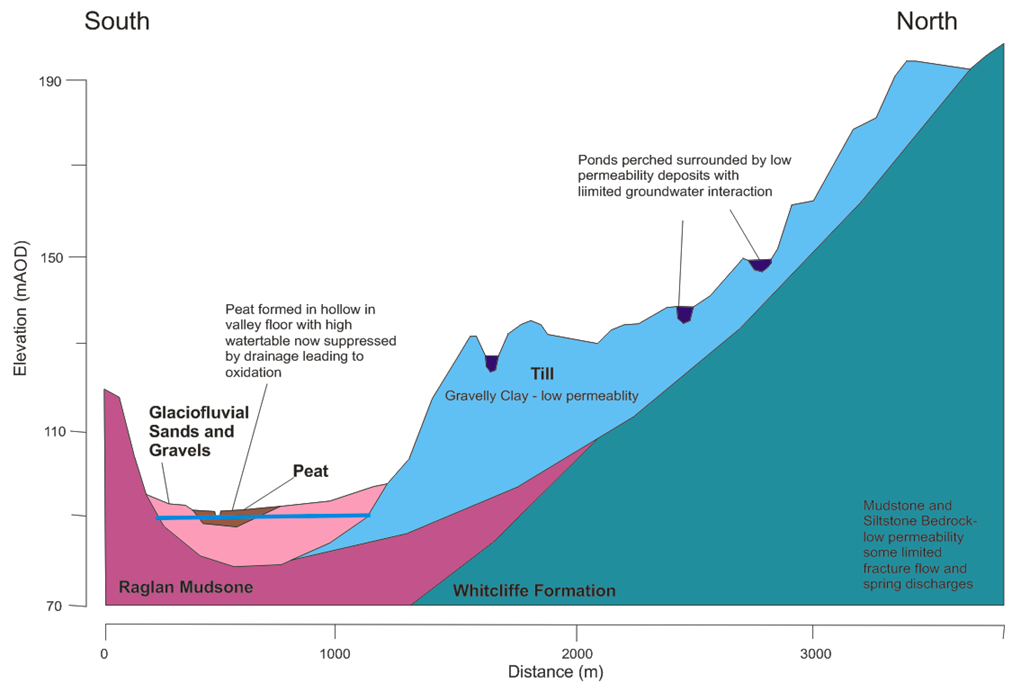
The hydrogeological conceptual model of the area is shown in Figure 13 as 2 cross sections. The first presents a cross section of the Lugg floodplain between Kingsland and Eyton. The second is a line from the valley floor at Shobdon Marsh and through the uplands to the north. They show the following features.
The bedrock geology and hydrogeology features show the area is underlain, in the main, by low-permeability mudstones and siltstones. There is some limited flow through fractures with spring discharges.
Superficial geology and recharge:
- till covers parts of the hillside and underlies parts of the valley floors – perched ponds and streams form in topographical hollows, with limited groundwater interaction
- thick, high-permeability glaciofluvial sands and gravels underlie the main valley floors – these are dominated by intergranular groundwater flow
The height of the water table within them is controlled by the stage of the watercourses. The stages have been artificially influenced by weirs, drainage works and abstractions. A number of these weirs are now in the process of removal due to the benefits this may have on flood risk and biodiversity.
When water is higher in the watercourse than the surrounding sands and gravels, the watercourses lose water.
Peat is formed in a topographical hollow within the glaciofluvial deposits, which created an area with a high water table that allowed peat to accumulate. The straightening of Pinsley Brook will have lowered the water table in the area.
Figure 13: Wye and River Lugg Study Area conceptual models
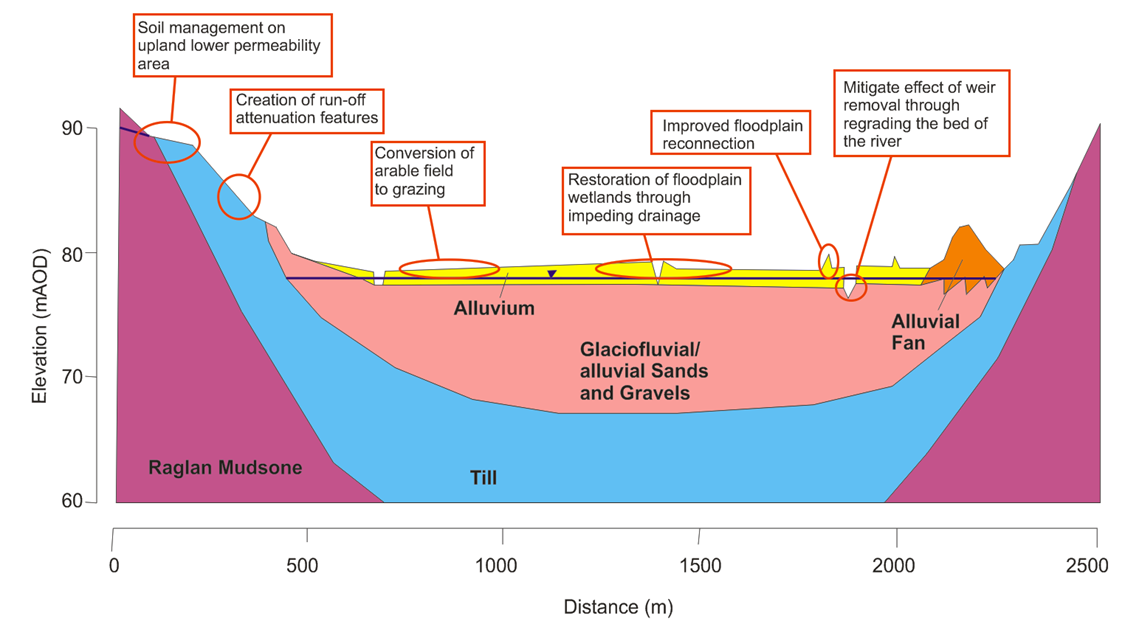
A wide suite of NbS for water resources interventions can be implemented across the catchment including land use and soil management practices which promote infiltration and limit runoff generation, such as:
- soil management on upland lower permeability area
- creation of RAFs
- conversion of arable field to grazing
- restoration of floodplain wetlands through impeding discharge
- improve floodplain reconnection
- mitigating effect of water removal through regrading the bed of the river
Figure 14 focuses on intervention types that are specific to the hydrogeological conditions of the Study Area. They cover options for the floor of the valley underlain by the alluvial aquifer and options for the surrounding hills.
Figure 14: Wye and River Lugg Study Area conceptual model with NbS for water resources measures
Conceptual model and NbS for water resources potential area summary: Otter
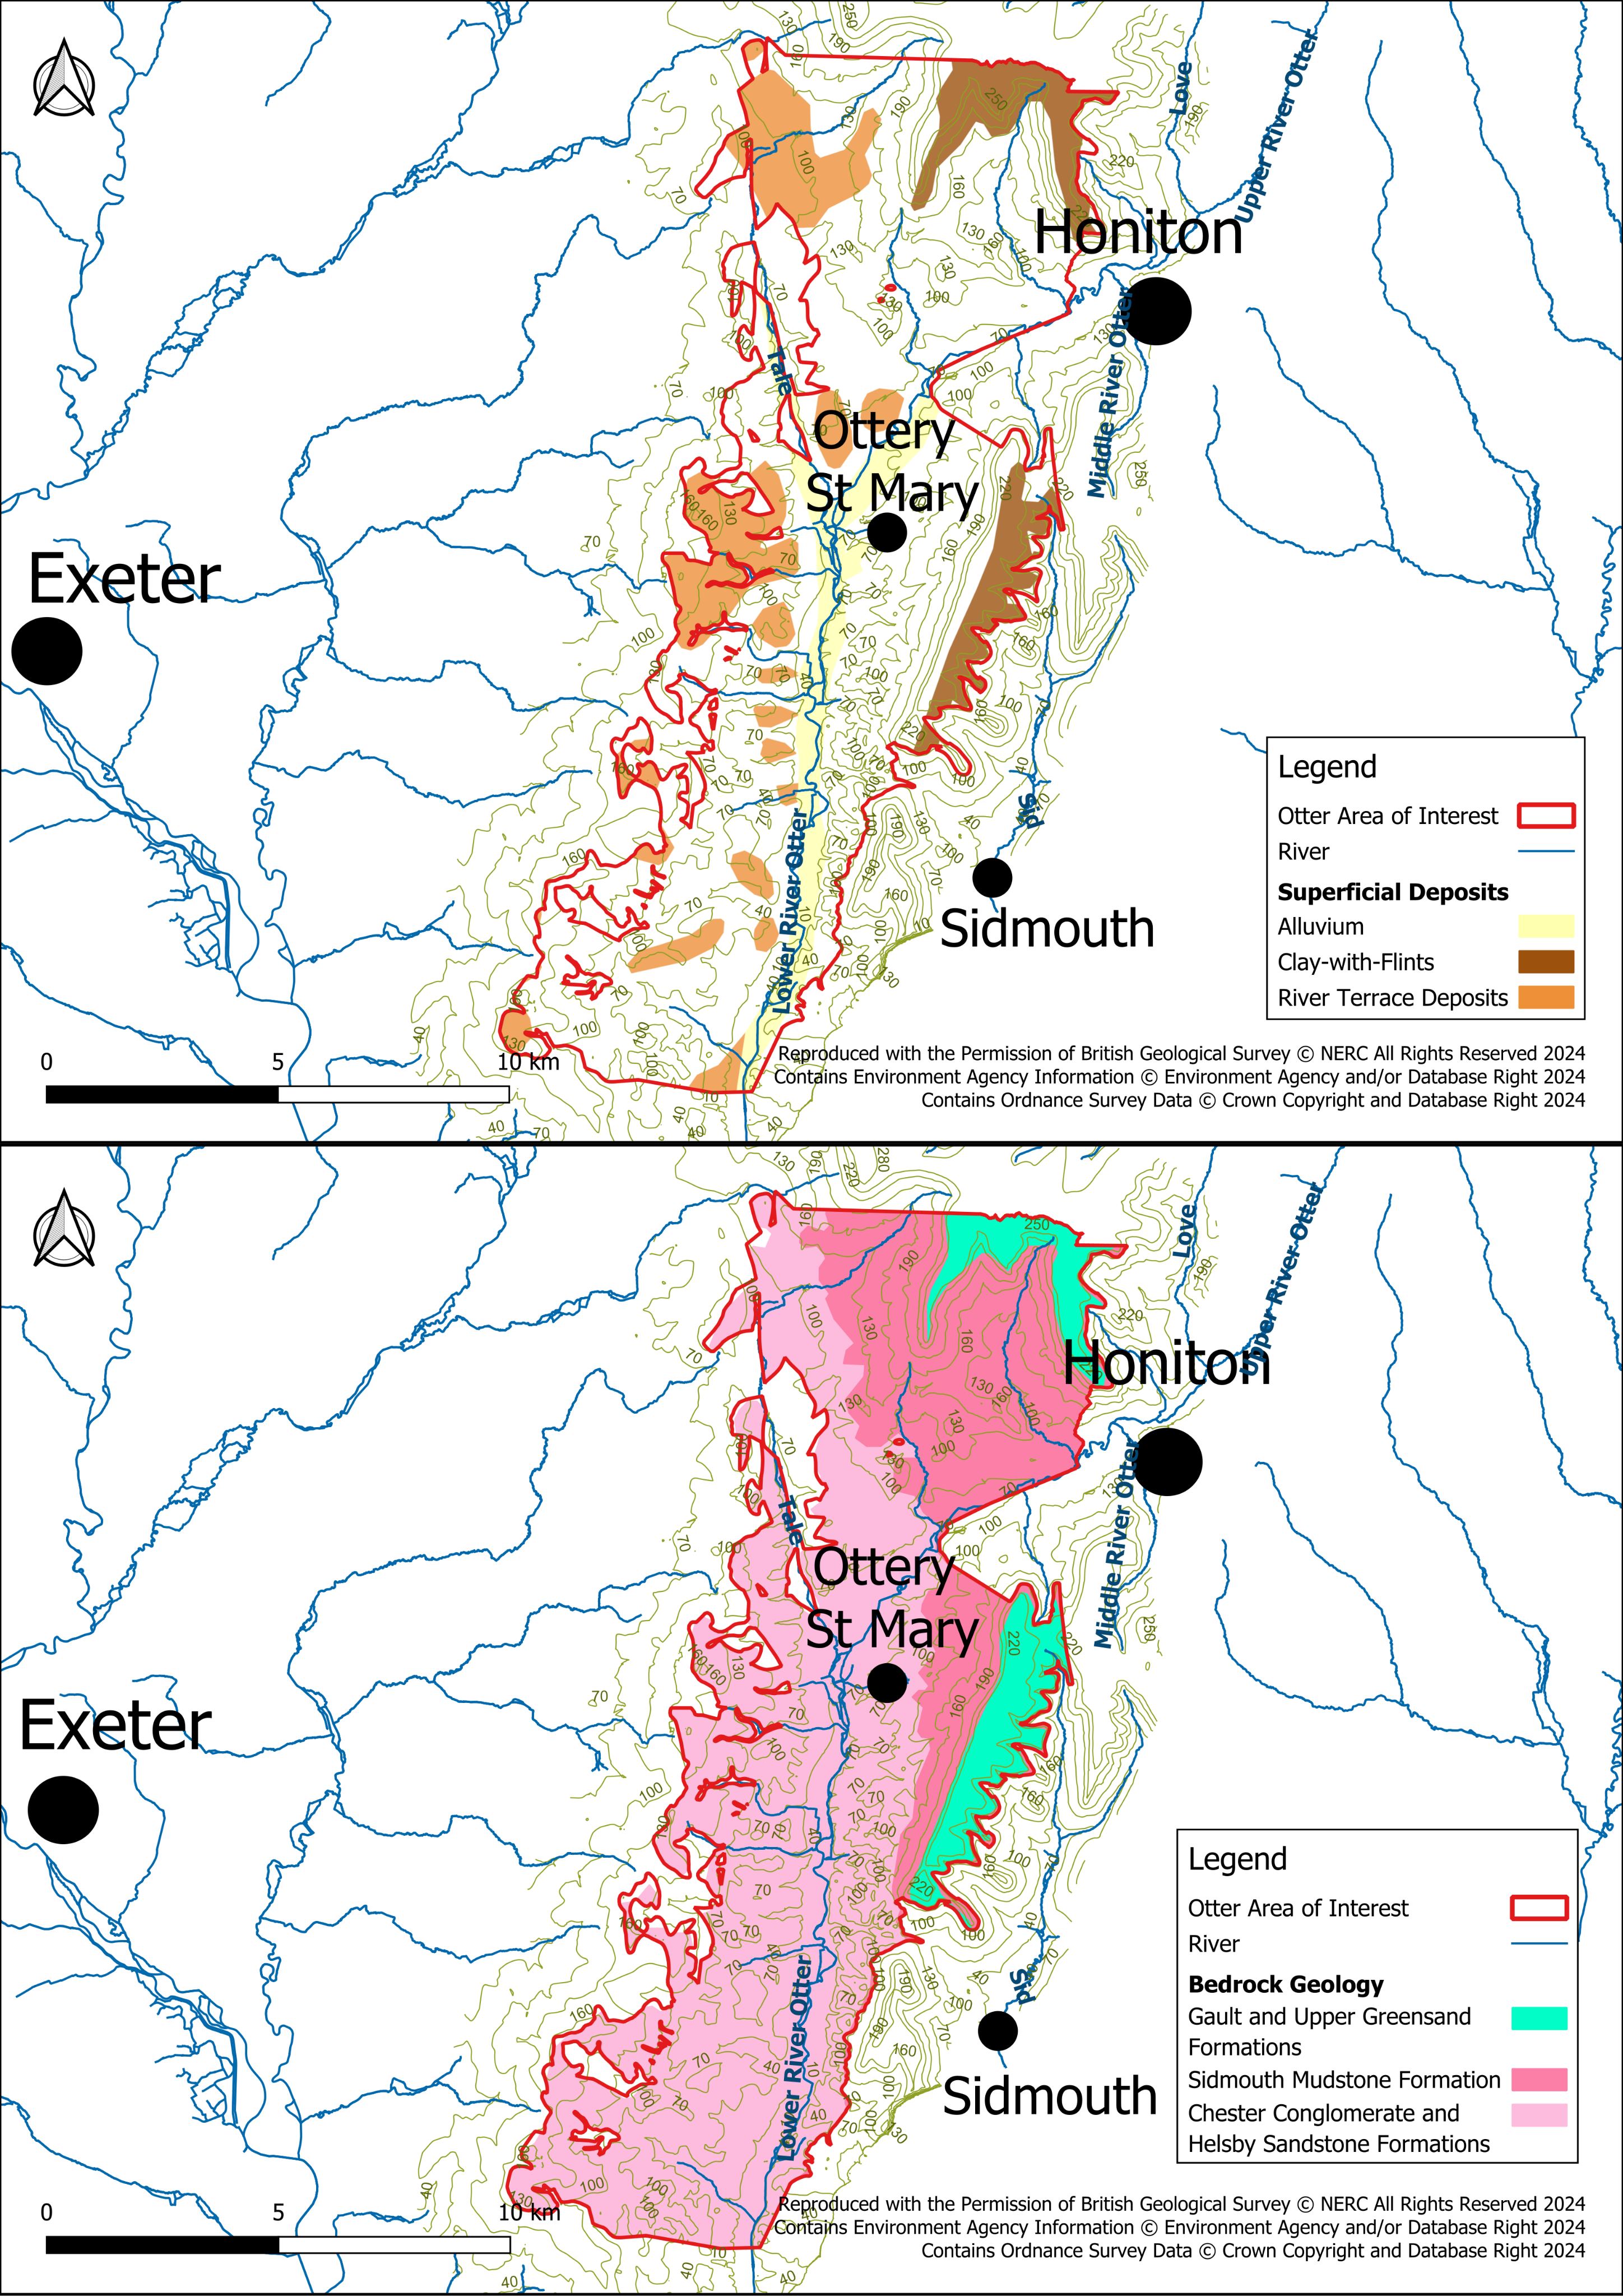
This section summarises the key findings from the Otter Study Area. The topography and geology underlying the Otter Study Area, including superficial and bedrock units, are shown in Figure 15.
The eastern and northern borders of the Otter Study Area have the highest elevations at approximately 210mAOD and the western border has an elevation of approximately 100mAOD. Elevations are reduced towards the middle of the Otter Study Area and the River Otter at approximately 40mAOD, reaching a low of approximately 3mAOD in the south of the Otter Study Area.
Much of the Otter Study Area has no superficial deposits with bedrock exposed beneath the soils. Where superficial deposits are present these include:
- Clay-with-flints: clay and sand with unworn cobbles of flint and chert – along the east of the Study Area, overlying the Upper Greensand, up to 30m thick. The Clay-with-Flints sediments formed by dissolution of the chalk bedrock. It may contain solution collapse features and where thin may also be disrupted by roots. These features can provide some permeability. Runoff is likely to be localised, recharging the underlying and surrounding Upper Greensand aquifer.
- alluvium: clay, silt, sand, peat and gravel – closely associated with the river valleys of the Otter (up to 500m wide), Tale and Sid.
- river terrace gravel: sand and gravel – along the valleys.
The solid geology dips slightly towards the east. From west to east the bedrock geology outcrops as follows:
- interbedded units of sandstone and conglomerate of Triassic rocks including Chester (conglomerate) and Helsby Sandstone Formations
- Sidmouth Mudstone formation
- Gault and Upper Greensand Formation (sandstone)
Helsby Sandstone is the most prominent rock type, starting in the north-west near the River Tale and following the pathway of the River Otter to the south. To the east of this formation, the Sidmouth Mudstone Formation covers much of the north-east of the catchment extending down to Tipton St John.
Figure 15: Topography, superficial deposits and bedrock units within the Otter Area of Interest
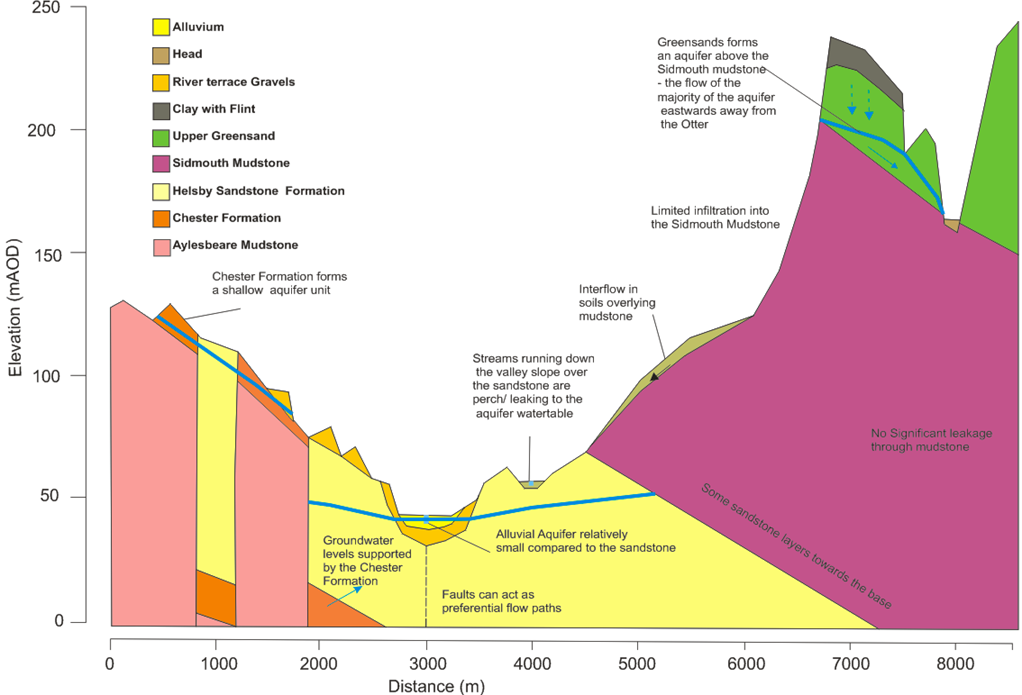
The hydrogeological conceptual model of the Otter Study Area is shown in Figure 16. It has the following features.
Bedrock geology and hydrogeology
The west of the Study Area along the edge of the Otter valley includes small outcrops of the Chester Formation which comprises a thin but highly permeable aquifer, cut by faults. The groundwater level is close to the surface and likely to be in connection with river terrace gravels. Enhanced recharge in this area may result in increased groundwater flow towards the main Helsby Sandstone in the Otter valley.
The main Otter valley is underlain by the Helsby Sandstone (Sherwood Sandstone) aquifer. The groundwater level is likely to be in connection with the River Otter but below the level of some of the more minor tributaries. This leaves the potential for leakage from the tributaries to contribute to groundwater recharge.
The Sidmouth Mudstone (Mercia Mudstone Group) has only limited potential for enhancing groundwater recharge. However, measures to increase recharge over the Sidmouth Mudstone may result in increased interflow within the soil and weathered upper margin of the mudstone. This interflow may flow horizontally to nearby surface waters or recharge the Helsby Sandstone in the Otter valley.
Recharge
Recharge through the clay caps on the Upper Greensand is likely to contribute to groundwater flow east away from the Otter valley.
Figure 16: Otter Study Area conceptual model
A wide suite of NbS for water resources interventions can be implemented across the catchment including land use and soil management practices which promote infiltration and limit runoff generation.
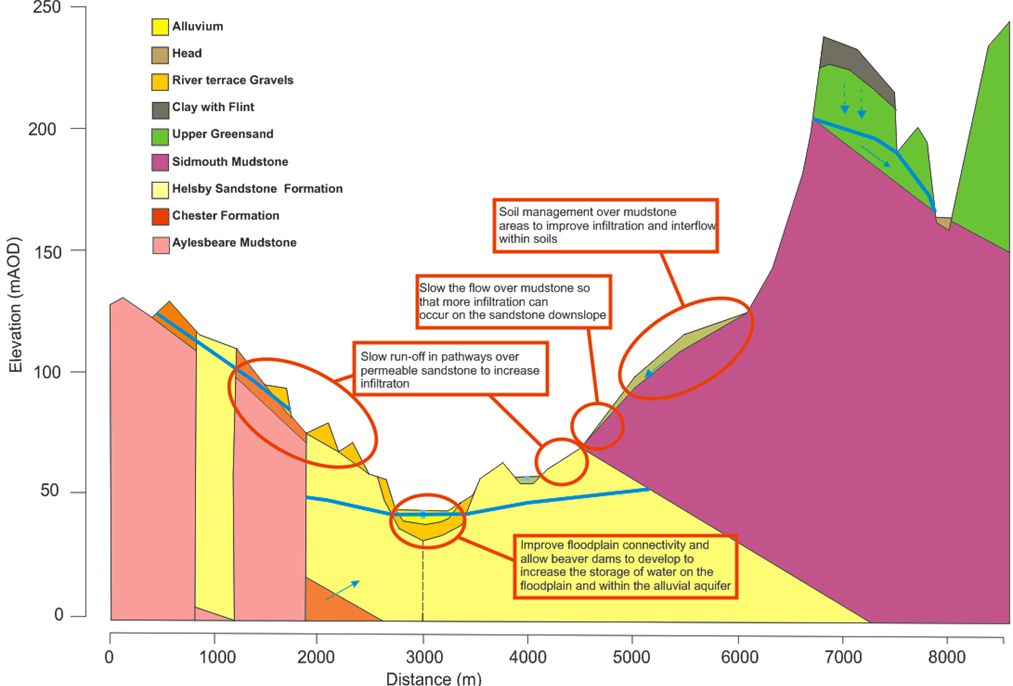
Figure 17 focuses on interventions that are specific to the hydrogeological conditions of the Study Area. Specific interventions relevant in the Study Area are:
- slowing runoff pathways in the west over the thin Chester Formation bedrock to increase recharge – at times of high groundwater levels, the potential for recharge into the Chester Formation may be limited
- there is likely to be scope for recharge to the margins of the Helsby Sandstone at the west and eastern margins of the Otter valley, as the groundwater level is lower – this recharge can be from slower runoff and also infiltration recharge from losing watercourses perched over the sandstone
- improving floodplain connectivity in the Otter valley – this will allow increased aquifer storage in the floodplain and associated alluvial aquifer
- slowing runoff in the east of the Study Area will result in increased recharge through the clay caps and increased recharge to soils over the Sidmouth Mudstone – recharge to the clay caps will benefit the Upper Greensand – recharge over the Sidmouth Mudstone is likely to form interflow which will discharge slower to nearby surface waters and also have the potential to recharge the Helsby Sandstone
Figure 17: Otter conceptual model with NbS for water resources measures
Modelling the implementation of combined NbS interventions including:
- Application of RAFs.
- Improving soil has been done on the Otter Study Area.
The impacts of the NbS scenario have been assessed on groundwater and stream flows.
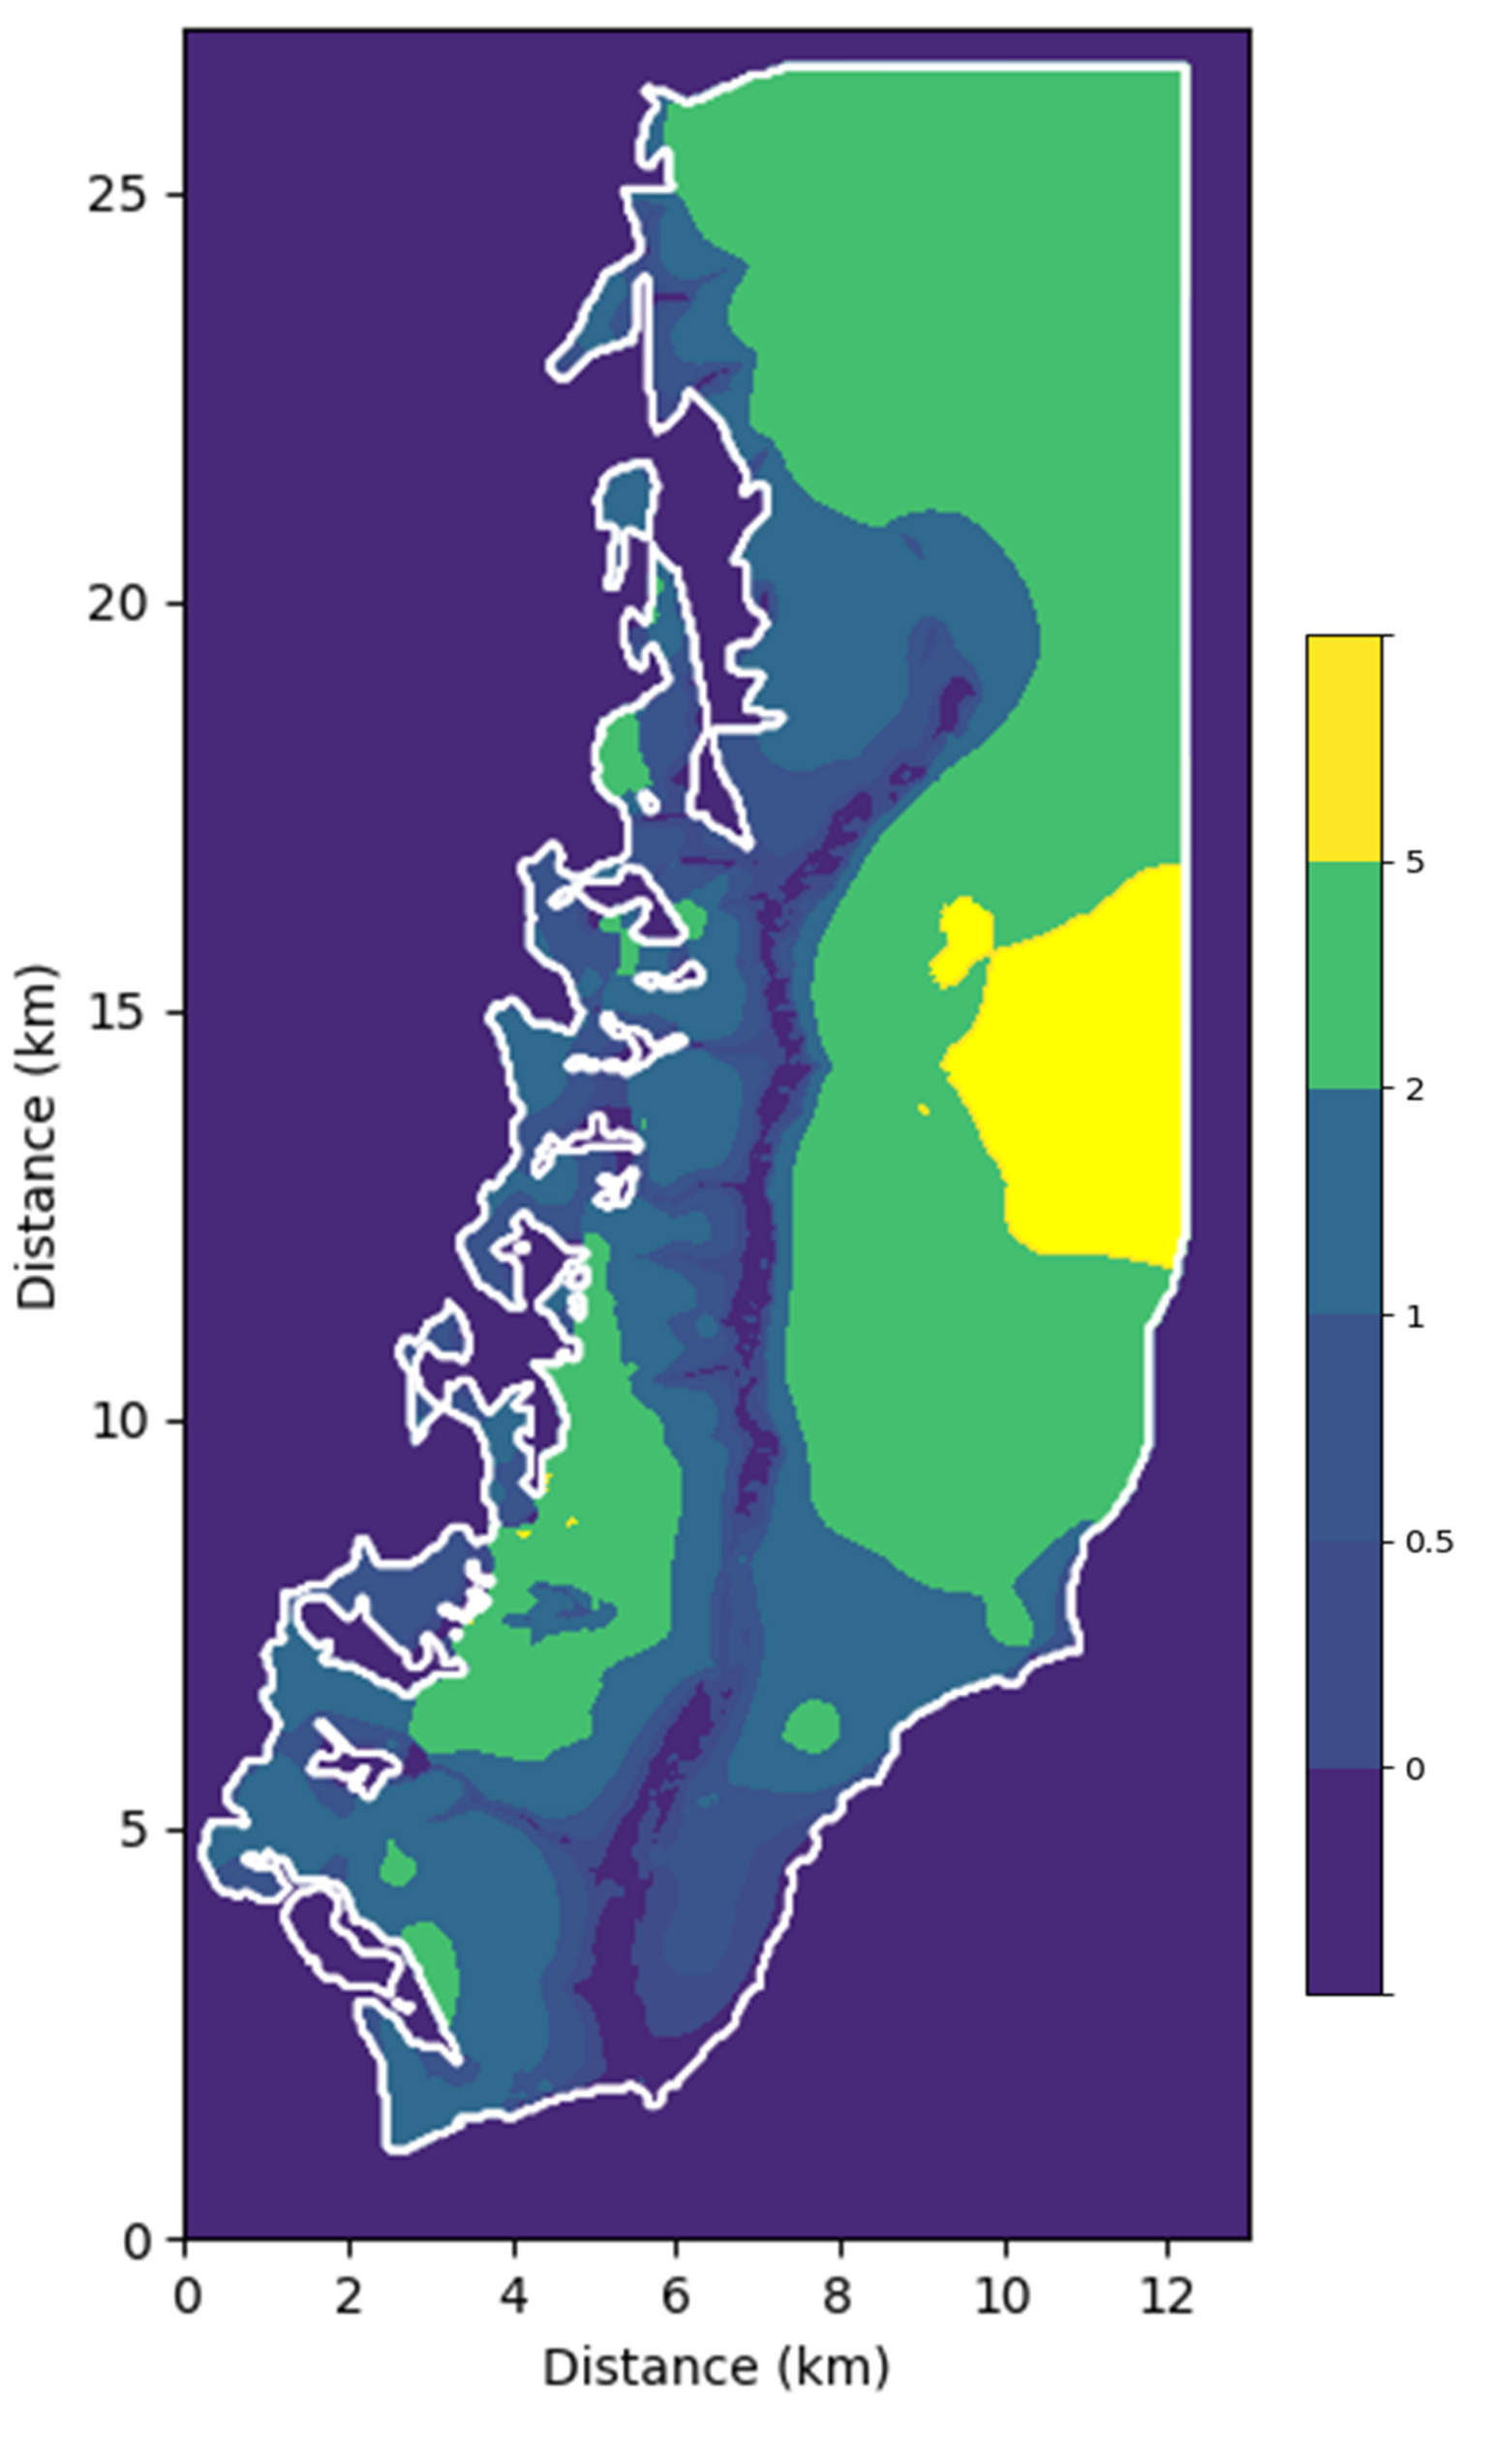
The results of the implementation of combined NbS measures on groundwater show a general steady increase in recharge and water table across the whole Otter Study Area which also results in long-term increases in groundwater storage.
Figure 18 shows the changes in groundwater levels through the combined NbS measures scenario compared to the baseline (no NbS interventions). The largest changes occur away from the Otter valley floor. The river acts as a boundary, which dampens the range of groundwater movement, and the flat, low-lying topography of the valley floor means there is less unsaturated aquifer into which the water table can rise.
Figure 18: Change in groundwater level in metres with an NbS scenario compared to the baseline in an average year for a 100% uptake scenario
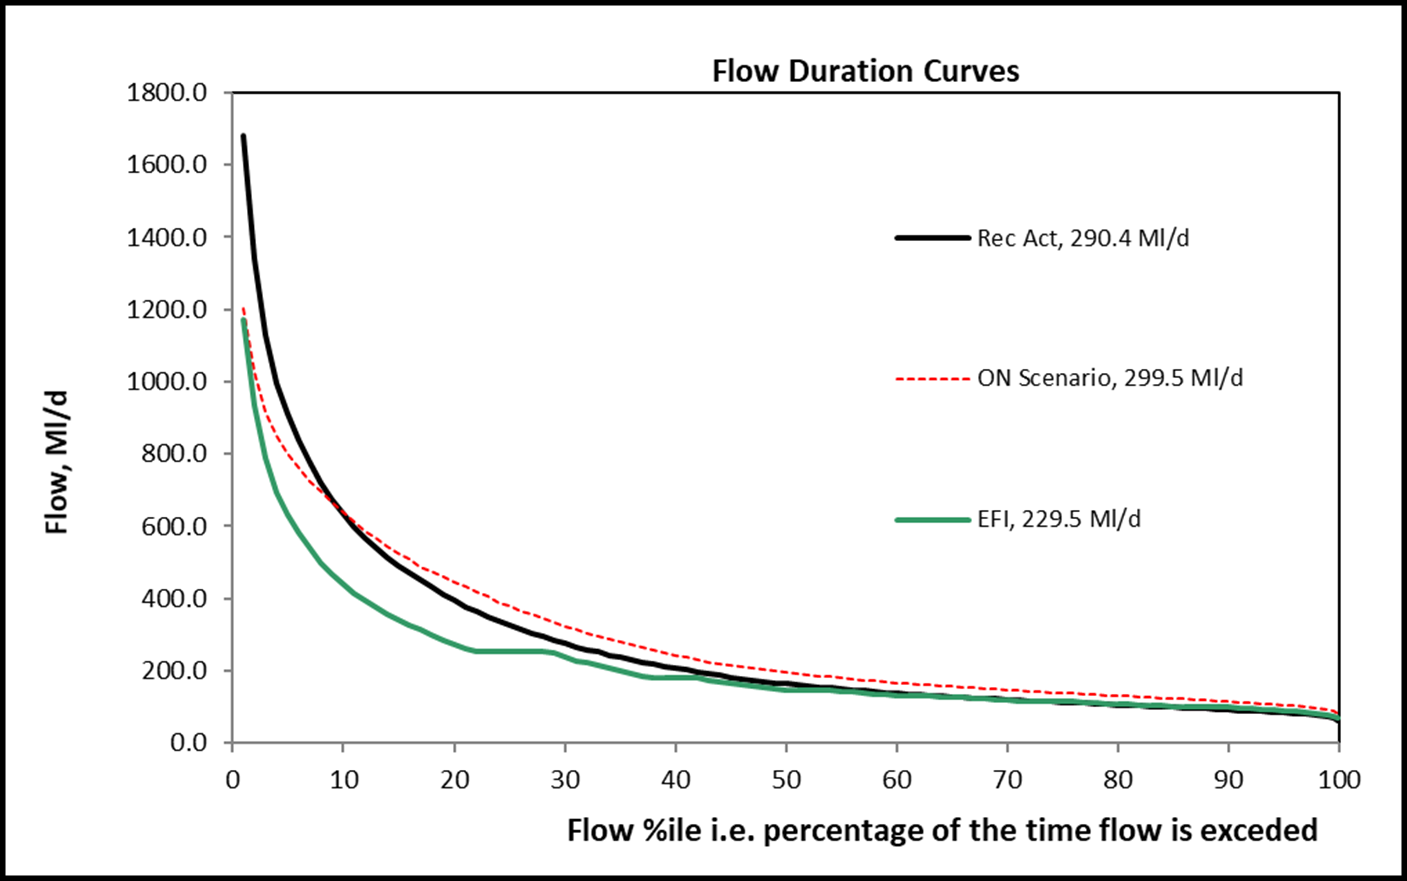
The results of the implementation of combined NbS measures on stream flows show increases in river levels and baseflow to the River Otter and its tributaries and a reduction in the amplitude of river level fluctuations. Figure 19 shows that the implementation of combined NbS measures results in a reduction in peak flows and increases the frequency of low flows, which means reduction in flood frequency and severity. The graph shows NbS scenario (ON Scenario) flows, recent actual model flows and Environmental Flow Indicator (EFI) flow trigger levels. For rivers in England, the Environment Agency uses the EFI to indicate where abstraction, or flow regulation, may start to have an undesirable impact on river habitats and species.
Figure 19: Flow duration curves of the River Otter at Otterton gauging station with implementation of combined NbS measures for a 100% uptake scenario
NbS measures are particularly sensitive to underlying geology and the aquifer system. These case studies showed the applicability of the potential NbS measures in each aquifer system.
For guidance on implementing NbS for water resources outcomes, see our NbS for water resources handbook.