Supplementary data for the 2019 to 2020 National Minimum Wage Enforcement statistics report (web)
Published 24 February 2021

© Crown copyright 2021
This publication is licensed under the terms of the Open Government Licence v3.0 except where otherwise stated. To view this licence, visit nationalarchives.gov.uk/doc/open-government-licence/version/3 or write to the Information Policy Team, The National Archives, Kew, London TW9 4DU, or email: psi@nationalarchives.gov.uk.
Where we have identified any third party copyright information you will need to obtain permission from the copyright holders concerned.
This publication is available at https://www.gov.uk/government/publications/national-living-wage-and-national-minimum-wage-government-evidence-on-compliance-and-enforcement-201920/supplementary-data-for-the-201920-national-minimum-wage-enforcement-statistics-report-web
The tables and figures below correspond with references used in the 2019/20 National Minimum Wage Enforcement statistics summary report.
Table 1: minimum wage investigations summary, 2009/10 to 2019/20
| Financial Year | HMRC enforcement budget | Opened cases | Closed cases | Closed cases with arrears | Strike rate | Arrears | SCCS Arrears | Total Arrears | |
|---|---|---|---|---|---|---|---|---|---|
| 2009/10 | n/a | 3,643 | 1,256 | 34% | £4,390,023 | £0 | £4,390,023 | ||
| 2010/11 | n/a | 2,901 | 1,140 | 39% | £3,818,396 | £0 | £3,818,396 | ||
| 2011/12 | n/a | 2,534 | 968 | 38% | £3,582,685 | £0 | £3,582,685 | ||
| 2012/13 | n/a | 1,696 | 736 | 43% | £3,974,008 | £0 | £3,974,008 | ||
| 2013/14 | n/a | 1,455 | 680 | 47% | £4,645,547 | £0 | £4,645,547 | ||
| 2014/15 | £9,200,000 | 2,328 | 2,204 | 735 | 33% | £3,291,529 | £0 | £3,291,529 | |
| 2015/16 | £13,200,000 | 3,246 | 2,667 | 958 | 36% | £10,281,396 | £0 | £10,281,396 | |
| 2016/17 | £20,000,000 | 2,775 | 2,674 | 1,134 | 42% | £10,918,047 | £0 | £10,918,047 | |
| 2017/18 | £25,300,000 | 3,975 | 2,402 | 1,016 | 42% | £15,615,609 | £0 | £15,615,609 | |
| 2018/19 | £26,200,000 | 2,823 | 3,018 | 1,357 | 45% | £18,372,007 | £6,075,912 | £24,447,919 | |
| 2019/20* | £26,300,000 | 3,576 | 3,376** | 1,260 | 42%*** | £20,581,253 | £255,356 | £20,836,609 |
Table 1 (continued)
| Financial Year | Workers | Average number of workers per case | Average arrears per worker | Average arrears per case | Number of penalties Issued | Total value of Penalties | Average penalty amount |
|---|---|---|---|---|---|---|---|
| 2009/10 | 19,245 | 5 | £228 | £1,205 | 381 | £111,183 | £292 |
| 2010/11 | 22,919 | 8 | £167 | £1,316 | 934 | £520,568 | £557 |
| 2011/12 | 17,371 | 7 | £206 | £1,414 | 906 | £766,807 | £846 |
| 2012/13 | 26,519 | 16 | £150 | £2,343 | 708 | £776,517 | £1,097 |
| 2013/14 | 22,610 | 16 | £205 | £3,193 | 652 | £815,269 | £1,250 |
| 2014/15 | 26,318 | 12 | £125 | £1,493 | 705 | £934,660 | £1,326 |
| 2015/16 | 58,080 | 22 | £177 | £3,855 | 815 | £1,780,500 | £2,185 |
| 2016/17 | 98,150 | 37 | £111 | £4,083 | 821 | £3,892,381 | £4,741 |
| 2017/18 | 201,785 | 84 | £77 | £6,501 | 810 | £14,070,621 | £17,371 |
| 2018/19 | 221,581 | 73 | £110 | £8,101 | 1,008 | £17,134,737 | £16,999 |
| 2019/20* | 263,350 | 78 | £79 | £6,172 | 992 | £18,453,289 | £18,602 |
Source: BEIS/HMRC enforcement data
Notes
-
Arrears from the Social Care Compliance Scheme (SCCS) are included in this table
-
Between 2005/06 and 2009/10, there were 21,208 investigations, which found arrears of £19,094,334 for 101,259 workers. 753 penalties were issued.
-
Opened cases data is not currently available on a consistent basis for 2009/10 to 2013/14.
-
An additional 30 cases were originally closed in 2015/16 but the employer notified HMRC of additional arrears in 2016/17. The arrears in these cases are included in the arrears total for 2016/17.
-
There are an additional 11 cases originally closed prior to 2018/19 which notified further arrears in 2018/19. These cases are included in the arrears total for 2018/19.
*There are an additional 8 cases originally closed prior to 2019/20 which notified further arrears in 2019/20. These cases are included in the arrears total for 2019/20.
**3,376 closed investigations include 2,899 closed enforcement cases plus 80 New Small Business cases with arrears. It also includes 397 New Small Business cases where an educational approach was taken and no arrears were identified.
***The strike rate for 2019/20 comprises 1,180 closed investigations with arrears plus 80 New Small Business (NSB) cases where arrears were due.
Figure 1a. Minimum wage investigations: arrears and workers identified (2009/10 - 2019/20)
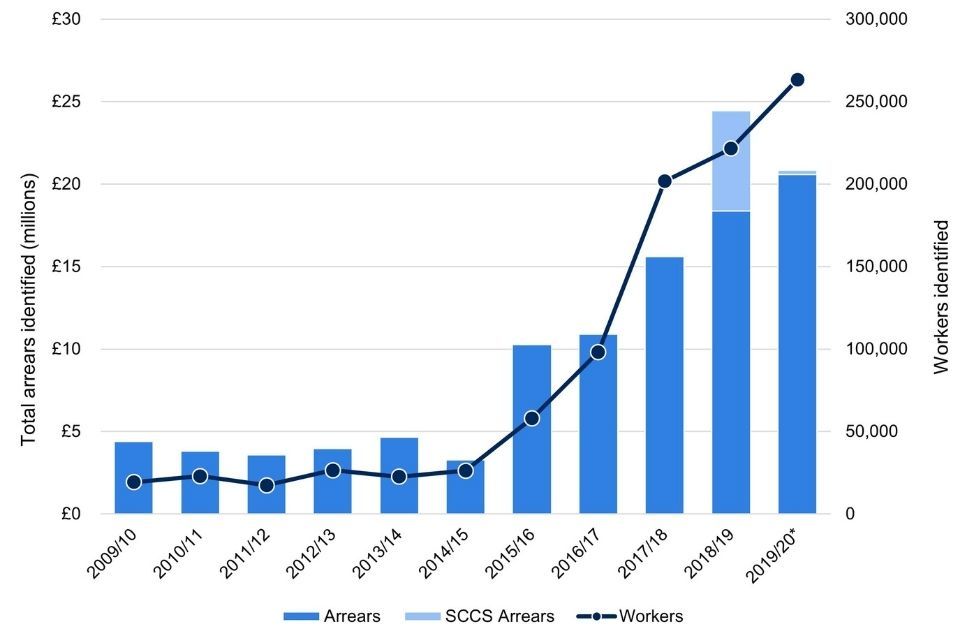
This graph shows the number of workers and arrears identified in each financial year, from 2009/10, to 2019/20.
Source: BEIS/HMRC enforcement data
Notes
-
An additional 30 cases were originally closed in 2015/16 but the employer notified HMRC of additional arrears in 2016/17. The arrears in these cases are included in the arrears total for 2016/17.
-
There are an additional 11 cases originally closed prior to 2018/19 which notified further arrears in 2018/19. These cases are included in the arrears total for 2018/19.
*There are an additional 8 cases originally closed prior to 2019/20 which notified further arrears in 2019/20. These cases are included in the arrears total for 2019/20.
Figure 1b: Minimum wage investigations: arrears identified and penalties issued compared to HMRC enforcement budget (2014/15 to 2019/20)
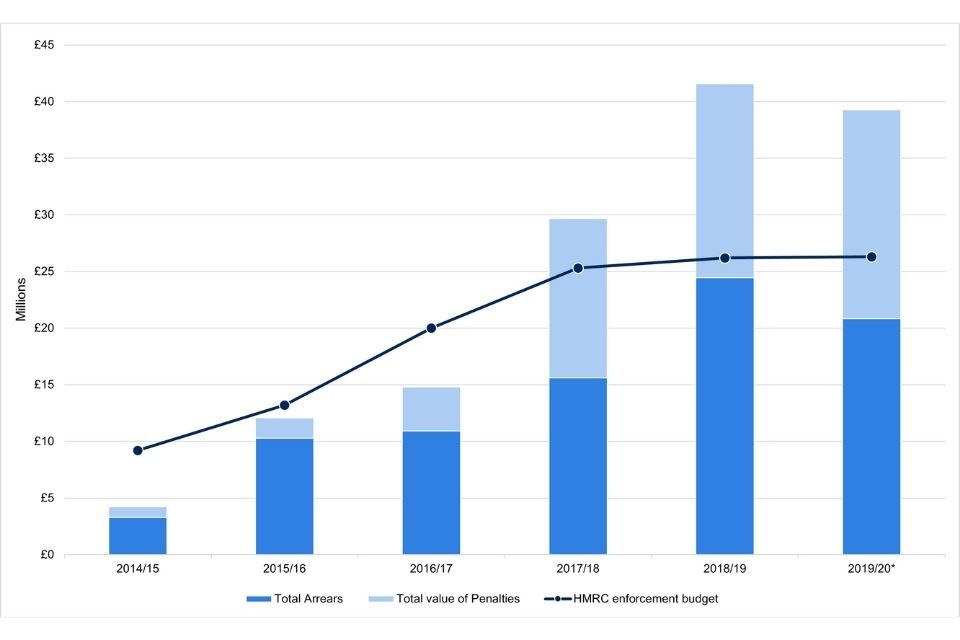
Source: BEIS/HMRC enforcement data
Notes
-
An additional 30 cases were originally closed in 2015/16 but the employer notified HMRC of additional arrears in 2016/17. The arrears in these cases are included in the arrears total for 2016/17.
-
There are an additional 11 cases originally closed prior to 2018/19 which notified further arrears in 2018/19. These cases are included in the arrears total for 2018/19.
-
Arrears from the Social Care Compliance Scheme (SCCS) are included in this graph.
*There are an additional 8 cases originally closed prior to 2019/20 which notified further arrears in 2019/20. These cases are included in the arrears total for 2019/20.
Figure 1c: Minimum wage investigations: average arrears per case and per worker (2009/10 to 2019/20)
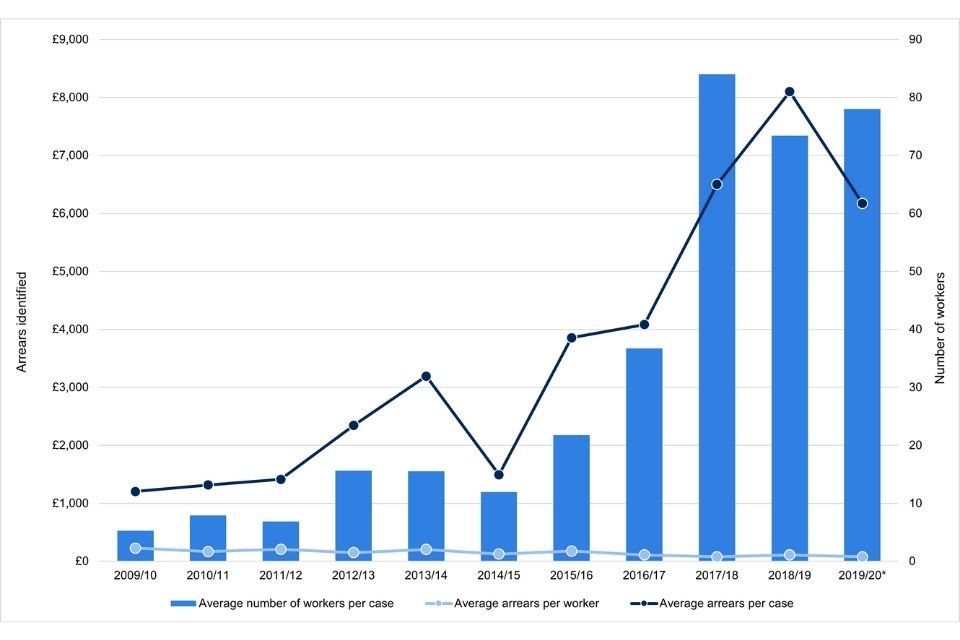
Source: BEIS/HMRC enforcement data
Notes
-
Arrears from the Social Care Compliance Scheme (SCCS) are included in this graph.
-
An additional 30 cases were originally closed in 2015/16 but the employer notified HMRC of additional arrears in 2016/17. The arrears in these cases are included in the arrears total for 2016/17.
-
There are an additional 11 cases originally closed prior to 2018/19 which notified further arrears in 2018/19. These cases are included in the arrears total for 2018/19
*There are an additional 8 cases originally closed prior to 2019/20 which notified further arrears in 2019/20. These cases are included in the arrears total for 2019/20.
Table 2: Minimum wage investigations: arrears and workers identified, by banded arrears per case (2017/18 - 2019/20)
Financial year: 2017 to 2018
| Arrears per case | Closed cases with arrears | Arrears | Workers |
|---|---|---|---|
| £1 - £100 | 164 | £7,796 | 291 |
| £101 - £500 | 251 | £71,661 | 1,229 |
| £501 - £1000 | 132 | £94,780 | 1,122 |
| £1,001 - £5000 | 307 | £713,467 | 3,931 |
| £5,001 - £10,000 | 79 | £555,978 | 2,699 |
| £10,001 - £20,000 | 51 | £742,650 | 4,298 |
| £20,001 - £50,000 | 36 | £1,104,611 | 7,771 |
| £50,001 - £100,000 | 16 | £1,157,420 | 6,208 |
| £100,000+ | 10 | £11,167,246 | 174,236 |
| Total | 1,046* | £15,615,609 | 201,785 |
Financial year: 2018 to 2019
| Arrears per case | Closed cases with arrears | Arrears | Workers |
|---|---|---|---|
| £1 - £100 | 180 | £7,911 | 383 |
| £101 - £500 | 302 | £83,947 | 1,423 |
| £501 - £1000 | 166 | £118,773 | 1,670 |
| £1,001 - £5000 | 384 | £893,120 | 8,365 |
| £5,001 - £10,000 | 124 | £921,590 | 6,693 |
| £10,001 - £20,000 | 83 | £1,172,741 | 8,174 |
| £20,001 - £50,000 | 72 | £2,214,044 | 16,042 |
| £50,001 - £100,000 | 23 | £1,649,779 | 15,186 |
| £100,000+ | 34 | £17,386,014 | 163,645 |
| Total | 1368** | £24,447,919 | 221,581 |
Financial year: 2019 to 2020
| Arrears per case | Closed cases with arrears | Arrears | Workers |
|---|---|---|---|
| £1 - £100 | 232 | £9,437 | 494 |
| £101 - £500 | 278 | £71,191 | 1,129 |
| £501 - £1000 | 166 | £116,841 | 1,175 |
| £1,001 - £5000 | 297 | £680,587 | 4,641 |
| £5,001 - £10,000 | 103 | £717,724 | 9,169 |
| £10,001 - £20,000 | 77 | £1,058,016 | 23,526 |
| £20,001 - £50,000 | 52 | £1,597,830 | 13,981 |
| £50,001 - £100,000 | 30 | £2,120,576 | 35,111 |
| £100,000+ | 33 | £14,464,407 | 174,124 |
| Total | 1,268*** | £20,836,609 | 263,350 |
Source: BEIS/HMRC enforcement data.
Notes
*An additional 30 cases were originally closed prior to 2017/18 but the employer notified HMRC of additional arrears in 2017/18. The arrears in these cases are included in the arrears total for 2017/18.
**An additional 11 cases were originally closed prior to 2018/19 but the employer notified HMRC of additional arrears in 2018/19. The arrears in these cases are included in the arrears total for 2018/19.
***An additional 8 cases were originally closed prior to 2019/20 but the employer notified HMRC of additional arrears in 2019/20. The arrears in these cases are included in the arrears total for 2019/20.
Table 3: Minimum wage investigations: highest value of arrears and penalties (2009/10 - 2019/20)
| Financial year | Highest value of arrears for single worker | Number of cases where individual worker due arrears greater than £20,000 | Highest value of arrears in single case | Number of workers covered in that case | Highest value of penalty issued to single employer | Number of cases where single employer issued with a penalty greater than £500,000 | Number of cases where single employer issued with a penalty greater than £1,000,000 |
|---|---|---|---|---|---|---|---|
| 2009/10 | n/a | 0 | £724,445 | 250 | £5,000 | 0 | 0 |
| 2010/11 | n/a | 0 | £211,065 | 471 | £5,000 | 0 | 0 |
| 2011/12 | n/a | 0 | £400,761 | 651 | £5,000 | 0 | 0 |
| 2012/13 | n/a | 0 | £690,980 | 114 | £5,000 | 0 | 0 |
| 2013/14 | £11,243 | 0 | £653,491 | 2,869 | £7,050 | 0 | 0 |
| 2014/15 | £20,857 | 1 | £314,789 | 10,049 | £19,535 | 0 | 0 |
| 2015/16 | £14,532 | 0 | £4,199,574 | 9,241 | £538,704 | 1 | 0 |
| 2016/17 | £29,715 | 2 | £2,407,501 | 29,424 | £1,465,661 | 1 | 1 |
| 2017/18 | £53,625 | 4 | £7,707,428 | 118,899 | £8,505,931 | 2 | 1 |
| 2018/19 | £29,845 | 3 | £2,265,327 | 3,000 | £2,265,327 | 7 | 5 |
| 2019/20 | £44,323 | 11 | £2,238,351 | 11,594 | £1,470,098 | 7 | 3 |
| Total | 21 | 18 | 10 |
Source: BEIS/HMRC enforcement data.
Notes
The highest value for a single worker in 2018/19 was a SCCS case, which settled before the Mencap judgement.
There were 7 workers who received arrears in excess of £20,000. One of these workers received £113,000. This has been excluded from the figures for the highest, and number of cases with a worker with over £20,000.
Table 4: Minimum wage investigations by sector (2019/20)
| Sector classification (SIC2007) | Sector name | Closed cases | Closed cases with arrears | Strike-rate | Arrears (£) | Workers | Number of all jobs paid below minimum wage | Proportion of jobs in that sector |
|---|---|---|---|---|---|---|---|---|
| A | Agriculture, Forestry and Fishing | 35 | 15 | 43% | £101,112 | 281 | 4,700 | 2% |
| B | Mining and Quarrying | 3 | 1 | 33% | - | - | 0 | 0% |
| C | Manufacturing | 175 | 71 | 41% | £1,845,327 | 13,635 | 18,900 | 1% |
| D | Electricity, Gas, Steam and Air Conditioning supply | 6 | 2 | 33% | £1,039 | 3 | 200 | 0% |
| E | Water supply; Sewerage; Waste Management and Remediation activities | 23 | 8 | 35% | £6,556 | 62 | 1,500 | 1% |
| F | Construction | 72 | 44 | 61% | £134,588 | 178 | 6,400 | 1% |
| G | Wholesale and Retail Trade; repair of motor vehicles and motorcycles | 439 | 185 | 42% | £5,701,108 | 69,811 | 54,900 | 2% |
| H | Transportation and Storage | 105 | 34 | 32% | £450,496 | 2,126 | 8,000 | 1% |
| I | Accommodation and Food Service Activities | 769 | 312 | 41% | £3,197,483 | 62,212 | 35,300 | 10% |
| 55. Accomodation | 183 | 92 | 50% | £888,233 | 8,659 | 6,600 | 7% | |
| 56. Food and beverage service activities | 586 | 220 | 38% | £2,309,250 | 53,553 | 28,700 | 11% | |
| J | Information and Communication | 38 | 13 | 34% | £410,209 | 8,516 | 5,600 | 1% |
| K | Financial and Insurance Activities | 10 | 1 | 10% | - | - | 3,500 | 0% |
| L | Real Estate Activities | 26 | 10 | 38% | £28,922 | 59 | 3,500 | 1% |
| M | Professional, Scientific and Technical Activities | 79 | 32 | 41% | £565,797 | 11,588 | 19,200 | 1% |
| N | Administrative and Support Service Activities | 533 | 199 | 37% | £2,016,915 | 34,973 | 32,900 | 3% |
| 77. Rental and leasing activities | 8 | 4 | 50% | £398,479 | 3,160 | 1,000 | 1% | |
| 78. Employment activities | 126 | 45 | 36% | £735,420 | 18,090 | 5,300 | 1% | |
| 79. Travel agency, tour operator and other reservation service and related activities | 7 | 3 | 43% | £8,595 | 10 | 800 | 3% | |
| 80. Security and investgation activities | 29 | 10 | 34% | £83,043 | 1,053 | 1,000 | 1% | |
| 81. Services to buildings and landscape activities | 286 | 105 | 37% | £531,516 | 7,626 | 17,600 | 5% | |
| 82. Office administrative, office support and other business support activities | 77 | 32 | 42% | £259,862 | 5,034 | 7,000 | 3% | |
| O | Public Administration and Defence; Compulsory Security | 11 | 6 | 55% | £80,254 | 430 | 7,500 | 0% |
| P | Education | 71 | 46 | 65% | £410,162 | 485 | 67,800 | 2% |
| Q | Human Health and Social Work Activities | 149 | 100 | 67% | £738,114 | 3,986 | 63,100 | 1% |
| 86. Human health activities | 34 | 21 | 62% | £164,295 | 289 | 20,800 | 1% | |
| 87. Residential care activities | 46 | 36 | 78% | £265,576 | 2,065 | 22,700 | 3% | |
| 88. Social work activities without accommodation | 69 | 43 | 62% | £308,243 | 1,632 | 19,600 | 3% | |
| R | Arts, Entertainment and Recreation | 110 | 42 | 38% | £3,098,623 | 26,456 | 6,300 | 3% |
| S | Other Service Activities | 320 | 138 | 43% | £731,896 | 2,342 | 7,600 | 2% |
| T | Activities of Households as Employers; Undifferentiated Goods and Services; Producing Activities of Households for own use | 5 | 1 | 20% | - | - | - | - |
| U | Activities of Extraterritorial Organisations and Bodies | - | - | - | - | - | - | - |
| Total | 2,979 | 1,260 | 42% | £19,558,521 | 237,288 | 347,000 | 1.5% |
Source: BEIS/HMRC enforcement data.
Notes
-
The number of jobs paid at or below the minimum wage is calculated using the ONS’ 2020 Annual Survey of Hours and Earnings (ASHE). This covers underpayment across all minimum wage rates.
-
ASHE estimates of jobs paid below the minimum wage have been rounded to the nearest 100. Figures do not sum to total underpayment because of this rounding.
-
The figures shown exclude furloughed workers, and are therefore an underestimate of non-compliance. For more detail, please see “Measuring non-compliance with the minimum wage” in the accompanying report.
-
Caution is advised in making direct comparisons between ASHE data and HMRC enforcement statistics. ASHE data is based on a snapshot of pay and hours in April 2020 and assesses pay for a single pay reference period. HMRC enforcement statistics refer to arrears and workers identified across the entire reporting year and may refer to underpaid wages dating back 6 years.
-
This table uses Standard Industrial Classifications (SIC 2007) codes from ASHE 2020, and uses those paid within 5 pence of the relevant minimum wage rate.
-
‘-’ indicates a number that has been suppressed to protect low employer self-identification, or because there is no data available for this entry.
*This table excludes the 8 cases that were closed prior to 2019/20, but where the employer notified HMRC of additional arrears in 2019/20. The arrears and workers from these cases have been included in Table 7.
Table 5: Minimum wage investigations by workplace region (2019/20)
| Region | Number of all jobs paid below minimum wage | % of all jobs | Closed cases | % of all cases closed | Closed cases with arrears | Strike rate | Arrears | % of all arrears identified | Workers | % of all workers identified | Penalties Issued | Value of Penalties |
|---|---|---|---|---|---|---|---|---|---|---|---|---|
| East Midlands | 26,000 | 1.7% | 260 | 8.7% | 110 | 42% | £920,686 | 4.7% | 14,104 | 5.9% | 86 | £1,078,352 |
| East of England | 37,000 | 1.7% | 160 | 5.4% | 63 | 39% | £318,978 | 1.6% | 4,087 | 1.7% | 53 | £468,414 |
| London | 31,000 | 0.9% | 338 | 11.3% | 132 | 39% | £3,298,935 | 16.9% | 42,917 | 18.1% | 111 | £2,957,983 |
| North East | 18,000 | 2.2% | 162 | 5.4% | 77 | 48% | £488,737 | 2.5% | 7,053 | 3.0% | 67 | £603,902 |
| North West | 39,000 | 1.6% | 408 | 13.7% | 167 | 41% | £990,443 | 5.1% | 7,320 | 3.1% | 125 | £1,079,652 |
| Northern Ireland | - | - | 115 | 3.9% | 56 | 49% | £111,142 | 0.6% | 982 | 0.4% | 35 | £168,807 |
| Scotland | 26,000 | 1.2% | 317 | 10.6% | 133 | 42% | £1,059,811 | 5.4% | 10,161 | 4.3% | 112 | £1,268,265 |
| South East | 47,000 | 1.3% | 303 | 10.2% | 136 | 45% | £5,336,820 | 27.3% | 43,287 | 18.2% | 100 | £4,455,592 |
| South West | 36,000 | 1.9% | 208 | 7.0% | 92 | 44% | £1,135,793 | 5.8% | 13,849 | 5.8% | 70 | £963,123 |
| Wales | 16,000 | 1.5% | 134 | 4.5% | 60 | 45% | £325,419 | 1.7% | 4,227 | 1.8% | 41 | £379,442 |
| West Midlands | 28,000 | 1.5% | 309 | 10.4% | 116 | 38% | £4,164,947 | 21.3% | 71,047 | 29.9% | 91 | £3,286,439 |
| Yorkshire and the Humber | 35,000 | 1.9% | 260 | 8.7% | 116 | 45% | £1,382,911 | 7.1% | 18,034 | 7.6% | 100 | £1,738,243 |
| Other | - | - | 2 | 0.1% | 0 | 0% | - | - | - | - | - | - |
| Unknown | - | - | 3 | 0.1% | 2 | 67% | £23,899 | 0.1% | 220 | 0.1% | 1 | £5,075 |
| Total | 339,000 | 1.5% | 2,979 | 1,260 | 42% | £19,558,521 | 237,288 | 992 | £18,453,289 |
Source: BEIS / HMRC enforcement data and BEIS analysis of Annual Survey of Hours and Earnings (ASHE) 2020.
Notes
-
Figures from ASHE are rounded to the nearest thousand.
-
This covers underpayment across all minimum wage rates.
- Estimates of the number (and percentage) of jobs paid below the minimum wage in Northern Ireland have not been included due to small sample sizes in ASHE.
-
The figures shown exclude furloughed workers, and are therefore an underestimate of non-compliance. For more detail, please see “Measuring non-compliance with the minimum wage” in the accompanying report.
-
Caution is advised in making direct comparisons between ASHE data and HMRC enforcement statistics. ASHE data is based on a snapshot of pay and hours in April 2020 and assesses pay for a single pay reference period.
-
Regional trends may be the result of differences in the concentration of employers across the UK or in the sector composition within a region - for example a region with a large number of employers in low-pay sectors will drive investigations in that region.
-
Furthermore, these figures combine complaint-led and targeted enforcement work and there may be a different pattern when these breakdowns are considered separately.
-
3,376 closed investigations include 2,899 closed enforcement cases plus 80 New Small Business cases with arrears. It also includes 397 New Small Business cases where an educational approach was taken and no arrears were identified.
- This table excludes the 8 cases that were closed prior to 2019/20, but where the employer notified HMRC of additional arrears in 2019/20. The arrears and workers from these cases have been included in Table 1
-
The strike rate for 2019/20 comprises 1,180 closed investigations with arrears plus 80 New Small Business (NSB) cases where arrears were due.
-
Geography information is based on employer address postcode (trading address). In some cases, this may be where the minimum wage underpayment occurred.
-
BEIS linked postcodes to the National Statistics Postcode Lookup file for May 2020 to identify Government Office Regions.
- The ‘Other’ region includes the Channel Islands and Isle of Man.
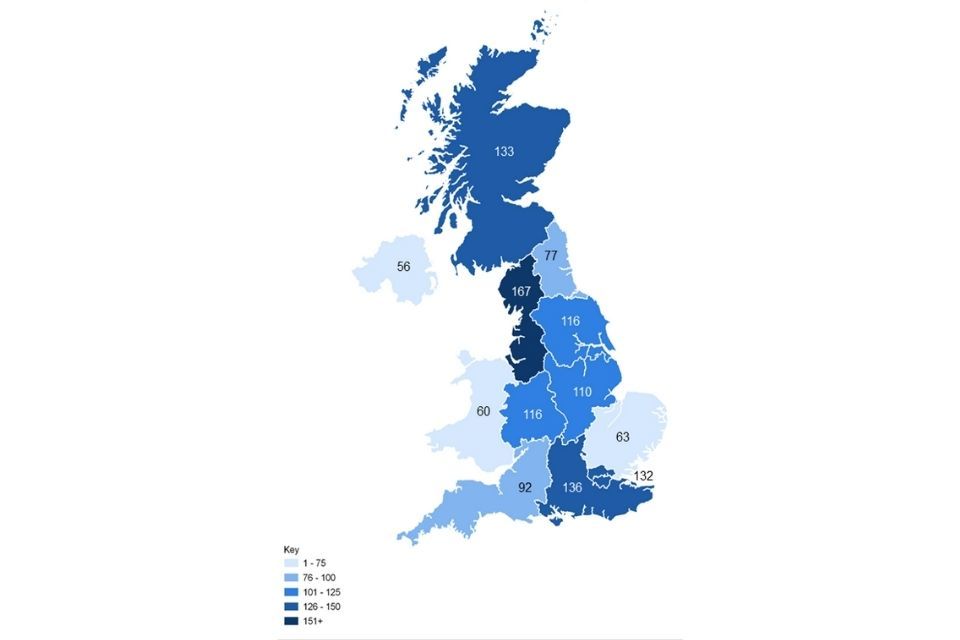
Figure 5a: Minimum wage cases closed (2019 to 2020)
Notes
Geography information is based on employer address postcode (trading address). In some cases, this may be where the minimum wage underpayment occurred.
Figures in the millions are rounded to the nearest one hundred thousand (£X.Xm), and may therefore differ to the figures provided in Table 5 in the accompanying Excel data.
Contains National Statistics Data© Crown Copyright and Database Right 2018.
Source: BEIS/HMRC enforcement data
Figure 5b: Minimum wage cases closed with arrears identified (2019 to 2020)
Notes
Geography information is based on employer address postcode (trading address). In some cases, this may be where the minimum wage underpayment occurred.
Figures in the millions are rounded to the nearest one hundred thousand (£X.Xm), and may therefore differ to the figures provided in Table 5 in the accompanying Excel data.
Contains National Statistics Data© Crown Copyright and Database Right 2018.
Source: BEIS/HMRC enforcement data
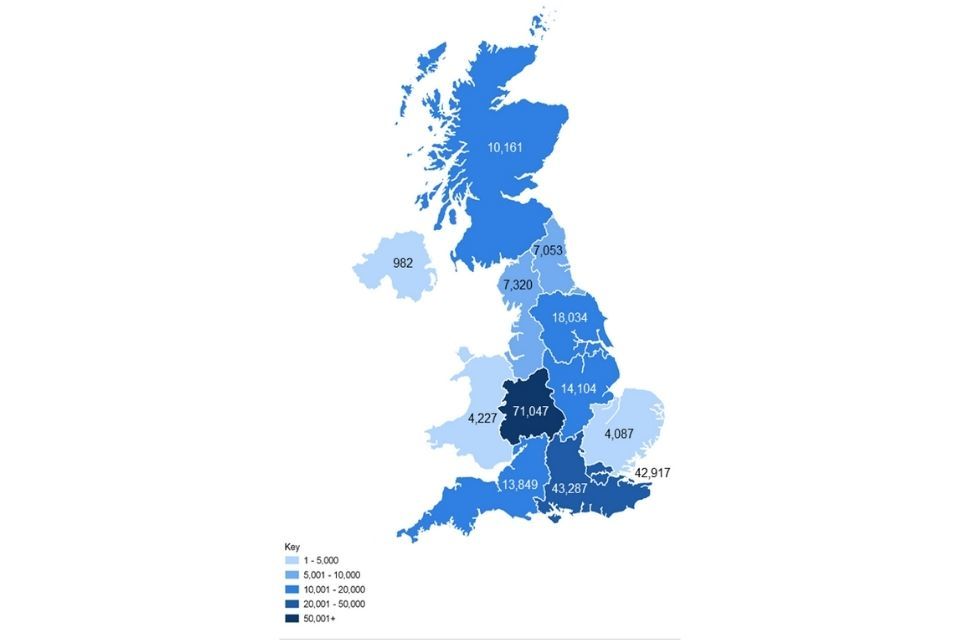
Figure 5c: Total workers identified (2019 to 2020)
Notes
Geography information is based on employer address postcode (trading address). In some cases, this may be where the minimum wage underpayment occurred.
Figures in the millions are rounded to the nearest one hundred thousand (£X.Xm), and may therefore differ to the figures provided in Table 5 in the accompanying Excel data.
Contains National Statistics Data© Crown Copyright and Database Right 2018.
Source: BEIS/HMRC enforcement data.
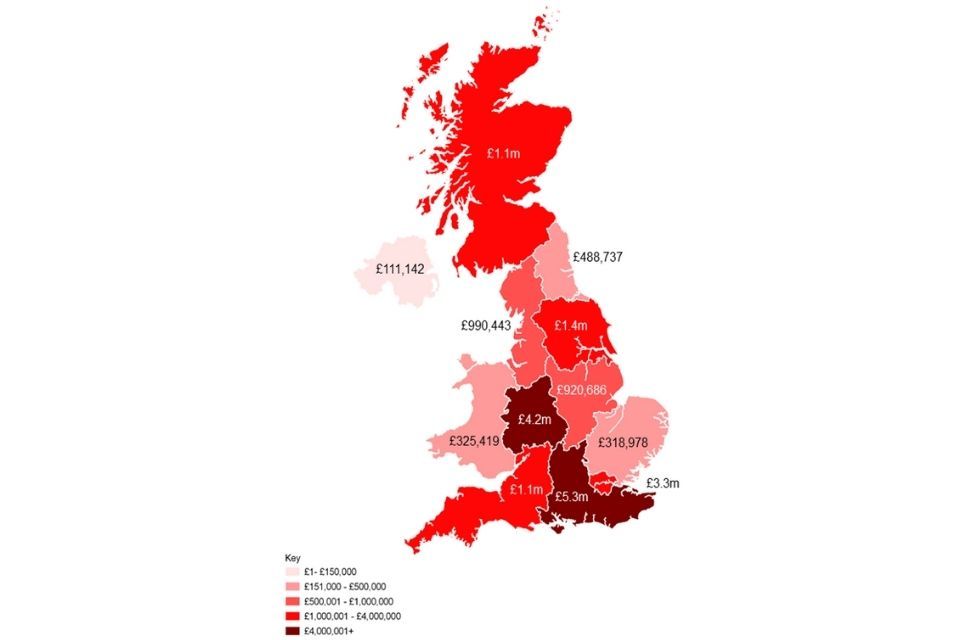
Figure 5d: Total minimum wage arrears identified (2019 to 2020)
Notes
Geography information is based on employer address postcode (trading address). In some cases, this may be where the minimum wage underpayment occurred.
Figures in the millions are rounded to the nearest one hundred thousand (£X.Xm), and may therefore differ to the figures provided in Table 5 in the accompanying Excel data.
Contains National Statistics Data© Crown Copyright and Database Right 2018.
Source: BEIS/HMRC enforcement data.
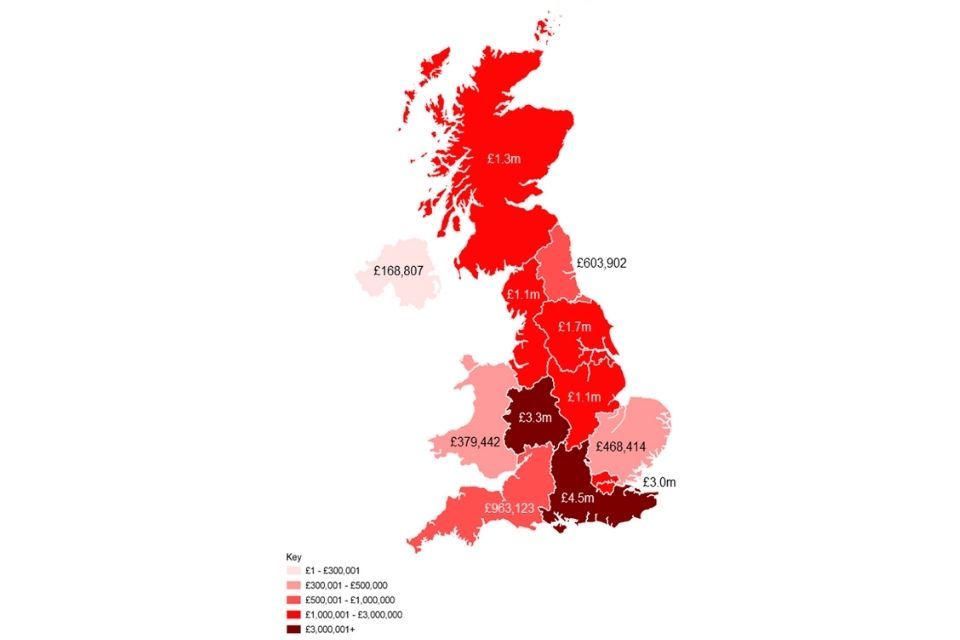
Figure 5e: Minimum wage penalties issued (2019 to 2020)
Notes
Geography information is based on employer address postcode (trading address). In some cases, this may be where the minimum wage underpayment occurred.
Figures in the millions are rounded to the nearest one hundred thousand (£X.Xm), and may therefore differ to the figures provided in Table 5 in the accompanying Excel data.
Contains National Statistics Data© Crown Copyright and Database Right 2018.
Source: BEIS/HMRC enforcement data
Table 6: Minimum wage enforcement by gender (2009/10 - 2019/20)
| Financial year | Male workers identified | Female workers identified |
|---|---|---|
| 2009/10 | 9,811 | 9,434 |
| 2010/11 | 10,908 | 12,011 |
| 2011/12 | 8,892 | 8,479 |
| 2012/13 | 11,185 | 15,334 |
| 2013/14 | 10,461 | 12,149 |
| 2014/15 | 6,241 | 20,077 |
| 2015/16 | 25,770 | 32,310 |
| 2016/17 | 37,584 | 60,566 |
| 2017/18 | 79,258 | 122,527 |
| 2018/19 | 90,893 | 130,688 |
| 2019/20 | 114,484 | 148,866 |
| Total | 405,487 | 572,441 |
Source: BEIS/HMRC enforcement data.
Notes
It is not possible to attribute arrears to a particular worker, meaning that arrears figures cannot be split out by gender (therefore these figures can’t be provided).
Table 7a: Targeted Minimum Wage investigations (2014/15 - 2019/20)
| Financial Year | Opened cases | Closed cases | Closed cases with arrears | Strike rate | Arrears | Average arrears per closed case | Workers | Penalties Issued | Value of Penalties |
|---|---|---|---|---|---|---|---|---|---|
| 2014/15 | 106 | 151 | 60 | 40% | £579,385 | £9,656 | 5,247 | 49 | £127,367 |
| 2015/16 | 2,009 | 1,091 | 206 | 19% | £6,984,043 | £33,903 | 43,486 | 133 | £733,716 |
| 2016/17 | 1,259 | 1,473 | 494 | 34% | £5,181,343 | £10,489 | 68,290 | 368 | £2,534,618 |
| 2017/18 | 1,603 | 994 | 392 | 39% | £3,800,083 | £9,694 | 64,453 | 332 | £3,416,736 |
| 2018/19 | 1,506 | 1,665 | 609 | 37% | £9,936,606 | £16,316 | 96,577 | 516 | £8,890,792 |
| 2019/20 | 2,505 | 2,197 | 681 | 38% | £15,829,949 | £23,245.15 | 212,499 | 512 | £13,661,856 |
Source: BEIS/HMRC enforcement data
Notes
2,197 closed investigations include 1,720 closed enforcement cases plus 80 New Small Business cases with arrears. It also includes 397 New Small Business cases where an educational approach was taken and no arrears were identified. These New Small Business cases are excluded from the strike rate calculation
The strike rate for 2019/20 comprises 601 closed investigations with arrears plus 80 New Small Business (NSB) cases where arrears were due.
Table 7b. Source of targeted Minimum Wage investigations (2015/16 to 2019/20)
| Financial Year | BEIS Priority | Risk-Model | Third Party Intelligence | Other |
|---|---|---|---|---|
| 2015/16 | Unknown | N/A | 536 | 1,473 |
| 2016/17 | 593 | 344 | 350 | 565 |
| 2017/18 | 818 | 608 | 390 | 605 |
| 2018/19 | 649 | 441 | 382 | 683 |
| 2019/20 | - | 1,115 | 341 | 1,049 |
Source: BEIS/HMRC enforcement data
Notes
-
This table summarises targeted enforcement cases opened by HMRC in each financial year
-
Third Party Intelligence (TPI) are cases opened under a TPI PID
-
The Risk Model was not in operation prior to 2016-17. TE cases were identified using a more manual process of HMRC system analysis
-
BEIS Priority Sector cases can be sourced from either the Risk Model, TPI or Other
-
BEIS Priority Sectors introduced from 2016/17 and NMW Risk Model/Risk Strategy inform priority areas from 19/20
Table 8a. Complaint-led minimum wage investigations (2014/15 to 2019/20)
| Financial Year | Opened cases | Closed cases | Closed cases with arrears | Strike rate |
|---|---|---|---|---|
| 2014/15 | 2,222 | 2,053 | 675 | 33% |
| 2015/16 | 1,237 | 1,576 | 752 | 48% |
| 2016/17 | 1,516 | 1,201 | 640 | 53% |
| 2017/18 | 2,372 | 1,408 | 624 | 44% |
| 2018/19 | 1,317 | 1,353 | 748 | 55% |
| 2019/20 | 1,071 | 1,179 | 579 | 49% |
Table 8a (continued)
| Financial Year | Arrears | Average arrears per closed case | Workers | Penalties Issued | Value of Penalties |
|---|---|---|---|---|---|
| 2014/15 | £2,712,144 | £4,018 | 21,071 | 656 | £807,293 |
| 2015/16 | £3,297,353 | £4,385 | 14,594 | 682 | £1,046,751 |
| 2016/17 | £5,736,704 | £8,964 | 29,860 | 453 | £1,357,763 |
| 2017/18 | £11,815,526 | £18,935 | 137,332 | 478 | £10,653,885 |
| 2018/19 | £14,511,313 | £19,400 | 125,004 | 492 | £8,243,945 |
| 2019/20 | £5,006,660 | £8,647 | 50,851 | 480 | £4,791,433 |
Source: BEIS/HMRC enforcement data
Table 8b. Source of complaint-led Minimum Wage investigations (2015/16 to 2019/20)
| Financial Year | Acas Helpline | Online Complaint Form | Other |
|---|---|---|---|
| 2015/16 | 1,215 | 234 | 67 |
| 2016/17 | 1,863 | 437 | 273 |
| 2017/18 | 1,790 | 4,161 | 76 |
| 2018/19 | 1,034 | 3,808 | 82 |
| 2019/20 | 752 | 2,552 | 28 |
Source: BEIS/HMRC enforcement data
Notes
-
This table summarises contacts received by HMRC in each financial year
-
Some of the contacts received by HMRC will be eliminated at source (i.e. not classified as a Minimum Wage case), so will not progress to investigation
-
Multiple complaints against the same employer will only result in a single investigation.
Table 9: Targeted and complaint-led investigations (2014/15 to 2019/20)
| Targeted investigations | Complaint-led investigations | |||
|---|---|---|---|---|
| Financial Year | Arrears | Workers | Arrears | Workers |
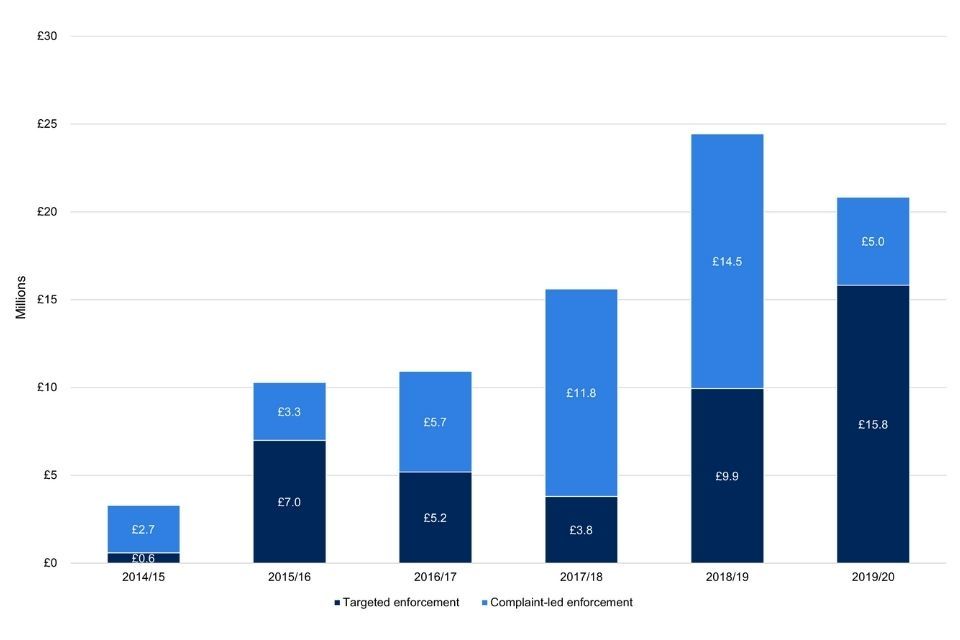
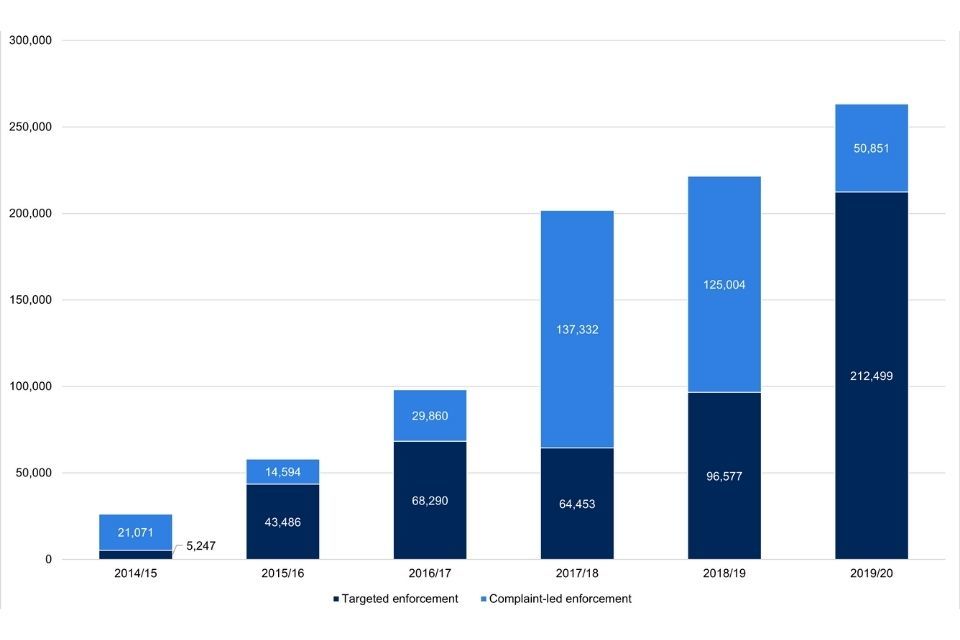
| 2014/15 | £579,385 | 5,247 | £2,712,144 | 21,071 |
| 2015/16 | £6,984,043 | 43,486 | £3,297,353 | 14,594 |
| 2016/17 | £5,181,343 | 68,290 | £5,736,704 | 29,860 |
| 2017/18 | £3,800,083 | 64,453 | £11,815,526 | 137,332 |
| 2018/19 | £9,936,606 | 96,577 | £14,511,313 | 125,004 |
| 2019/20 | £15,829,949 | 212,499 | £5,006,660 | 50,851 |
Source: BEIS/HMRC enforcement data
Figure 9a: Targeted and complaint-led enforcement: arrears identified (2014/15 to 2019/20)
Source: BEIS/HMRC enforcement data
Figure 9b. Targeted and complaint-led enforcement: workers identified (2014/15 to 2019/20)
Source: BEIS/HMRC enforcement data
Table 10: Minimum wage investigations by Notice of Underpayment or Self-Correction (2019/20)
| Enforcement type | Closed cases with arrears | Arrears | Workers | Penalties | |
|---|---|---|---|---|---|
| Total | 1268* | £20,836,609 | 263,350 | £18,453,289 | |
| (A) All arrears within a case assessed by HMRC (captured on NoU) | 894 | £3,209,533 | 20,051 | £4,941,934 | |
| (B) All arrears within a case assessed by self-correction | 220 | £2,370,502 | 30,390 | - | |
| (C) Arrears partly assessed by HMRC and partly by self-correction | 125 | £15,001,218 | 211,898 | £13,511,355 | |
| Of which: | (D) HMRC assessed arrears | - | £9,498,979 | 115,810 | £13,511,355 |
| (E) Self-corrected arrears | - | £5,502,239 | 96,088 | - | |
| (F) Social Care Compliance Scheme (SCCS) | 29 | £255,356 | 1,011 | ||
| Total HMRC assessed arrears (= A + D) | £12,708,512 | 135,861 | £18,453,289 | ||
| Total self-corrected arrears ( = B + E + F) | £8,128,097 | 127,489 | - |
Source: BEIS / HMRC enforcement data
Notes:
*An additional 8 cases were originally closed prior to 2019/20 but the employer notified HMRC of additional arrears in 2019/20. The arrears in these cases are included in the arrears total for 2019/20. Some NMW cases with arrears are solely HMRC assessed, some are solely self-assessed and some involve an element of both. These are reported in rows A, B and C respectively
Table 11a. Apprenticeship minimum wage cases (2015/16 to 2019/20)
| Cases involving Apprentices | Closed cases | Closed cases with arrears | Strike rate | Arrears | Workers | Penalties Issued | Value of Penalties |
|---|---|---|---|---|---|---|---|
| 2015/16 | 263 | 196 | 75% | 558,618 | 632 | 188 | 309,666 |
| 2016/17 | 101 | 78 | 77% | 198,988 | 228 | 60 | 116,563 |
| 2017/18 | 152 | 69 | 45% | 277,389 | 3,452 | 55 | 234,915 |
| 2018/19 | 382 | 185 | 48% | 423,989 | 1,025 | 169 | 602,563 |
| 2019/20 | 173 | 117 | 68% | 315,920 | 542 | 110 | 481,128 |
Source: BEIS/HMRC enforcement data
Table 11b. Internship minimum wage cases (2015/16 to 2019/20)
| Cases involving Interns | Closed cases | Closed cases with arrears | Strike rate | Arrears | Workers | Penalties Issued | Value of Penalties |
|---|---|---|---|---|---|---|---|
| 2015/16 | 45 | 14 | 31% | £84,382 | 34 | 13 | 14,197 |
| 2016/17 | 16 | 4 | 25% | £7,677 | 4 | 4 | 5,829 |
| 2017/18 | 29 | 13 | 45% | £74,971 | 73 | 11 | 75,983 |
| 2018/19 | 29 | 13 | 45% | £79,617 | 50 | 12 | 135,555 |
| 2019/20 | 25 | 9 | 36% | £86,150 | 141 | 9 | 85,714 |
Source: BEIS/HMRC enforcement data
Notes
-
These cases only reflect those where the initial risk has been identified as either apprentices or interns.
-
It will not include investigations where HMRC subsequently found issues regarding apprentices or interns.
-
The identified arrears and workers may not wholly or partly relate to the apprenticeship or intern risk as HMRC cannot identify these without further case by case analysis
Table 12: Minimum wage prosecutions (2007-8 to 2019/20)
| Name of employer | Trading Name | Area | Offence | Fine | Costs | Compensation | Date |
|---|---|---|---|---|---|---|---|
| T Aguda | Rascals Day Nursery Ltd | Walthamstow | 31 (5) (a) | £2,500 | £500 | Nil | 28/08/2007 |
| Torbay Council | Torquay | 31 (5) (b) | £1,000 | £500 | Nil | 01/10/2007 | |
| R Singh | Pound Mania | Nottingham | 31 (5) (b) | £500 | £150 | Nil | 30/04/2008 |
| David Jackson | Jackson’s Butchers | Sheffield | 31 (1); 31 (2); 31 (3); 31 (4). | £700 | £100 | £9,065.85 | 02/07/2008 |
| Pauline Smout | Jackson’s Butchers | Sheffield | 31 (1); 31 (2); 31 (3); 31 (4) | £100 | £100 | £2,009.74 | 02/07/2008 |
| Zaheer Ibrahim | The Jewel in the Crown | Nottingham | 31 (5) (b) | £3,500 | £100 | Nil | 21/07/2008 |
| Ahmed Yassine | The Pheonix Hotel | Rotherham | 31 (2); 31 (5) (b) | £2,250 | £500 | Nil | 13/02/2009 |
| B G Optical | Manchester | 31(1); 31(2); 31(3); 31(4); 31(5)(a); 31(5)(b) | £3,696 | £820 | Nil | 23/06/2010 | |
| Widescope Security | London | 31(1); 31(5)(b) | £1,000 | £1,000 | Nil | 26/02/2013 | |
| Amanda Barrett | Amanda’s Precious Bubbles Day Nursery Ltd | Birmingham | 31(1); 31(2) | £3,247 | 11/05/2016 | ||
| Richard Hunt | The Rock Hotel (Weymouth) Ltd | Weymouth | 31(5)(a); 31(5)(b) | £500 | Nil | 13/05/2016 | |
| L.UK/Euro (Brighton) Ltd | 3D Telecon | Oldham | 31(1); 31(5)(a) | £5,000 | £1,860 | £9,300 | 04/08/2016 |
| Dida Brothers Car Wash | Southampton | 31(1); 31(2) | £14,000 or face 12 month jail term | £2,000 | £4,403 | 08/12/2016 | |
| Brialyn Limited | Birmingham | 31(5)(a); 31(5)(b) | £2,977 | £633 | Nil | 17/08/2017 | |
| McElroy and Company Limited | Dungannon | 31(1) | £250 | £500 | 11/11/2019 |
Source: BEIS/HMRC enforcement data
Table 13: Minimum wage related calls received by Acas, 2015/16 to 2019/20
| 2015/16 | 2016/17 | 2017/18 | 2018/19 | 2019/20 | |
|---|---|---|---|---|---|
| Total enquiries | 942,020 | 890,180 | 756,310 | 730,609 | 798,552 |
| Of which… | |||||
| Minimum wage enquiry | 13,490 | 15,360 | 10,310 | 7,736 | 8,102 |
| Enquiry about non-payment of minimum wage | 4,500 | 4,660 | 4,430 | 2,939 | 2,127 |
| Referred to HMRC | 1,520 | 2,310 | 1,980 | 1,895 | 2,730 |
Source: Acas
Table 14: Acas calls received by key topic and caller breakdown, 2016/17 to 2019/20
| 2016/17 | 2017/18 | 2018/19 | 2019/20 | |||||
|---|---|---|---|---|---|---|---|---|
| Minimum wage enquiry | Enquiry about non-payment of minimum wage | Minimum wage enquiry | Enquiry about non-payment of minimum wage | Minimum wage enquiry | Enquiry about non-payment of minimum wage | Minimum wage enquiry | Enquiry about non-payment of minimum wage | |
| Total | 15,360 | 4,660 | 10,310 | 4,430 | 7,736 | 2,939 | 8,102 | 2,127 |
| Gender | ||||||||
| Female | 9,470 | 2,630 | 6,480 | 2,590 | 4,628 | 1,655 | 4,897 | 1,214 |
| Male | 5,870 | 2,010 | 3,810 | 1,820 | 3,091 | 1,274 | 3,193 | 900 |
| Unknown | 10 | 10 | 20 | 10 | 10 | 5 | 12 | 13 |
| Caller type | ||||||||
| Employee | 10,330 | 4,030 | 7,300 | 3,870 | 5,579 | 2,574 | 6,171 | 1,873 |
| Employer | 3,940 | 250 | 2,300 | 220 | 1,455 | 133 | 1,329 | 65 |
| Agency Worker | 240 | 110 | 170 | 110 | 161 | 99 | 155 | 70 |
| Apprentice | 600 | 160 | 360 | 120 | 391 | 82 | 314 | 80 |
| Intern | 20 | 10 | 20 | 10 | 12 | 3 | 9 | - |
| Other | 220 | 100 | 170 | 90 | 135 | 48 | 124 | 39 |
Source: Acas
Table 15a: Estimated number of jobs paid below the minimum wage, by rate (April 2020)
| A. Total no. of 16+ jobs | B. Coverage (low paid jobs) | C. Number of jobs paid below relevant minimum wage rate | D. Jobs paid below as a proportion of all 16+ jobs | |
|---|---|---|---|---|
| Apprentice rate | 126,000 | 28,000 | 5,000 | 4.0% |
| 16-17 years | 159,000 | 29,000 | 3,000 | 1.9% |
| 18-20 years | 655,000 | 103,000 | 18,000 | 2.7% |
| 21-24 years (National Minimum Wage) | 1,442,000 | 140,000 | 25,000 | 1.7% |
| 25+ years (National Living Wage) | 21,433,000 | 1,465,000 | 297,000 | 1.4% |
| Total | 23,815,000 | 1,765,000 | 347,000 | 1.5% |
| Formula | - | - | - | = C/A |
Source: BEIS analysis of 2020 Annual Survey of Hours and Earnings (ONS)
Notes
-
Figures are rounded to the nearest thousand.
-
The figures shown exclude furloughed workers, and are therefore an underestimate of non-compliance. For more detail, please see “Measuring non-compliance with the minimum wage” in the accompanying report.
Table 15b: Estimated minimum wage underpayment over time (2016 to 2020)
| 2016 | 2017 | 2018 | 2019 | 2020 | |
|---|---|---|---|---|---|
| Apprentice | 7,000 | 6,000 | 8,000 | 9,000 | 5,000 |
| 16-17 years (Youth) | 2,000 | 4,000 | 23,000 | 3,000 | 3,000 |
| 18-20 years (Development | 20,000 | 19,000 | 35,000 | 19,000 | 18,000 |
| 21-24 years (NMW) | 28,000 | 30,000 | 370,000 | 32,000 | 25,000 |
| 25 years + (NLW) | 306,000 | 282,000 | 4,000 | 345,000 | 297,000 |
| Total | 361,000 | 341,000 | 441,000 | 408,000 | 347,000 |
Source: BEIS analysis of Annual Survey of Hours and Earnings (ONS) 2016 - 2020
Notes
-
Figures are rounded to the nearest thousand.
-
The figures shown exclude furloughed workers, and are therefore an underestimate of non-compliance. For more detail, please see “Measuring non-compliance with the minimum wage” in the accompanying report.
Table 16: Estimated number of jobs paid below the minimum wage by region (April 2020)
| Region | Total number of jobs | Below minimum wage | At or above minimum wage | % of all jobs |
|---|---|---|---|---|
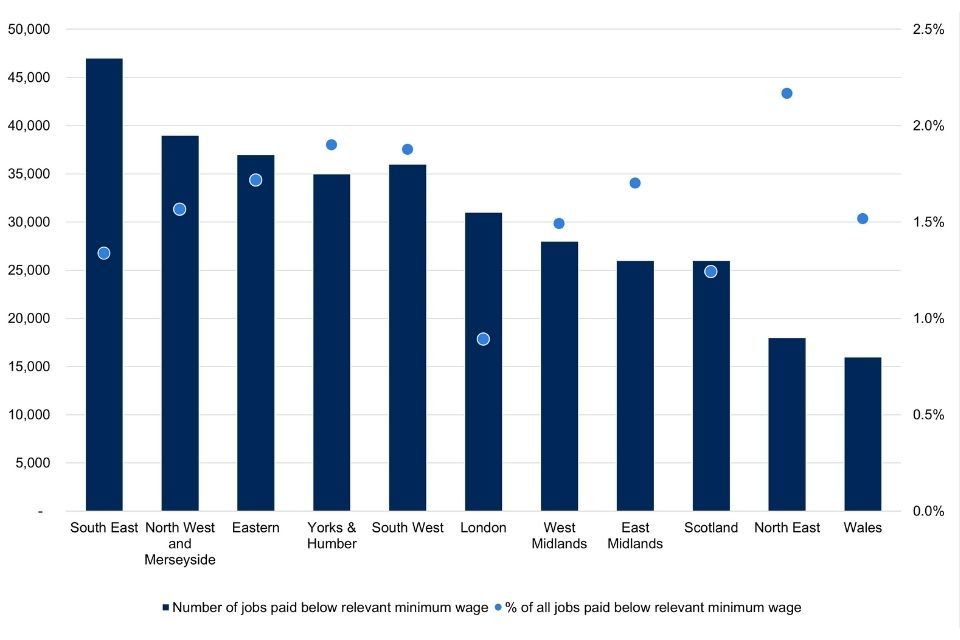
| South East | 3,519,000 | 47,000 | 3,472,000 | 1.3% |
| North West and Merseyside | 2,493,000 | 39,000 | 2,454,000 | 1.6% |
| Eastern | 2,156,000 | 37,000 | 2,119,000 | 1.7% |
| Yorks & Humber | 1,892,000 | 35,000 | 1,856,000 | 1.9% |
| South West | 1,920,000 | 36,000 | 1,884,000 | 1.9% |
| London | 3,480,000 | 31,000 | 3,449,000 | 0.9% |
| West Midlands | 1,878,000 | 28,000 | 1,850,000 | 1.5% |
| East Midlands | 1,581,000 | 26,000 | 1,555,000 | 1.7% |
| Scotland | 2,094,000 | 26,000 | 2,068,000 | 1.2% |
| North East | 831,000 | 18,000 | 812,000 | 2.2% |
| Wales | 1,055,000 | 16,000 | 1,039,000 | 1.5% |
Source: BEIS analysis of Annual Survey of Hours and Earnings 2020
Notes
-
Figures are rounded to the nearest thousand.
-
This covers underpayment across all minimum wage rates.
-
Estimates of the number (and percentage) of jobs paid below the minimum wage in Northern Ireland have not been included due to small sample sizes.
-
The figures shown exclude furloughed workers, and are therefore an underestimate of non-compliance. For more detail, please see “Measuring non-compliance with the minimum wage” in the accompanying report.
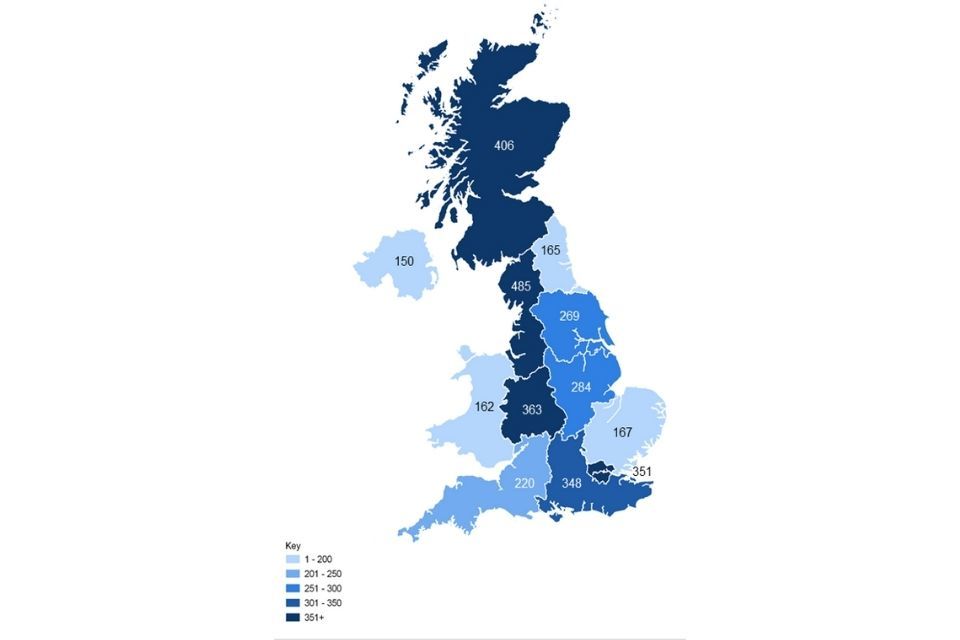
Figure 16: Estimates of jobs paid below the minimum wage by region (April 2020)
Source: BEIS analysis of Annual Survey of Hours and Earnings 2020
Notes
-
Figures are rounded to the nearest thousand.
-
This covers underpayment across all minimum wage rates.
-
The figures shown exclude furloughed workers, and are therefore an underestimate of non-compliance. For more detail, please see “Measuring non-compliance with the minimum wage” in the accompanying report.
Table 17: Estimated number of jobs paid below and covered by the minimum wage, by parliamentary constituency (2020)
Please refer to tab ‘Table 17’ in the spreadsheet Supplementary data for the 2019/20 National Minimum Wage Enforcement statistics report.
Table 18: Estimated number of jobs paid below the minimum wage by Low Pay Sector (April 2020)
| Low Pay Sector | Total number of jobs | Below minimum wage | At or above minimum wage (lower bound) | % of workers paid below minimum wage |
|---|---|---|---|---|
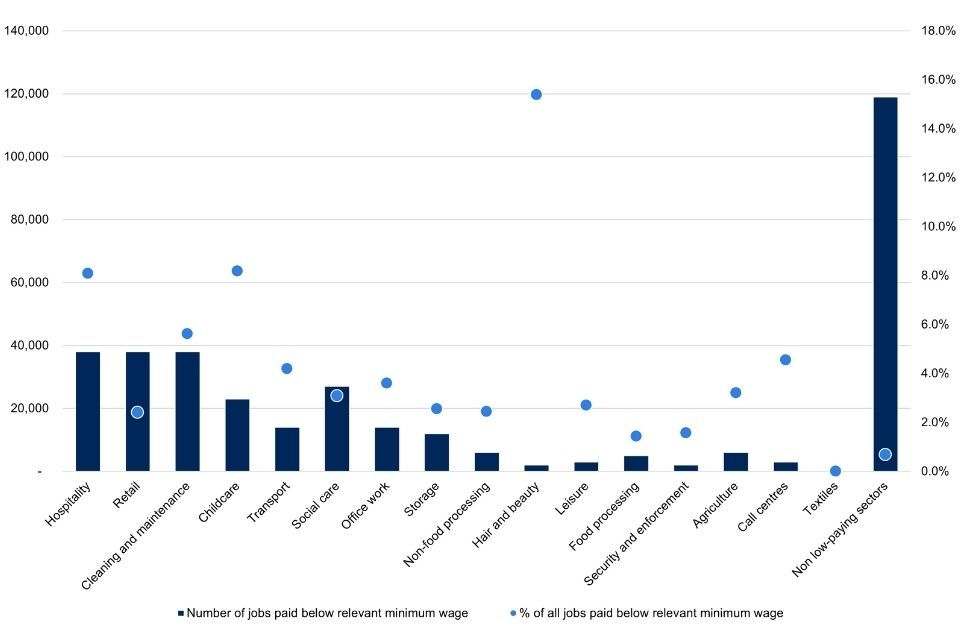
| Hospitality | 470,000 | 38,000 | 431,000 | 8.1% |
| Retail | 1,583,000 | 38,000 | 1,546,000 | 2.4% |
| Cleaning and maintenance | 676,000 | 38,000 | 637,000 | 5.6% |
| Childcare | 281,000 | 23,000 | 259,000 | 8.2% |
| Transport | 334,000 | 14,000 | 320,000 | 4.2% |
| Social care | 875,000 | 27,000 | 848,000 | 3.1% |
| Office work | 389,000 | 14,000 | 375,000 | 3.6% |
| Storage | 471,000 | 12,000 | 459,000 | 2.5% |
| Non-food processing | 246,000 | 6,000 | 240,000 | 2.4% |
| Hair and beauty | 13,000 | 2,000 | 11,000 | 15.4% |
| Leisure | 111,000 | 3,000 | 107,000 | 2.7% |
| Food processing | 349,000 | 5,000 | 343,000 | 1.4% |
| Security and enforcement | 128,000 | 2,000 | 126,000 | 1.6% |
| Agriculture | 187,000 | 6,000 | 181,000 | 3.2% |
| Call centres | 66,000 | 3,000 | 63,000 | 4.5% |
| Textiles | 17,000 | - | 17,000 | 0.0% |
| Non low-paying sectors | 17,624,000 | 119,000 | 17,505,000 | 0.7% |
Source: BEIS analysis of Annual Survey of Hours and Earnings 2020
Notes
-
Figures are rounded to the nearest thousand.
-
This covers underpayment across all minimum wage rates.
-
The figures shown exclude furloughed workers, and are therefore an underestimate of non-compliance. For more detail, please see “Measuring non-compliance with the minimum wage” in the accompanying report.
-
Figures may not always tally to the total because of rounding.
Figure 18: Estimated jobs paid below the minimum wage by Low Pay Sector (April 2020)
Source: BEIS analysis of Annual Survey of Hours and Earnings 2020
Notes
-
Figures are rounded to the nearest thousand.
-
This covers underpayment across all minimum wage rates.
-
The figures shown exclude furloughed workers, and are therefore an underestimate of non-compliance. For more detail, please see “Measuring non-compliance with the minimum wage” in the accompanying report.
Table 19: Estimated National Living Wage underpayment in 10p pay band (April 2020)
| Amount underpaid | Number of underpaid workers |
|---|---|
| £0.01 | 18,900 |
| £0.02 to £0.03 | 36,500 |
| £0.04 to £0.05 | 15,900 |
| £0.06 to £0.07 | 3,500 |
| £0.08 to £0.09 | 3,500 |
| £0.10 to £0.20 | 18,100 |
| £0.21 to £0.30 | 14,500 |
| £0.31 to £0.40 | 12,100 |
| £0.41 to £0.50 | 11,400 |
| £0.51 to £0.60 | 27,400 |
| £0.61 to £0.70 | 6,100 |
| £0.71 to £0.80 | 9,400 |
| £0.81 to £0.90 | 4,700 |
| £0.91 to £1.00 | 4,400 |
| £1.01 to £1.10 | 10,200 |
| £1.11 to £1.20 | 7,800 |
| £1.21 to £1.30 | 7,600 |
| £1.31 to £1.40 | 6,400 |
| £1.41 to £1.50 | 4,600 |
| £1.51 to £1.60 | 5,500 |
| £1.61 to £1.70 | 5,400 |
| £1.71 to £1.80 | 5,200 |
| £1.81 to £1.90 | 2,700 |
| £1.91 to £2.00 | 3,700 |
| £2.01 to £2.10 | 1,600 |
| £2.11 to £2.20 | 2,700 |
| £2.21 to £2.30 | 1,400 |
| £2.31 to £2.40 | 2,100 |
| £2.41 to £2.50 | 1,600 |
| £2.51 to £2.60 | 1,500 |
| £2.61 to £2.70 | 1,600 |
| £2.71 to £2.80 | 1,200 |
| £2.81 to £2.90 | 1,300 |
| £2.91 to £3.00 | 500 |
| £3.01+ | 35,800 |
Source: BEIS analysis of Annual Survey of Hours and Earnings 2020
Notes
-
Figures are rounded to the nearest hundred.
-
This table covers underpayment across all the National Living Wage (NLW) rate, which applies only to workers aged 25 years and over. The NLW was set at £8.72 in 2020.
-
The figures shown exclude furloughed workers, and are therefore an underestimate of non-compliance. For more detail, please see “Measuring non-compliance with the minimum wage” in the accompanying report.
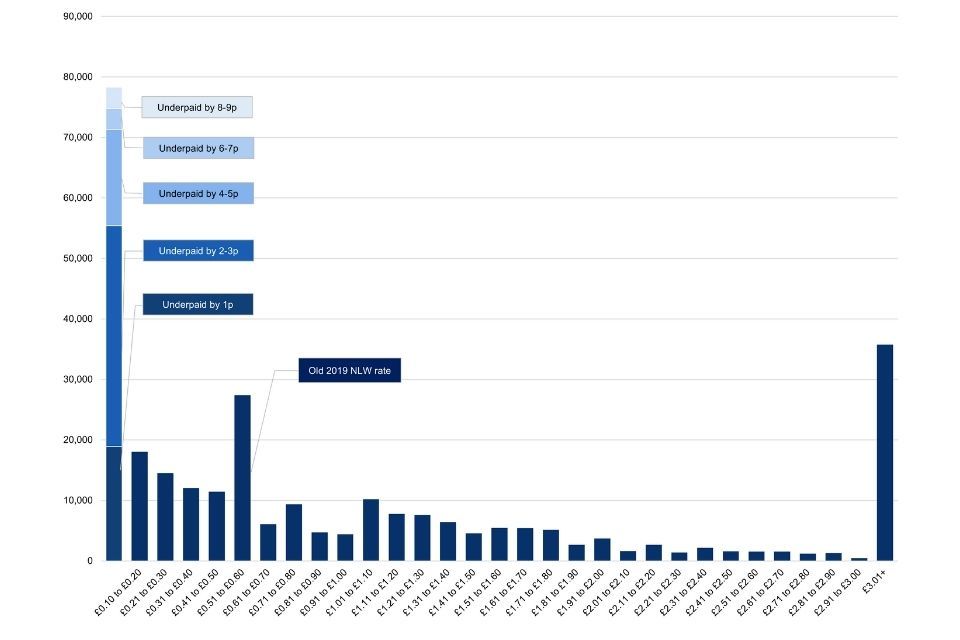
Figure 19: Estimates of National Living Wage underpayment in 10p pay band (April 2020)
Source: BEIS analysis of Annual Survey of Hours and Earnings 2020
Notes
-
Figures are rounded to the nearest hundred.
-
This table covers underpayment across all the National Living Wage (NLW) rate, which applies only to workers aged 25 years and over. The NLW was set at £8.72 in 2020.
-
The figures shown exclude furloughed workers, and are therefore an underestimate of non-compliance. For more detail, please see “Measuring non-compliance with the minimum wage” in the accompanying report.