National Insurance numbers allocated to adult overseas nationals to September 2020
Updated 14 June 2021

© Crown copyright 2021
This publication is licensed under the terms of the Open Government Licence v3.0 except where otherwise stated. To view this licence, visit nationalarchives.gov.uk/doc/open-government-licence/version/3 or write to the Information Policy Team, The National Archives, Kew, London TW9 4DU, or email: psi@nationalarchives.gov.uk.
Where we have identified any third party copyright information you will need to obtain permission from the copyright holders concerned.
This publication is available at https://www.gov.uk/government/statistics/national-insurance-numbers-allocated-to-adult-overseas-nationals-to-september-2020/national-insurance-numbers-allocated-to-adult-overseas-nationals-to-september-2020
The latest release of these statistics can be found in the collection of National Insurance number allocations statistics.
This summary contains statistics on National Insurance numbers (NINos) allocated to adult overseas nationals, covering the period from January 2002 to September 2020.
A National Insurance number (or NINo) is generally required by any adult overseas national looking to work or claim benefits and tax credits in the UK.
These Department for Work and Pensions (DWP) statistics show a count, by individual nationality, of the number of NINos registered to adult non-UK nationals each quarter, irrespective of the length of stay in the UK. The statistics are not a count of the number of adult non-UK nationals currently residing in the UK.
1. Main stories
In quarter 3 (Q3) of the 2020 calendar year, there were 30,000 NINo registrations: an 85% decrease compared to the same quarter in 2019, this is the lowest number of registrations in a quarter since the start of the time series in quarter 1 (Q1) 2002. This decrease in registrations is primarily due to the effects of the COVID-19 pandemic.
EU registrations in Q3 2020 were the lowest they have been in a quarter since the start of the time series in Q1 2002 at 1,200 registrations, continuing the sharp decrease that began in Q2 2020. Non-EU registrations were the lowest they have been in a quarter since Q2 2014, with 28,000 registrations in Q3 2020. Non-EU registrations continued to outnumber EU registrations for the third quarter in a row and had a smaller decrease than EU registrations. Prior to 2020, the last time Non-EU registrations outnumbered EU within a quarter was quarter 4 (Q4) 2010.
450,000 NINos were registered in the year to September 2020: a 40% decrease on the year to September 2019. Registrations to Non-EU nationals in the year to September 2020, outnumbered registrations to EU nationals for the first time in the annual data since 2010, although just by 250 more registrations.
EU registrations decreased by 230,000 in the year to September 2020: a 51% decrease on the previous year. This change was due to a decrease in registrations to all EU countries, with registrations to nationals from Romania, Poland and Italy accounting for more than half of the total decrease of EU registrations during this period. In January 2020 the UK officially exited the EU, although until the end of the transition period the rights of EU nationals remain unchanged.
Non-EU registrations decreased by 69,000 in the year to September 2020: a 24% decrease on the previous year. Over a quarter of the decrease of registrations to Non-EU nationals in the year to September 2020 was due to a decrease of registrations to nationals from the United States, Australia and India during this period.
It is important to acknowledge that due to the Coronavirus (COVID-19) pandemic, NINo operations have been severely disrupted since mid-March. Demand for NINo services may have been impacted but this cannot be inferred from these statistics.
It is important to note that EU NINo services have been more heavily disrupted than Non-EU NINo services by the COVID-19 pandemic, this is due to the suspension of the ‘Evidence of Identity’ interview which EU applicants must attend. The majority of NINo registrations to EU nationals in Q3 2020 are registrations made for benefit purposes and do not necessarily reflect the demand for a NINo from EU nationals. Extreme caution must be taken when using the EU registrations for year ending September 2020 and Q3 2020 for migration statistics, due to the larger impact the Covid-19 pandemic has had on the NINo allocation service to EU nationals.
The postal process for NINo applicants with a valid work visa was reinstated on 1 June, after being suspended in March 2020, affecting applications from Non-EU nationals.
2. What you need to know
This summary contains statistics on NINos allocated to adult overseas nationals, covering the period from January 2002 to September 2020.
Re-designation of National Statistics Status
The UK Statistics Authority has re-designated these statistics as National Statistics, at November 2020. This outcome is the result of work over the last 3 years undertaken by the statistics team responsible for the publication in order to address a list of recommendations the Office for Statistics Regulation (OSR) set out in in their judgement in January 2017, when they judged that the National Statistics status would be temporarily suspended.
The 2017 assessment of the statistics focused on eight requirements which DWP was to meet to ensure compliance with the Code of Practice for Statistics and considered more broadly how the statistics meet the three pillars of the Code of Practice for Statistics: Trustworthiness, Quality, and Value and with the Statistics and Registration Service Act 2007.
Key developments include:
- introduction of quarterly data in the narrative
- a thorough quality report
- detailed methodology note and data journey
- new user engagement strategy
- new publication strategy
- move to HTML and a more accessible release
Once statistics have been designated as National Statistics it is the responsibility of the statistics team to maintain compliance with these standards.
What can you use these figures for?
The statistics provide:
- a 100% count of foreign nationals registered for a NINo in a quarter
- the nationality of foreign nationals at the time of registering
- where the foreign nationals registered
What you cannot use these figures for
The statistics cannot be used as a count of:
- quarterly or annual migration to the UK
- the number of foreign nationals who have started work or are currently in work
- the number of foreign nationals who are currently in the UK
The statistics show the number of people registered for a NINo in order to work or to claim benefits and tax credits and are one of a number of supplementary measures produced by government of in-migration to the UK.
Although quarterly registration figures are provided in the accompanying data tables, care should be taken when interpreting quarterly changes as they might reflect changes in operational activity. Annual year-on-year changes are more reliable to reflect longer-term trends.
The statistics are published as part of the scheduled timetable for the release of cross-Government migration statistics. Also published by the Office for Nationals Statistics (ONS) today is a report on “International migration and travel mobility: What’s changed since the coronavirus pandemic” and an “update on progress in transforming our international migration statistics”.
Read the background information note for further information, including detail on uses and limitations of the series.
Comparisons with other sources of migration
NINo statistics are not a direct measure of long term migration and therefore are not directly comparable with ONS long-term estimates of immigration.
On 7 March 2016, the ONS published an information note explaining the reasons why long-term international immigration figures from the International Passenger Survey (IPS) could differ from the number of NINo registrations.
This was followed by an analytical paper presenting analysis that has been undertaken across government to help understand why the 2 series are showing different trends, with focus on EU migration.
Transformation of Migration Statistics
From 16 March 2020, the International Passenger Survey (IPS) was halted as a result of the COVID-19 pandemic. In the August 2020 MSQR, the ONS reported that the IPS will no longer be used to estimate migration. The MSQR will no longer be published and the ONS are working towards an Admin Based Migration Estimate (ABME) approach as part of the ONS transformation journey for migration and population statistics.
EU groupings used within migration statistics
The following EU groupings are used in the statistics:
- EU15 (these are the original EU members: Austria, Belgium, Denmark, Finland, France, Germany, Greece, Ireland, Italy, Luxembourg, Netherlands, Portugal, Spain and Sweden)
- EU8 (these joined the EU in 2004: Czech Republic, Estonia, Hungary, Latvia, Lithuania, Poland, Slovakia and Slovenia)
- EU2 (these joined the EU in 2007: Romania & Bulgaria)
- EU Other (Croatia, Cyprus and Malta)
For reporting purposes, countries have been grouped into ‘World Areas’ based primarily on geographical location.
Changes to the process of NINo recording in 2014
A change to the process of recording NINos during Q2 2014, means that the volume of NINo registrations recorded were lower in that quarter and then higher in quarter 3 (Q3) 2014 than would otherwise be the case. Therefore, NINo registrations over this period should be interpreted with caution.
Rounding policy
The rounding policy was reviewed for the May 2020 publication, as the publication now includes lower level figures. Data in the release has since been rounded as per the table below.
| From | To | Rounded to nearest |
|---|---|---|
| 0 | 1,000 | 10 |
| 1,001 | 10,000 | 100 |
| 10,001 | 100,000 | 1,000 |
| 100,001 | 1,000,000 | 10,000 |
| 1,000,001 | 10,000,000 | 100,000 |
| 10,000,001 | 100,000,000 | 1,000,000 |
All changes are calculated prior to rounding. Percentage changes are calculated prior to rounding and then are rounded to the nearest whole number. As all figures within this statistical summary have been rounded, they may not add up.
COVID-19
The NINo allocation process was disrupted as a result of the COVID-19 pandemic. This has resulted in a significant reduction in the number of NINos allocated.
The processing of NINo applications made for employment purposes was suspended in March 2020 to enable the redeployment of resources to other DWP areas to address the unprecedented demand for financial assistance, for example to help process new Universal Credit applications. Although new NINo applications made for employment purposes were not accepted, those already received and new applications made for made for benefit purposes were processed to completion. The postal process for NINo applicants with a valid work visa was reinstated on 1 June, after being suspended in March 2020, affecting applications from Non-EU nationals. A date to restart processing of applications for those whose applications require an ‘Evidence of Identity’ interview, has not yet been agreed.
The impact of the operational disruptions due to the COVID-19 pandemic will be visible in the yearly data for some time after the COVID-19 pandemic ends. Once NINo services become fully available any change in demand for NINo services during the COVID-19 pandemic, currently not visible in the data, may start impacting the yearly NINo registration statistics.
Operational Changes: Apply for a NINo
On 15 October 2020, the NINo application services launched a new digital platform to support the Face to Face service, named “Apply for a NINo”. This process replaces the previous paper application form for most applications to DWP NINo services.
These changes to operations will not have had an impact on the data reported in this publication, but it is possible it could be reflected in coming quarters.
EU Exit
On 31 January 2020, the UK officially exited the EU but a period of transition commenced. Although there have been no changes to the rights of EU nationals during the transition period there has been a continuation of the downward trend in EU registrations since the EU referendum in June 2016.
On 31 December 2020, at 11pm, freedom of movement between the United Kingdom (UK) and the European Union (EU) will end. In July 2020, the government published a policy statement containing further details on the UK points-based immigration system due to be introduced following the end of the EU Transition Period on the 31 December 2020. Unless otherwise stated in the statement above, these immigration routes will be open by January 2021.
Quarterly Data
For some nationality sub-groups, seasonal patterns in the number of registrations are visible in the quarterly figures. However, these are often heavily disrupted by various changes to policy, operations and other events such as COVID-19. Seasonal effects can also be suppressed at levels of data higher than individual nationalities, due to different countries having opposing seasonal patterns.
Quarter 1 (Q1) to quarter 4 (Q4) refers to calendar quarters, starting from 1 January to 31 March for Q1.
3. How many people are registering?
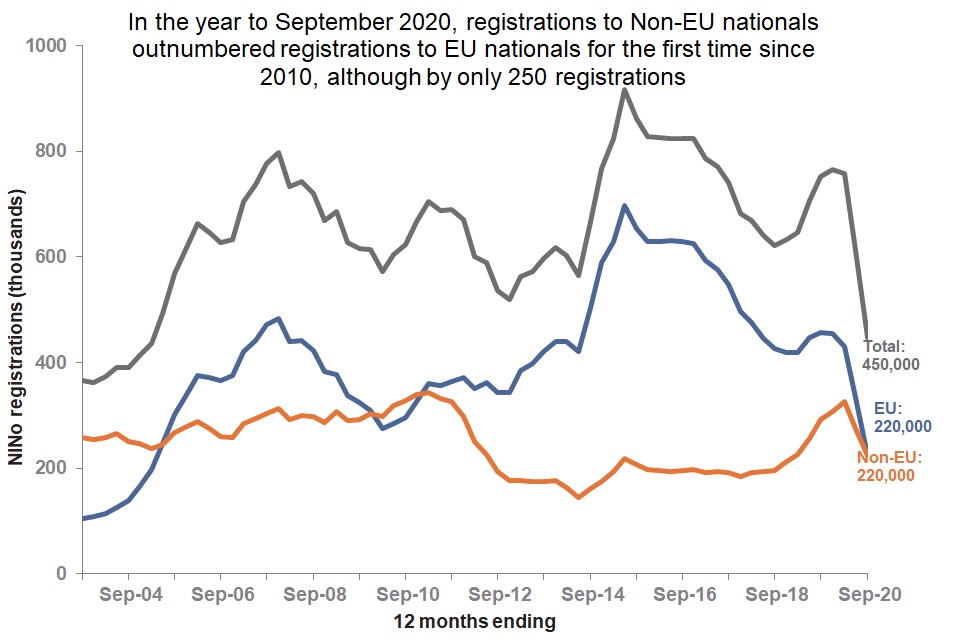
450,000 NINos were registered in the year to September 2020: a 40% decrease on the year to September 2019. Registrations to Non-EU nationals in the year to September 2020, outnumbered registrations to EU nationals for the first time in the annual data since 2010, although just by 250 more registrations.
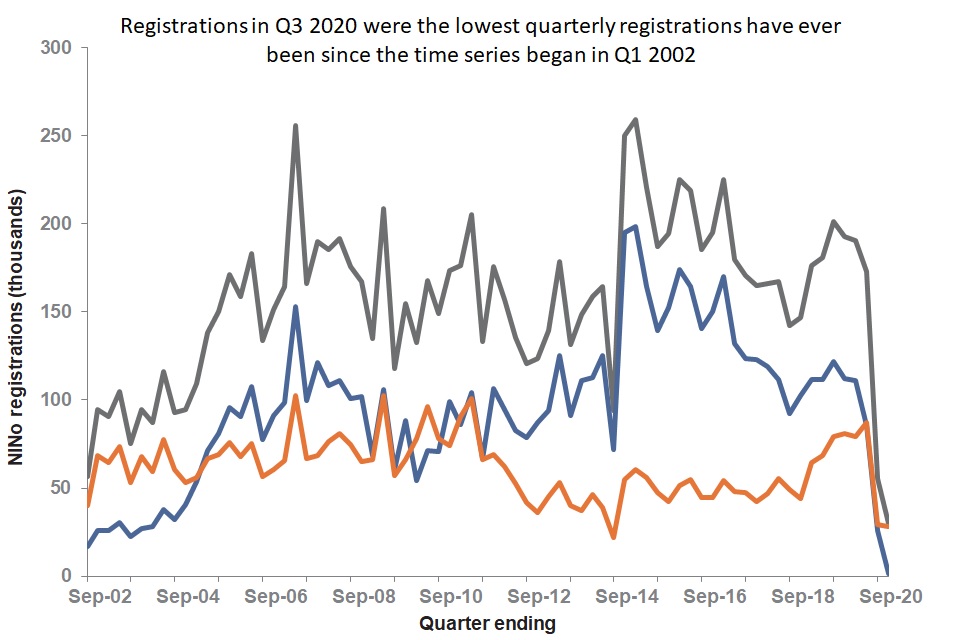
In Q3 2020 there were 30,000 NINos registered: an 85% decrease on Q3 2019 and the lowest quarterly registrations have ever been since the time series began in Q1 2002.
The decrease in registrations is primarily due to the impact of the COVID-19 pandemic, with processing of new NINo applications made for employment purposes being suspended on 18 March 2020. Although new NINo applications made for employment purposes were not accepted between 18 March and 1 June 2020, those already received and new applications made for benefit purposes were processed to completion.
4. Where in the world are people registering from?
NINo registrations in the year to September 2020, change from previous year and annual percentage change
| World Area | Registrations to Sep 2019 | Registrations to Sep 2020 | Change from previous year | Annual Percentage Change |
|---|---|---|---|---|
| EU | 460,000 | 220,000 | -230,000 | -51% |
| Non-EU | 290,000 | 220,000 | -69,000 | -24% |
| Total* | 750,000 | 450,000 | -300,000 | -40% |
Note: * Due to rounding and the inclusion of unknown nationalities in the total, the total figure could differ from the sum of EU and Non-EU.
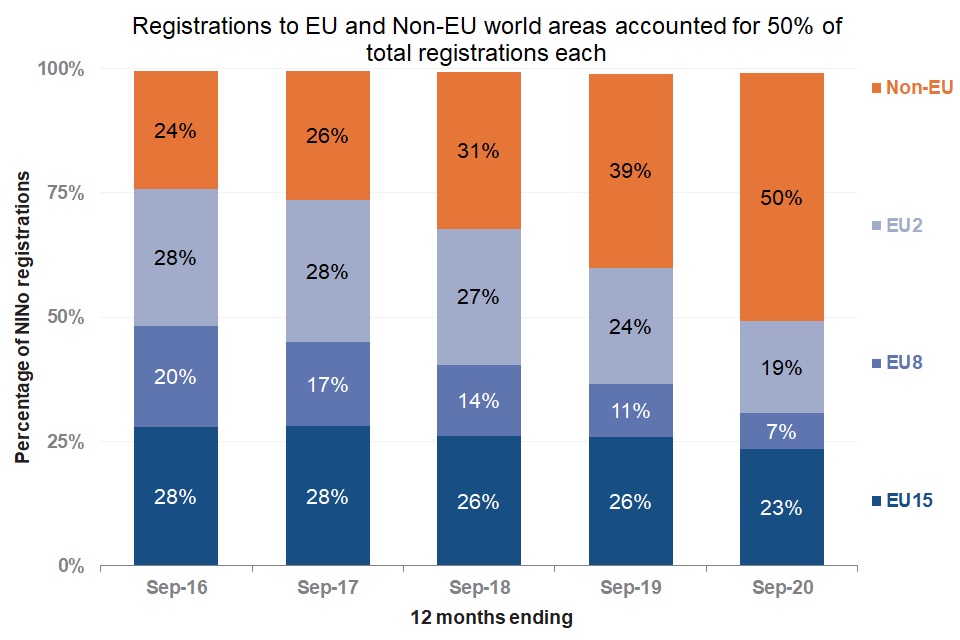
Registrations from EU and Non-EU nationals decreased year on year and are they lowest they have been since the year ending March 2005. In the year to September 2020, registrations to EU nationals decreased by 51%, compared to a 24% decrease in registrations from Non-EU nationals in the same period. This has driven a relative change in the balance of EU and Non-EU national registrations, with the EU registrations being lower than Non-EU registrations for the first time in the yearly data since the year to December 2010, by a small difference of 250 registrations. EU registrations accounted for 50% of the total registrations in the year to September 2020, compared to 61% of registrations in the year to September 2019.
NINo registrations in Q3 2020, compared to Q3 2019
| World Area | Registrations Q3 2019 | Registrations Q3 2020 | Change from Q3 2019 | Percentage Change from Q3 2019 |
|---|---|---|---|---|
| EU | 110,000 | 1,200 | -110,000 | -99% |
| Non-EU | 81,000 | 28,000 | -52,000 | -65% |
| Total* | 190,000 | 30,000 | -160,000 | -85% |
Note: * Due to rounding and the inclusion of unknown nationalities in the total, the total figure could differ from the sum of EU and Non-EU.
In Q3 2020 both EU and Non-EU registrations decreased when compared to Q3 2019. EU registrations decreased by 99% from Q3 2019 to 1,200 registrations. Non-EU registrations decreased by 65% to 28,000 registrations over the same period.
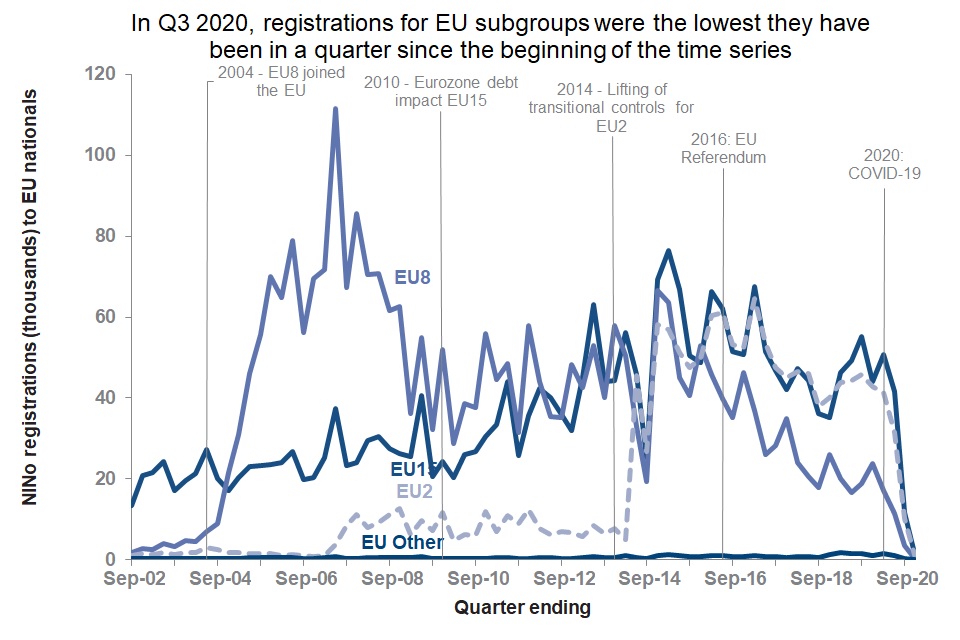
The number of registrations in Q3 2020 were the lowest there have been in a quarter since the start of the time series. EU registrations in Q3 2020 were also the lowest they have been in a quarter since the beginning of the time series, whereas Non-EU registrations were the lowest they have been in a quarter since Q2 2014. Due to the larger decrease in EU registrations, Non-EU registrations continued to outnumber EU registrations for the third quarter in a row. Prior to 2020, the last time Non-EU registrations outnumbered EU within a quarter was Q4 2010.
In Q3 2020 EU registrations accounted for only 4% of Non-UK registrations, a decrease of 54 percentage points, from the 58% of the Non-UK registrations they accounted for in Q3 2019. From Q3 2019 to Q3 2020, registrations to EU and Non-EU nationals saw the largest decrease between the same quarter year on year since the start of the time series.
EU NINo services have been more heavily disrupted than Non-EU NINo services by the COVID-19 pandemic, this is due to the suspension of the ‘Evidence of Identity’ interview which EU applicants must attend. The postal process for NINo applicants with a valid work visa was reinstated on 1 June 2020, after being suspended in March 2020, affecting applications from Non-EU nationals.
5. EU Registrations
It is important to note that EU NINo services have been more heavily disrupted than Non-EU NINo services by the COVID-19 pandemic, this is due to the suspension of the ‘Evidence of Identity’ interview which EU applicants must attend. The majority of NINo registrations to EU nationals in Q3 2020 are registrations made for benefit purposes and do not necessarily reflect the demand for a NINo from EU nationals. Extreme caution must be taken when using the EU registrations for year ending September 2020 and Q3 2020 for migration statistics, due to the larger impact the COVID-19 pandemic has had on the NINo allocation service to EU nationals.
The postal process for NINo applicants with a valid work visa was reinstated on 1 June 2020, after being suspended in March 2020, affecting applications from Non-EU nationals.
5.1 Long term trends and changes in EU Registrations
Prior to the year to September 2020:
-
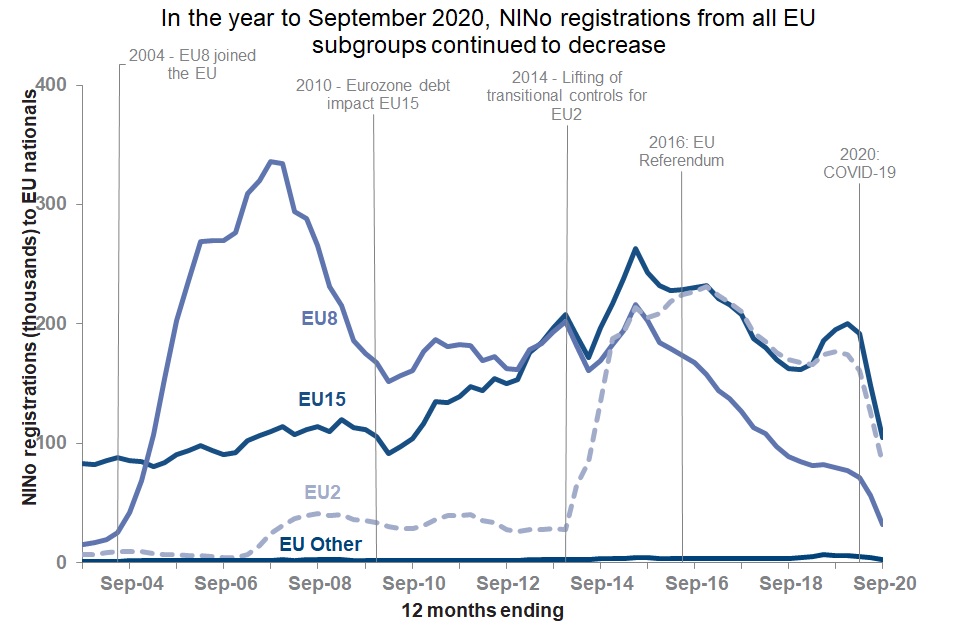
registrations from EU15 countries gradually increased from June 2003 until they peaked in the year ending June 2015 (with 260,000 registrations that accounted for 38% of EU registrations), and declined since the referendum in June 2016 until they began to increase from year ending December 2018 until year ending December 2019 and have decreased since
-
registrations to EU8 citizens drove the sharp rise in EU NINo registrations in 2004, when countries from the EU8 joined the EU. EU8 registrations peaked in the year ending September 2007 (with 340,000 registrations that accounted for 71% of EU registrations), after which declined until the year ending March 2010. After a period of volatility EU8 registrations have again generally declined since the EU referendum
-
registrations to EU2 nationals were relatively low until the removal of restrictions on work for EU2 citizens drove the sharp rise in EU registrations in 2014. Some of this reflected individuals who were residing in the UK prior to 2014 and would only have been able to register for a NINo after that date (arrival to registration analysis on EU2 nationals for more about this.) EU2 registrations peaked in the year to December 2016 (with 230,000 registrations that accounted for 37% of EU registrations) and declined until year ending March 2019, and then increased again until year ending September 2019 and have declined again since
NINo registrations by EU sub-group in the year to September 2020, change from previous year and annual percentage change
| EU sub-group | Registrations to Sep 2019 | Registrations to Sep 2020 | Change from previous year | Annual Percentage Change |
|---|---|---|---|---|
| EU15 | 190,000 | 100,000 | -90,000 | -46% |
| EU8 | 80,000 | 32,000 | -47,000 | -59% |
| EU2 | 180,000 | 83,000 | -93,000 | -53% |
| EU Other | 6,200 | 3,000 | -3,300 | -52% |
| Total EU | 460,000 | 220,000 | -230,000 | -51% |
In the year to September 2020, there were 220,000 NINo registrations by EU nationals. Of which:
-
100,000 registrations were to EU15 nationals, a decrease of 46% since the year ending September 2019. EU15 registrations now account for 47% of EU registrations compared to 43% in the year ending September 2019. EU15 registrations to year ending September 2020 (100,000) are the lowest they have been since the year ending September 2010
- 32,000 registrations were to EU8 nationals, a decrease of 59% since the year ending September 2019. EU8 registrations now account for 15% of EU registrations compared to 17% in the year ending September 2019. EU8 registrations in the year ending September 2020 (32,000) are the lowest they have been in a full year since the year to June 2004
-
83,000 registrations were to EU2 nationals, a decrease of 53% since the year ending September 2019. EU2 registrations now account for 37% of EU registrations compared to 39% in the year ending September 2019. Registrations to EU2 nationals for the year ending September 2020 (83,000) are the lowest they have been since 2014, when restrictions to EU2 nationals were lifted
- the largest number of NINo registrations to EU nationals were to nationals from Romania (65,000), followed by nationals from Italy (26,000), Spain (20,000), Bulgaria (19,000) and Poland (16,000)
Top 5 EU individual nationalities by number of registrations in the year to September 2020 and annual percentage change
| EU Country | Registrations | Annual Percentage Change |
|---|---|---|
| Romania | 65,000 | -54% |
| Italy | 26,000 | -49% |
| Spain | 20,000 | -46% |
| Bulgaria | 19,000 | -50% |
| Poland | 16,000 | -62% |
In the year to September 2020, total EU registrations decreased by 51% from the previous year. The decrease was driven by the decrease in registrations from all EU sub-groups, particularly from the EU2 and EU15. Registrations to EU nationals are the lowest they have been since the year ending March 2005.
Romania, Poland, Italy, Bulgaria and Spain were the 5 EU countries that saw the largest decrease in the number of NINo registrations in the year to September 2020. Although these five countries saw the largest decreases in the number of registrations, they are also the five countries within the EU with the most registrations in the year to September 2020
The decrease in registrations by nationals from Italy and Spain accounted for 47% of the decrease of registrations by EU15 nationals. The decrease in registrations to Polish nationals accounted for 56% of the decrease in EU8 registrations. The decrease in registrations to Romanian nationals accounted for 80% of the decrease in EU2 registrations.
EU individual nationalities with the largest decrease in registrations in the year to September 2020, change from previous year and annual percentage change
| EU Country | Registrations to Sep 2019 | Registrations to Sep 2020 | Change from previous year | Annual Percentage Change |
| Romania | 140,000 | 65,000 | -74,000 | -54% |
| Poland | 43,000 | 16,000 | -26,000 | -62% |
| Italy | 52,000 | 26,000 | -25,000 | -49% |
| Bulgaria | 38,000 | 19,000 | -19,000 | -50% |
| Spain | 37,000 | 20,000 | -17,000 | -46% |
5.2. Recent changes in EU Registrations
NINo registrations by EU sub-group in Q3 2020, compared to Q3 2019
| EU sub-group | Registrations Q3 2019 | Registrations Q3 2020 | Change from Q3 2019 | Percentage Change from Q3 2019 |
|---|---|---|---|---|
| EU15 | 44,000 | 580 | -44,000 | -99% |
| EU8 | 24,000 | 200 | -24,000 | -99% |
| EU2 | 43,000 | 360 | -42,000 | -99% |
| EU Other | 1,200 | 10 | -1,100 | -99% |
| Total EU | 110,000 | 1,200 | -110,000 | -99% |
In Q3 2020 there were only 1,200 NINo registrations by EU nationals, the lowest number of registrations in a quarter to EU nationals since the start of the time series in Q1 2002.
Compared to the same quarter a year ago, in Q3 2020:
-
registrations to EU15 nationals decreased by 99% to 580 registrations, the lowest number of EU15 registrations in a quarter since the start of the time series
-
registrations to EU8 nationals decreased by 99% to 200 registrations, the lowest number of EU8 registrations in a quarter since the start of the time series
-
registrations to EU2 nationals decreased by 99% to 360 registrations, the lowest number of EU2 registrations in a quarter since the start of the time series
-
NINo registrations to EU15 and EU2 nationals had the largest decrease between equivalent quarters of consecutive years since the start of the time series
-
the largest number of NINo registrations in Q3 2020 were to nationals from Romania (290), followed by nationals from Ireland (180), Italy (120), Poland (90) and from Bulgaria (70)
Top 5 EU individual nationalities by number of registrations in Q3 2020 and percentage change from Q3 2019
| EU Country | Registrations in Q3 2020 | Percentage Change from Q3 2019 |
|---|---|---|
| Romania | 290 | -99% |
| Ireland | 180 | -94% |
| Italy | 120 | -99% |
| Poland | 90 | -99% |
| Bulgaria | 70 | -99% |
In Q3 2020, total EU registrations decreased by 99% from Q3 2019. This large decrease was reflected in all EU Subgroups.
All EU countries saw a decrease in registrations in Q3 2020 from Q3 2019. The decrease in registrations to nationals from Italy and Spain accounted for 45% of the decrease in EU15 registrations. The decrease in registrations to Polish nationals accounted for 59% of the decrease in EU8 registrations. The decrease in registrations to Romanian nationals accounted for 74% of the decrease in EU2 registrations.
EU individual nationalities with the largest decrease in registrations in Q3 2020, change in registrations and percentage change from Q3 2019
| EU Country | Registrations Q3 2019 | Registrations Q3 2020 | Change from Q3 2019 | Percentage Change from Q3 2019 |
| Romania | 32,000 | 290 | -31,000 | -99% |
| Poland | 14,000 | 90 | -14,000 | -99% |
| Bulgaria | 11,000 | 70 | -11,000 | -99% |
| Italy | 11,000 | 120 | -10,000 | -99% |
| Spain | 9,100 | 60 | -9,100 | -99% |
6. Non-EU registrations
It is important to acknowledge that registrations to Non-EU nationals have been less severely impacted by disruptions to NINo services than registrations to EU nationals. The postal process for NINo applicants with a valid work visa was reinstated on 1 June 2020, after being suspended in March 2020, affecting applications by Non-EU nationals.
6.1. Long term trends and changes in Non-EU Registrations
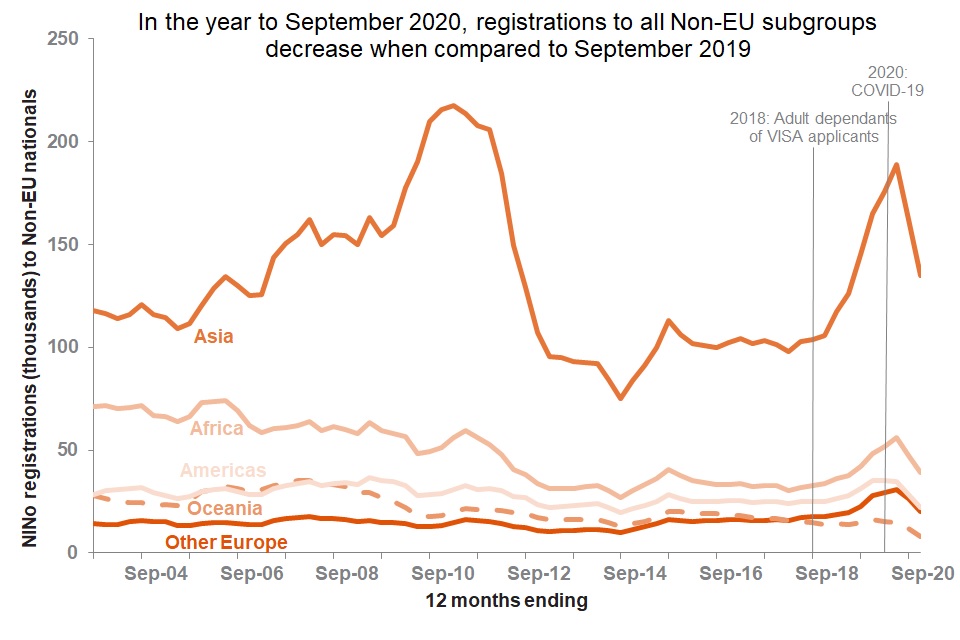
Registrations to all Non-EU subgroups have been impacted by the COVID-19 pandemic, with a decrease in registrations across all Non-EU subgroups in the year to September 2020, continuing the decreasing trend seen in the year to June 2020.
Prior to the year to September 2020:
-
registrations from European countries not a part of the EU (Other Europe) have remained relatively low and stable from the start of the time series to the year ending December 2018 and have declined since June 2020. Registrations from Other Europe have increased above those from Oceania since the end of December 2017
-
registrations from Asia generally increased until they peaked in the year ending December 2010 (with 220,00 registrations that accounted for 64% of Non-EU registrations), and declined until the year ending June 2014. Registrations from Asia were stable from the year ending September 2015 until the year ending December 2018, and continued to increase until the year to March 2020 and have declined since
-
registrations from Africa generally decreased from the peak in the year ending March 2006 (with 74,000 registrations that accounted for 26% of Non-EU registrations) until the year ending June 2014. Registrations from Africa were stable from the year ending December 2015 until the year ending December 2018, and have continued to increase until the year to March 2020 and have declined since
-
registrations from the Americas turbulently increased from the year ending December 2002 until they peaked in the year ending March 2009 (with 36,000 registrations that accounted for 12% of Non-EU registrations), and then declined until the year ending June 2014. Registrations from Americas were stable from the year ending December 2015 until the year ending September 2018, followed and an increase until the year ending September 2019 and have been decreasing ever since
-
registrations from Oceania peaked in December 2007 (with 35,000 registrations that accounted for 11% of Non-EU registrations), and have generally declined since
Nationals from Asia have always been the largest contributor of Non-EU registrations. Amongst the other world areas, the highest contributor of registrations since 2003 are nationals from Africa, followed by those from the Americas, Other Europe and Oceania.
The noticeable increase in registrations to Non-EU nationals after September 2018 until the beginning of 2020 is mostly due to registration for a NINo of adult dependants as part of certain VISA approvals.
NINo registrations by Non-EU world areas in the year to September 2020, change from previous year and annual percentage change
| Non-EU world area | Registrations to Sep 2019 | Registrations to Sep 2020 | Change from previous year | Annual Percentage Change |
|---|---|---|---|---|
| Other Europe | 28,000 | 20,000 | -7,500 | -27% |
| Asia | 170,000 | 140,000 | -30,000 | -18% |
| Africa | 48,000 | 39,000 | -9,100 | -19% |
| Americas | 35,000 | 22,000 | -14,000 | -39% |
| Oceania | 16,000 | 7,700 | -8,500 | -53% |
| Total Non-EU | 290,000 | 220,000 | -69,000 | -24% |
NINo registrations by Non-EU sub-group in the year to September 2020, change from previous year and annual percentage change
| Non-EU sub-group | Registrations to Sep 2019 | Registrations to Sep 2020 | Change from previous year | Annual Percentage Change |
|---|---|---|---|---|
| Other Europe | 28,000 | 20,000 | -7,500 | -27% |
| Middle East and Central Asia | 22,000 | 15,000 | -7,000 | -32% |
| East Asia | 23,000 | 15,000 | -8,100 | -35% |
| South Asia | 100,000 | 92,000 | -10,000 | -10% |
| South East Asia | 18,000 | 13,000 | -4,800 | -27% |
| Sub-Saharan Africa | 38,000 | 31,000 | -6,900 | -18% |
| North Africa | 10,000 | 8,200 | -2,200 | -21% |
| North America | 20,000 | 12,000 | -8,400 | -42% |
| Central and South America | 15,000 | 10,000 | -5,400 | -35% |
| Oceania | 16,000 | 7,700 | -8,500 | -53% |
| Total Non-EU | 290,000 | 220,000 | -69,000 | -24% |
In the year to September 2020, there were 220,000 NINo registrations by Non-EU nationals, a 24% decrease (69,000 less registrations) than the 290,000 registrations in the year to September 2019. Of which:
-
20,000 registrations were to nationals from Other Europe, a decrease of 27% since the year ending September 2019. Other European registrations now account for 9% of Non-EU registrations, which is the same proportion as the year ending September 2019
-
140,000 registrations were to nationals from Asia, a decrease of 18% since the year ending September 2019. Registrations from Asia now account for 60% of Non-EU registrations compared to 56% in the year ending September 2019
-
39,000 registrations were to nationals from Africa, a decrease of 19% since the year ending September 2019. Registrations from Africa now account for 18% of Non-EU registrations compared to 16% in the year ending September 2019
-
22,000 registrations were to nationals from the Americas, a decrease of 39% since the year ending September 2019. Registrations from the Americas now account for 10% of Non-EU registrations compared to 12% in the year ending September 2019
-
North American registrations to year ending September 2020 (12,000) experienced the largest year on year decrease and the second lowest annual number of registrations after those recorded in the year to December 2002
-
7,700 registrations were to nationals from Oceania, a decrease of 53% since the year ending September 2019. Oceanian registrations now account for 3% of Non-EU registrations compared to 6% in the year ending September 2019. Registrations to Oceanian nationals to the year ending September 2020 (7,700) are the lowest they have ever been since the start of the time series
-
the largest number of NINo registrations were to nationals from India (66,000), followed by nationals from Pakistan (16,000), Nigeria (11,000), China (9,200) and the United States (8,300)
Top 5 Non-EU individual nationalities, by number of registrations in the year to September 2020 and annual percentage change
| Non-EU Country | Registrations | Annual Percentage Change |
|---|---|---|
| India | 66,000 | -8% |
| Pakistan | 16,000 | -16% |
| Nigeria | 11,000 | -12% |
| China | 9,200 | -34% |
| United States | 8,300 | -42% |
In the year to September 2020, registrations by Non-EU nationals decreased by 24% from the previous year. The decrease was the result of decreases across all non-EU world areas, with Asia having the largest decrease.
Some nationalities within Non-EU did experience increases, however these increases accounted for small numbers of registrations and are not reflected at subgroup level. The five countries with the largest increases were El Salvador (increase of 170), Nepal (increase of 160), Somalia (increase of 90), Gambia (increase of 30) and Guinea-Bissau (increase of 20). The countries with the largest increases are from the Americas, Asia and Africa world areas.
The 5 countries with the largest decrease in registrations from the year ending September 2019 to year ending September 2020, were the United States (decreased by 6,100), Australia (decreased by 6,100), India (decreased by 5,900), China (decreased by 4,800) and Pakistan (decreased by 2,900). The decrease in registrations by nationals from India, China and Pakistan, accounted for 45% of the overall decrease in registrations by nationals from Asia. The decrease in registrations by nationals from the United States, accounted for 44% of the overall decrease in registrations by nationals from the Americas. The decrease in registrations by nationals from Australia and New Zealand accounted for 100% of the overall decrease in registrations by nationals from Oceania. The decrease in registrations from nationals from Nigeria, South Africa, Ghana and Eritrea, accounts for 58% of the overall decrease in registrations by nationals from Africa. The decrease in registrations from nationals from Albania, Russia, Ukraine and Switzerland accounts for 62% of the decrease in registrations by nationals from Other Europe.
Non-EU individual nationalities with the largest increase in registrations in the year to September 2020, change from previous year and annual percentage change
| Non-EU Country | Registrations to Sep 2019 | Registrations to Sep 2020 | Change from previous year | Annual Percentage Change |
|---|---|---|---|---|
| El Salvador | 130 | 300 | 170 | 127% |
| Nepal | 2,600 | 2,700 | 160 | 6% |
| Somalia | 1,200 | 1,200 | 90 | 8% |
| Gambia | 700 | 730 | 30 | 5% |
| Guinea-Bissau | 40 | 60 | 20 | 48% |
Non-EU individual nationalities with the largest decrease in registrations in the year to September 2020, change from previous year and annual percentage change
| Non-EU Country | Registrations to Sep 2019 | Registrations to Sep 2020 | Change from previous year | Annual Percentage Change |
|---|---|---|---|---|
| United States | 14,000 | 8,300 | -6,100 | -42% |
| Australia | 12,000 | 5,600 | -6,100 | -52% |
| India | 72,000 | 66,000 | -5,900 | -8% |
| China | 14,000 | 9,200 | -4,800 | -34% |
| Pakistan | 18,000 | 16,000 | -2,900 | -16% |
6.2 Recent changes in Non-EU Registrations
NINo registrations by Non-EU world areas in Q3 2020, compared to Q3 2019
| Non-EU world area | Registrations Q3 2019 | Registrations Q3 2020 | Change from Q3 2019 | Percentage Change from Q3 2019 |
|---|---|---|---|---|
| Other Europe | 8,800 | 2,400 | -6,400 | -73% |
| Asia | 44,000 | 16,000 | -27,000 | -62% |
| Africa | 13,000 | 5,300 | -8,200 | -61% |
| Americas | 10,000 | 3,300 | -6,700 | -67% |
| Oceania | 4,900 | 830 | -4,100 | -83% |
| Total Non-EU | 81,000 | 28,000 | -52,000 | -65% |
NINo registrations by Non-EU sub-group in Q3 2020, compared to Q3 2019
| Non-EU subgroup | Registrations Q3 2019 | Registrations Q3 2020 | Change from Q3 2019 | Percentage Change from Q3 2019 |
|---|---|---|---|---|
| Other Europe | 8,800 | 2,400 | -6,400 | -73% |
| Middle East and Central Asia | 6,500 | 1,900 | -4,600 | -71% |
| East Asia | 6,100 | 2,200 | -3,900 | -63% |
| South Asia | 26,000 | 10,000 | -16,000 | -60% |
| South East Asia | 5,100 | 2,100 | -3,000 | -59% |
| Sub-Saharan Africa | 10,000 | 3,800 | -6,600 | -63% |
| North Africa | 3,000 | 1,500 | -1,500 | -51% |
| North America | 5,300 | 2,200 | -3,100 | -58% |
| Central and South America | 4,600 | 1,000 | -3,600 | -78% |
| Oceania | 4,900 | 830 | -4,100 | -83% |
| Total Non-EU | 81,000 | 28,000 | -52,000 | -65% |
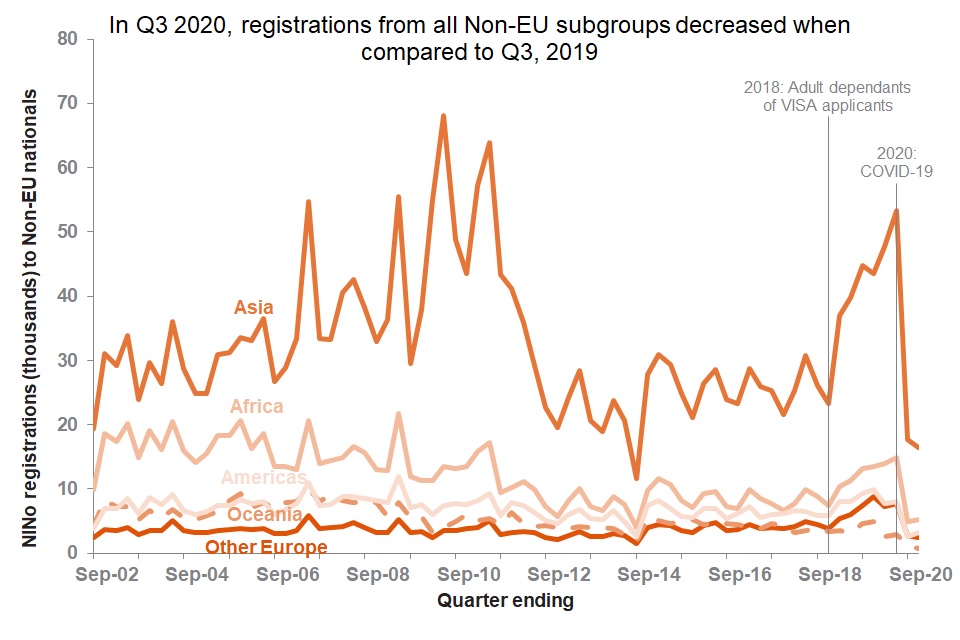
In Q3 2020 there were 28,000 NINo registrations by Non-EU nationals, the lowest number of registrations to Non-EU nationals in a quarter since Q2 2014.
Compared to the same quarter a year ago, in Q3 2020:
-
registrations to Other European nationals decreased by 73% from Q3 2019 to 2,400 registrations
-
registrations to Asian nationals decreased by 62% from Q3 2019 to 16,000 registrations
-
registrations to African nationals decreased by 61% from Q3 2019 to 5,300 registrations
-
registrations to nationals from the Americas decreased by 67% from Q3 2019 to 3,300 registrations
-
registrations to Oceanian nationals decreased by 83% from Q3 2019 to 830 registrations, the lowest number of Oceanian registrations in a quarter since the start of the time series
-
registrations to Central and South America were the lowest they had been in a quarter since the start of the time series
-
registrations to nationals from Other Europe, South Asia and Sub-Saharan Africa are the lowest they have been in a quarter since Q2 2014, when there were changes to the process of recording NINos. Registrations from Central and South America and Oceania are the lowest they have been since the beginning of the time series
-
registrations to nationals from Other Europe, Middle East and Central Asia, Central and South America and Oceania had the largest decrease between equivalent quarters of consecutive years since the start of the time series
-
the largest number of registrations in Q3 2020 were to nationals from India (7,000), followed by nationals from Pakistan (2,000), United States (1,700) Nigeria (1,500) and from China (1,100))
Top 5 Non-EU individual nationalities by number of registrations in Q3 2020 and percentage change from Q3 2019
| Non-EU Country | Registrations in Q3 2020 | Percentage Change from Q3 2019 |
|---|---|---|
| India | 7,000 | -59% |
| Pakistan | 2,000 | -63% |
| United States | 1,700 | -55% |
| Nigeria | 1,500 | -54% |
| China | 1,100 | -69% |
In Q3 2020, registrations by Non-EU nationals decreased by 65% from Q3 2019. Registrations to Non-EU nationals are the lowest they have been in a quarter since Q2 2014. The decrease was the result of decrease in registrations from nationals from all world areas, particularly from Asia.
The countries which had the largest increases in registrations only had very small increases and primarily had few registrations in Q3 2019. Countries which had the largest decrease in registrations were not from any one specific world area, and were countries which have previously had large numbers of registrations.
Between Q3 2019 and Q3 2020, the decrease in registrations from Asia was mostly the result of the decrease in registrations from India, Pakistan and China; the decrease in registrations from Oceania was mostly the results of the decrease in registrations from Australia. The decrease in registrations from Americas reflects the decrease in registrations from the United States.
Non-EU individual nationalities with the largest increase in registrations in Q3 2020, change in registrations from Q3 2019
| EU Country | Registrations Q3 2019 | Registrations Q3 2020 | Change from Q3 2019 | Percentage Change from Q3 2019 |
| Turkmenistan | 10 | 10 | +0 | +60% |
| Madagascar | 10 | 10 | +0 | +13% |
| Guatemala | 10 | 10 | +0 | +14% |
Non-EU individual nationalities with the largest decrease in registrations in Q3 2020, change in registrations and percentage change from Q3 2019
| EU Country | Registrations Q3 2019 | Registrations Q3 2020 | Change from Q3 2019 | Percentage Change from Q3 2019 |
| India | 17,000 | 7,000 | -10,000 | -59% |
| Pakistan | 5,600 | 2,000 | -3,500 | -63% |
| Australia | 3,400 | 610 | -2,800 | -82% |
| China | 3,700 | 1,100 | -2,600 | -69% |
| United States | 3,900 | 1,700 | -2,200 | -55% |
7. Where in the UK are people registering?
Almost half (49%) of all known UK registrations are in London or the South East.
All regions saw a year on year decrease in registrations.
Registrations to Northern Ireland are the lowest they have been since the year ending June 2004, registrations to London and the South East are the lowest they have been since year ending September 2004 and registrations to the South West and Wales are the lowest they have been since December 2004.
London experienced the largest decrease in registrations between the year ending September 2019 and year ending September 2020, with a decrease in 110,000 registrations. The North East experienced the smallest decrease in registrations, with a decrease of 2300 registrations from September 2019, as a percentage of total registrations, registrations to the North East are the largest they have been since the beginning of the time series in 2002, with 2% of all registrations.
All regions apart from the North East experienced their largest year on year percentage decrease in registrations since the beginning of the time series.
EU and Non-EU NINo registrations in the year to September 2020, by region
| Region | Non-EU | EU |
|---|---|---|
| London | 79,000 | 88,000 |
| South East | 24,000 | 26,000 |
| East of England | 16,000 | 19,000 |
| North West | 20,000 | 15,000 |
| West Midlands | 18,000 | 16,000 |
| Scotland | 13,000 | 14,000 |
| East Midlands | 14,000 | 12,000 |
| Yorkshire and The Humber | 13,000 | 11,000 |
| South West | 9,400 | 12,000 |
| Wales | 6,600 | 2,800 |
| North East | 5,500 | 3,700 |
| Northern Ireland | 1,400 | 3,600 |
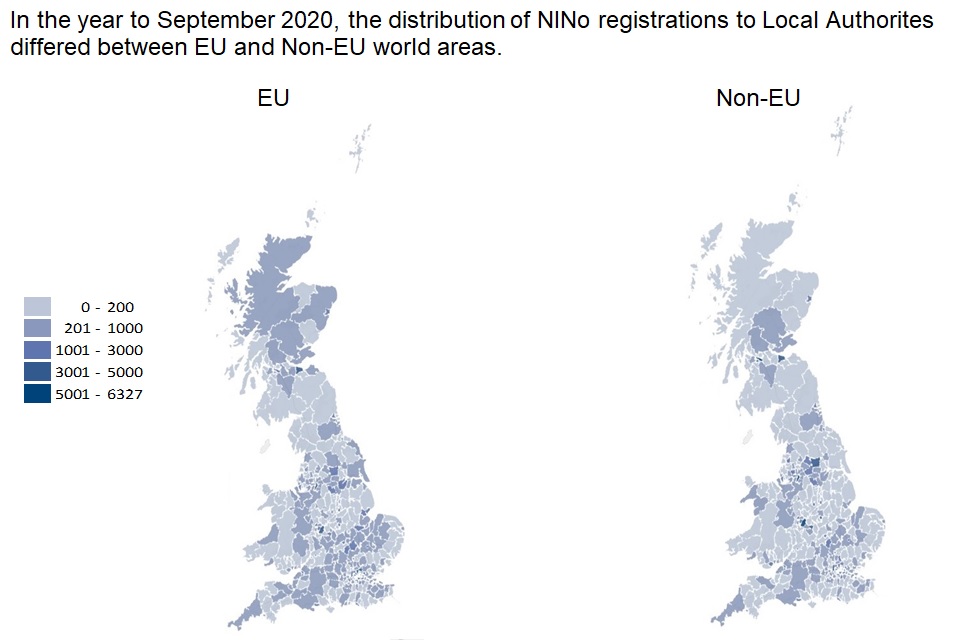
In the year to September 2020, the number of registrations to EU and Non-EU applicants were quite similar (with Non-EU having only 250 more registrations than EU) but the distribution across Local Authorities differed. There were more registrations from non-EU nationals than EU nationals in Scotland, however, 24 out of the 32 Scottish local authorities had more registrations from EU nationals than Non-EU nationals. The Scottish local authority with the largest difference in registrations between EU and Non-EU nationals was Glasgow, with 5,500 registrations from Non-EU nationals and 2,200 registrations from EU nationals.
Please note that the interactive version of the local authority map showing NINo registrations from different world areas by GB local authority, has not been updated since February 2020 due to a change in work environments as a result of the COVID-19 pandemic.
Top 10 local authorities by number of NINo registrations in the year to September 2020
| Local Authorities | Registrations |
|---|---|
| Newham | 13,000 |
| Birmingham | 11,000 |
| Tower Hamlets | 11,000 |
| Brent | 10,000 |
| Manchester | 8,300 |
| Glasgow City | 7,800 |
| Ealing | 7,800 |
| City of Edinburgh | 7,400 |
| Westminster | 7,100 |
| Haringey | 6,800 |
8. About these statistics
National Statistics Status
The UK Statistics Authority has re-designated these statistics as National Statistics, at November 2020, in accordance with the Statistics and Registration Service Act 2007 and signifying compliance with the Code of Practice for Statistics.
National Statistics status means that our statistics meet the highest standards of:
- trustworthiness
- quality
- public value
Once statistics have been designated as National Statistics it is our responsibility to maintain compliance with these standards.
World Areas
For reporting purposes, countries have been grouped into ‘world areas’ based primarily on geographical location. Countries are grouped according to current world area status for the entire back series.
| World Area | Sub Group |
|---|---|
| European Union (EU) | European Union EU15 (original EU members), European Union EU8 (joined EU in 2004), European Union EU2 (joined EU in 2007), European Union Other |
| Non-European Union (Other Europe) | Other Europe |
| Asia | Middle East and Central Asia, East Asia, South Asia, South East Asia |
| Africa | Sub-Saharan Africa, North Africa |
| Americas | North America, Central and South America |
| Oceania | Oceania |
A detailed nationality breakdown for each world area is available in the supplementary data tables accompanying this release.
Where to find out more
Read previous releases of these statistics.
Read further information for this series, including detail on data sources, uses, quality and limitations of the series.
Full statistics on NINo allocations to adult overseas nationals entering the UK are available from Stat-Xplore.
Please note that the interactive map showing NINo registrations from different world areas by GB local authority, has not been updated since February 2020 due to a change in work environments as a result of the COVID-19 pandemic.
Read about the NINo application process.
Also published by the Office for Nationals Statistics (ONS) today (26 November 2020) is a report on International migration and travel mobility: What’s changed since the coronavirus pandemic and an update on population and migration transformation overview.
Enquires and feedback
DWP would like to hear your views on our statistical publications. If you use any of our statistics publications, we would be interested in hearing what you use them for and how well they meet your requirements: Send your comments by email to: stats-consultation@dwp.gov.uk.
Press enquiries should be directed to the DWP Press Office, telephone: 0203 267 5144.
Enquiries about these statistics should be directed by email to:
Producer of this release: dominique.radcliffe@dwp.gov.uk
Responsible statistician: yolanda.ruizrodriguez@dwp.gov.uk
ISBN: 978-1-78659-279-8