National Infrastructure Pipeline factsheet July 2015
Updated 10 August 2015

© Crown copyright 2015
This publication is licensed under the terms of the Open Government Licence v3.0 except where otherwise stated. To view this licence, visit nationalarchives.gov.uk/doc/open-government-licence/version/3 or write to the Information Policy Team, The National Archives, Kew, London TW9 4DU, or email: psi@nationalarchives.gov.uk.
Where we have identified any third party copyright information you will need to obtain permission from the copyright holders concerned.
This publication is available at https://www.gov.uk/government/publications/national-infrastructure-pipeline-july-2015/national-infrastructure-pipeline-factsheet-july-2015
1. Background
The infrastructure pipeline provides a bottom-up assessment of planned investment in infrastructure, across both public and private sectors. The pipeline enhances visibility and certainty for investors and the supply chain and allows government to work more effectively to ensure that the UK’s infrastructure needs are met.
The pipeline includes large capital projects and programmes of investment worth £50 million or more[footnote 1]. Programmes represented in the pipeline may consist of a number of smaller projects grouped together. These are often rolling investments, such as national programmes of ongoing repair and maintenance of our utilities networks and regional flood defence programmes.
The pipeline provides a strategic overview of the level of planned infrastructure investment. The pipeline is not a statement of need or a commitment to undertake all of the projects shown. The publicly funded elements of the infrastructure pipeline represent announced projects.
The pipeline provides a strategic overview of the level of planned infrastructure investment. The pipeline is not a statement of need or a commitment to undertake all of the projects shown. The publicly funded elements of the infrastructure pipeline represent announced projects. In privately funded sectors, the decision to go ahead with individual projects will be determined by the market. However, the pipeline for regulated sectors is consistent with regulatory settlements, where agreed.
2. Pipeline facts
- The value of the refreshed infrastructure pipeline is £411 billion[footnote 2], consisting of projects and programmes from within the Energy, Transport, Waste, Flood Defence, Communications, Water and Science and Research sectors
-
The pipeline annual spending figures are expected to average around £48 billion over the next 5 years
-
There are 564 projects and programmes in the pipeline (265 programmes and 299 projects)
-
£264 billion (64%) of the pipeline is expected to be funded solely by the private sector. Private sector funding comes from a range of sources, including: user charges and external financing contributions
-
£46 billion (11%) of projects have mixed private/public funding, with the remaining £101 billion (25%) of the pipeline publicly funded (by taxpayers)
-
The two largest sectors, Energy (£245 billion, 60%) and Transport (£127.4 billion, 31%) account for 91% of the pipeline’s total value
-
60% of the projects and programmes within the pipeline are either in construction or part of an active programme
-
£199 billion (49%) of projects and programmes are monitored as part of the government’s Top 40 priority infrastructure investments
-
53% of key projects and programmes within the Top 40 priority infrastructure investments are either in construction or part of an active programme
| Sector | Number of programmes | Number of projects | Overall value (£m) |
|---|---|---|---|
| Communications | 5 | 1 | 6,997 |
| Energy | 56 | 102 | 244,867 |
| Flood | 22 | 5 | 3,512 |
| Science and Research | 5 | 21 | 1,375 |
| Transport | 149 | 153 | 127,440 |
| Waste | 0 | 16 | 1,088 |
| Water | 28 | 1 | 25,677 |
| Total | 265 | 299 | 410,958 |
| Source: HM Treasury Major Infrastructure Tracking unit. Overall values from 2015-16 and beyond |
3. Delivery since NIP2014
69 projects and programmes in the pipeline as at National Infrastructure Pipeline December 2014, including regulatory control periods in the water and energy sectors, have been removed, as they have completed.
3.1 Significant projects and programmes, which have completed include:
-
Energy * Gwynt Y Mor Offshore Wind Farm and OFTO * Westermost Rough OFTO * Humber Gateway OFTO * 1167MW solar PV installed in FY 2014/15
-
Transport * Northern Line upgrade (phase 1) * A11 Fiveways to Thetford
-
Science and Research * National Graphene Institute (NGI)
3.2 Significant projects and programmes, which have started include:
- Transport * Sunderland Strategic Corridor * A6 to Manchester Airport Relief Road * A5-M1 Link Road * A30 Temple Carblake * M25 Junction 30 * A160 / A180 Immingham * A21 Tonbridge to Pembury
3.3 Significant projects and programmes reaching major milestones include:
-
Energy * the first Contracts for Difference auction has concluded and the resulting projects have been included in the pipeline
-
Transport * Crossrail: Tunnelling has been completed and the project is focussing on fitting out the railway * Inter City Express Programme: UK testing of new rolling stock has commenced
-
Water * Thames Tideway Tunnel: Investment partner announced
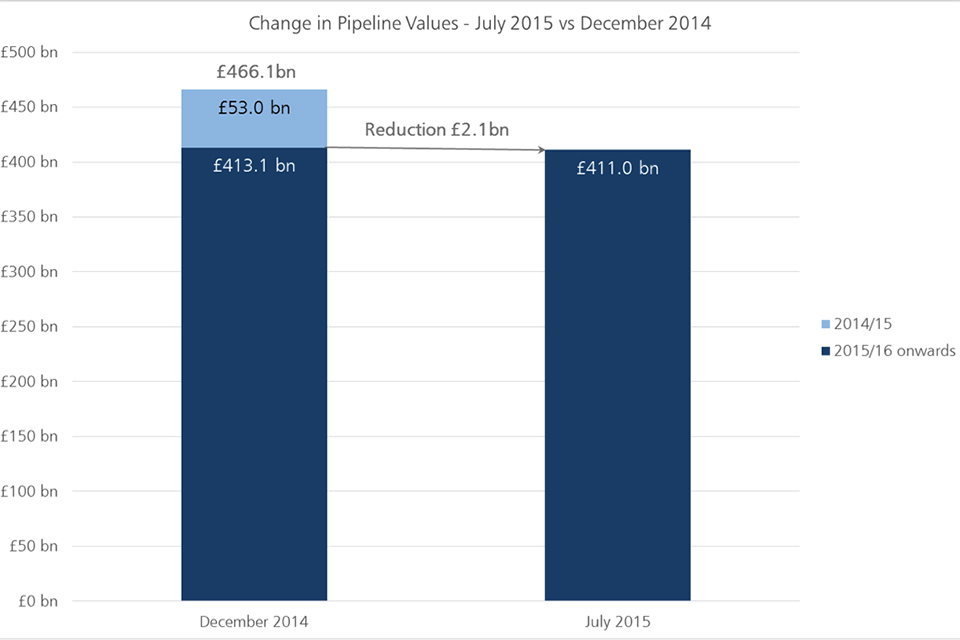
4. Movement on the December 2014 pipeline
The December 2014 pipeline was valued at £466 billion. Since it was published, the 2014-15 financial year has drawn to a close. Projects and programmes valued at £53 billion for 2014-15 have now been removed from the pipeline. The value of the December 2014 pipeline, covering 2015-16 onwards, was £413 billion.
The current pipeline value from 2015-16 onwards is £411 billion. The reduction of £2.1 billion is mainly due to a lower value Energy pipeline, caused primarily by falling private sector oil and gas investment, offset by additional Transport, Communications and Science and Research investment.
Change in pipeline values
4.1 Significant changes to the composition of the pipeline include:
- a 10% reduction in planned private sector oil and gas investment, following a fall in global oil prices
- increased investment in the communication sector, reflecting investment announcements from Virgin Media, EE and other mobile network operators
- inclusion of Manchester City Airport’s £1 billion 10-year investment programme
5. Regional picture
- projects and programmes in the pipeline are distributed across the UK, with over 40% percent of projects attributed to specific regions and devolved administrations
5.1 Pipeline investment data: Number of regional projects and programmes
| Region | In construction / active programme | Total |
| East Midlands | 17 | 35 |
| East of England | 19 | 31 |
| North East | 17 | 27 |
| North West | 42 | 76 |
| South East | 36 | 63 |
| South West | 23 | 34 |
| West Midlands | 21 | 39 |
| Yorkshire & the Humber | 22 | 33 |
| London | 39 | 61 |
| Total | 236 | 399 |
-
Around £130 billion is allocated to the English regions, and more than £30 billion allocated to Scotland, Wales and Northern Ireland combined (to note: the pipeline does not include any infrastructure investment in sectors which are devolved responsibilities).
-
The remainder of the pipeline (worth around £250 billion) consists of projects and programmes where funding profiles have not yet been confirmed or will benefit more than one region, either because they will be delivered across multiple regions (eg High Speed 2) or they are national programmes (such as the rollout of superfast broadband).
5.2 The value of the refreshed pipeline is £411 billion, with Energy and Transport the largest sectors
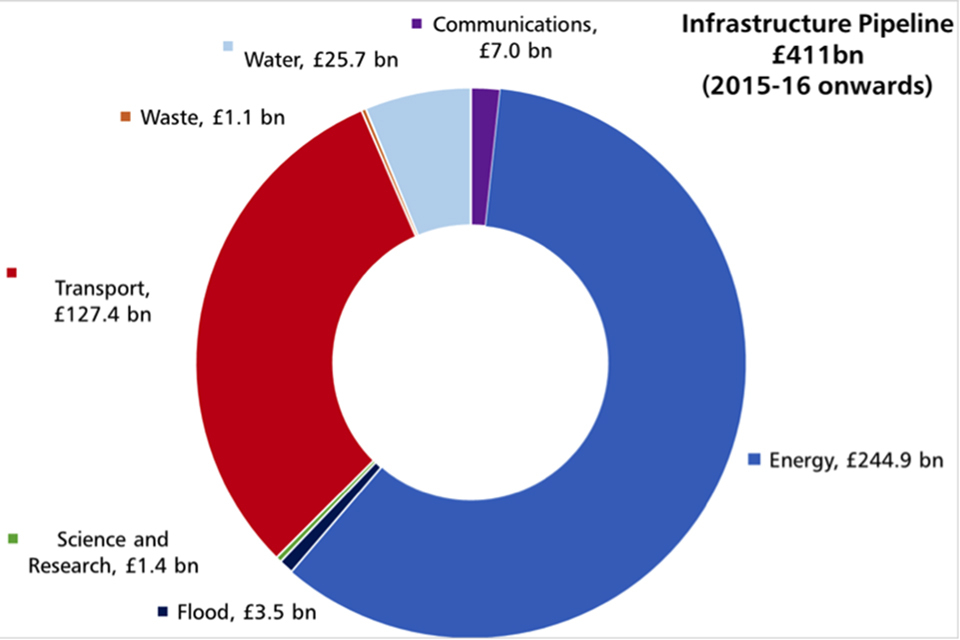
Infrastructure pipeline piechart
5.3 £264 billion (64%) of the pipeline is expected to be funded solely by the private sector
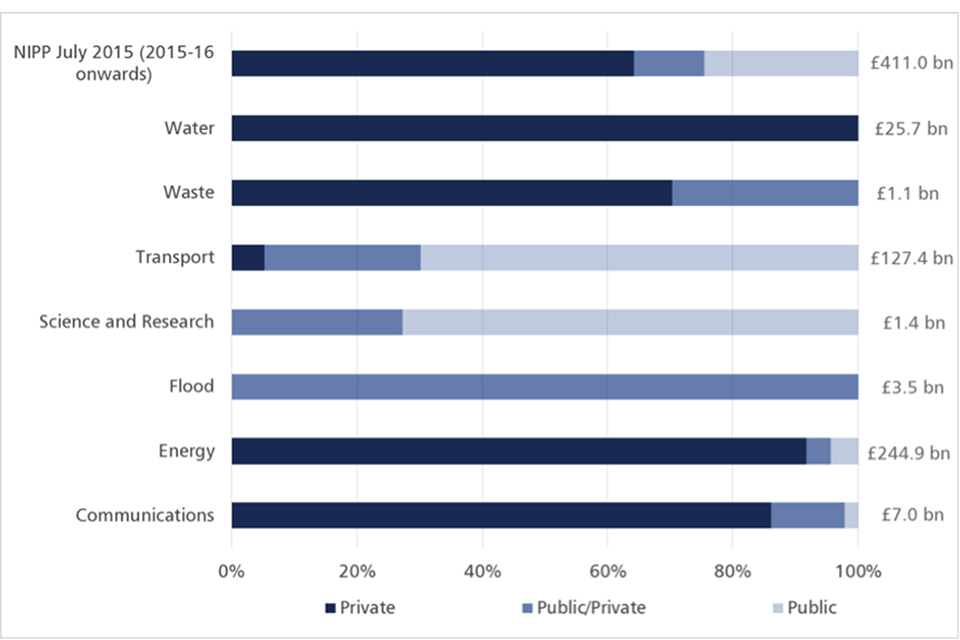
NIPP July 2015-6
5.4 60% of projects are either within active programmes or in construction[footnote 3]
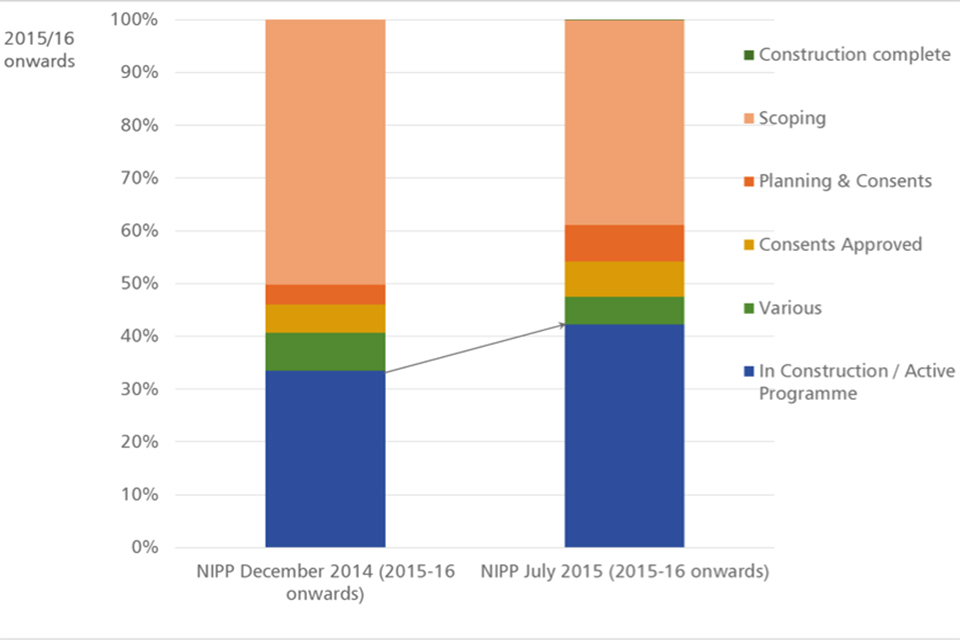
July 2015 compared to December 2014 infrastructure progress
-
Some exceptions have been made to include project and programmes with capital spends lower than £50 million to provide greater visibility of the types of schemes being progressed within sectors. ↩
-
All pipeline values are quoted in constant prices (base year 2013-14) and so do not include the effects of future inflation ↩
-
A status of Various indicates where projects within a particular programme are at different stages of development and the programme cannot yet be considered to be active. ↩