MRC Biostatistics Unit and PHE: Estimates of COVID-19 hospitalised mortality and length of stay: data from March 2020 to September 2021, 7 December 2021
Published 23 December 2021

© Crown copyright 2021
This publication is licensed under the terms of the Open Government Licence v3.0 except where otherwise stated. To view this licence, visit nationalarchives.gov.uk/doc/open-government-licence/version/3 or write to the Information Policy Team, The National Archives, Kew, London TW9 4DU, or email: psi@nationalarchives.gov.uk.
Where we have identified any third party copyright information you will need to obtain permission from the copyright holders concerned.
This publication is available at https://www.gov.uk/government/publications/mrc-biostatistics-unit-and-phe-estimates-of-covid-19-hospitalised-mortality-and-length-of-stay-data-from-march-2020-to-september-2021-7-december-20/mrc-biostatistics-unit-and-phe-estimates-of-covid-19-hospitalised-mortality-and-length-of-stay-data-from-march-2020-to-september-2021-7-december-20
Peter Kirwan, Andre Charlett, Paul Birrell, Suzanne Elgohari, Russell Hope, Sema Mandal, Daniela De Angelis, Anne Presanis
MRC Biostatistics Unit, Cambridge and UKHSA, London
1. Summary
-
Hospitalised case-fatality risk was elevated during periods of peak COVID-19 incidence and hospital demand (for example March 2020 and January 2021).
-
Since March 2021, hospitalised case-fatality risk has been maintained at or below 10 per cent and median lengths of stay in hospital have remained relatively stable.
-
After controlling for other factors, outcomes for single and double vaccinated patients were significantly improved compared to unvaccinated patients.
2. Introduction
We apply competing risks methods to comprehensive public health surveillance data on patients hospitalised with COVID-19 in England between March 2020 and September 2021. Hospital-onset COVID-19 cases were excluded.
Primary data sources were the Secondary Uses Service (SUS) dataset, linked to the emergency Care Dataset for England (ECDS). Complete information on deaths and vaccination was obtained through linkage to the UKHSA deaths and National Immunisation Management Service (NIMS) datasets.
Two complementary statistical analyses were undertaken to understand both the absolute and relative risks of hospitalised fatality. Aalen-Johansen cumulative incidence estimation was used to obtain estimates of cumulative hospitalised case-fatality risk (HFR) and median lengths of stay in hospital for specific sub-sets of the population, unadjusted for other factors. Stratified Fine-Grey competing risk regression with adjustment for confounders was used to estimate the association of each risk factor with the cumulative incidence of hospitalised fatality.
Variables considered in the regression analysis included: month of admission, vaccination status, age group, region of residence, sex, ethnicity, deprivation (IMD quintile), hospital load and baseline Charleson comorbidity index (CCI).
3. Hospitalised case-fatality risk
Among a total of 259,727 individuals hospitalised with COVID-19, 51,948 (20.0 per cent) experienced mortality in hospital, with the remainder being discharged or remaining in hospital at the end of September 2021.
Figure 1 presents monthly HFR estimates. HFR decreased during the first wave of the pandemic from 40.3 per cent (95 per cent confidence interval: 39.4 to 41.3 per cent) in March 2020 to 12.3 per cent (10.3 to 14.8 per cent) in August 2020. During the second wave HFR increased to a peak of 22.8 per cent (22.5 to 23.2 per cent) in January 2021, although by March 2021 had halved to 10.5 per cent (9.7 to 11.4 per cent) and was maintained at or below 10 per cent throughout subsequent months.
4. Length of stay
Median time to discharge decreased throughout the first wave, from 5.9 (5.8 to 6.0) days in March 2020 to 3.1 (2.9 to 3.3) days in August 2020. Median time to discharge peaked again at 5 (5 to 5.1) days in December 2020, before falling to 2.7 (2.6 to 2.8) days by June 2021. (Figure 1).
Meanwhile, median stay prior to death increased from 5.6 (5.5 to 5.6) days to 9.9 (9.2 to 10.9) days between March 2020 and August 2020, shortened to 7.5 (7.5 to 7.6) days in January 2021, and lengthened to 10.4 (10.1 to 10.8) days by June 2021. (Figure 1).
5. Hazard of hospitalised fatality
The hazard ratio for hospitalised fatality was increased during March to May 2020, September 2020 to February 2021, and June to September 2021, as compared to June 2020. (Figure 2).
The hazard ratio for mortality following hospital admission was 0.72 (0.67 to 0.77) among those admitted more than 21 days post first vaccine, and 0.58 (0.54 to 0.62) for those admitted more than 14 days post second vaccine, compared to a reference category of unvaccinated (Figure 3).
Hazard ratios for hospitalised fatality were greater for those of Asian (1.19 (1.15 to 1.23)) and Mixed, Other or Unknown ethnicity (1.06 (1.01 to 1.12) compared to White. Males had a greater hazard compared to females (1.29 (1.27, 1.32)), and compared to no comorbidities those with a higher burden of comorbidity had a greater hazard of hospitalised mortality (3.1 (2.98 to 3.22) for CCI of 5 or above). Those residing in more deprived quintiles had greater hazards for hospitalised mortality (1.13 (1.09, 1.16) for the most deprived quintile) compared to a reference of least deprived. (Figure 4).
Hazards ratios increased with increased hospital load, to 1.23 (1.17 to 1.28) for load at 80 to 90 per cent of the busiest week and 1.21 (1.16 to 1.27) for load at 90 to 100 per cent of the busiest week (compared to 0 to 20 per cent load). (Figure 4).
6. Interpretation
The prognosis for patients hospitalised with COVID-19 in England has varied substantially throughout the pandemic and is confounded with age, sex, region, ethnicity, deprivation, baseline comorbidity, vaccination status, and hospital load at admission.
The reduction in HFR during early-2021 is estimated against a backdrop of national lockdown restrictions, reduced hospital load, and very high uptake of COVID-19 vaccines among those in the oldest two age groups. Changes in outcomes of patients admitted to hospital should continue to be closely monitored as subsequent vaccine doses are rolled out and new variants emerge.
Figure 1: Hospitalised fatality risk and median length of stay by month of admission. Estimated by Aalen-Johansen cumulative incidence estimator, for the competing outcomes of death and discharge. Error bars are 95 per cent confidence intervals.
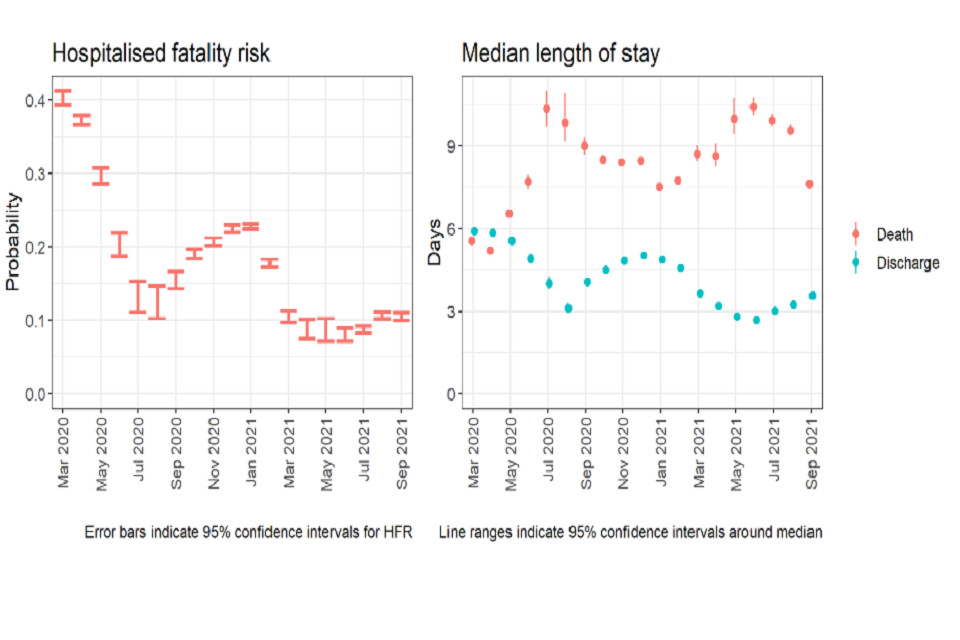
The estimated hospitalised fatality risk by month is shown to fall from around 0.4 in March 2020 to around 0.13 in July 2020, then rise to around 0.23 in January 2021, then fall to around 0.1 by April 2021, and be maintained around this level until September 2021. Median length of stay until death by month is shown to increase from around 6 days in March 2020 to 10 days in July 2020, then fall to around 7 days in January 2021, rise to 10 days by June 2021, and then fall to around 7 days by September 2021. Median length of stay until discharge by month is shown to decrease from around 6 days in March 2020 to 3 days in August 2020, then rise to around 5 days in December 2020, and then remain around 3-4 days between April and September 2021.
Figure 2: Hospitalised fatality sub-distribution hazard ratio by month of hospital admission, stratified by age group, region of residence and vaccination status, with regression adjustment (main effects) on sex, ethnicity, IMD quintile, hospital load, and CCI. Reference group: June 2020.
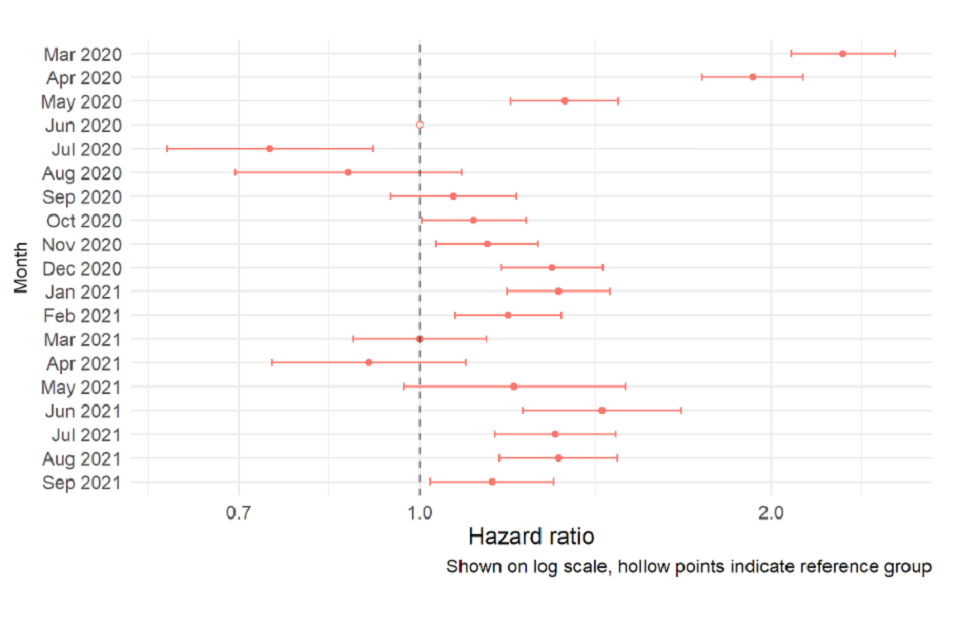
The estimated hazard of hospitalised fatality is shown to vary by month. Compared to the reference of June 2020, the hazard ratio for hospitalised fatality was increased during March to May 2020, September 2020 to February 2021, and June to September 2021.
Figure 3: Hospitalised fatality sub-distribution hazard ratio by vaccine status for January to September 2021, stratified by age group, region of residence and month of hospital admission, with regression adjustment (main effects) on sex, ethnicity, IMD quintile, hospital load, and CCI. Reference group: Unvaccinated.
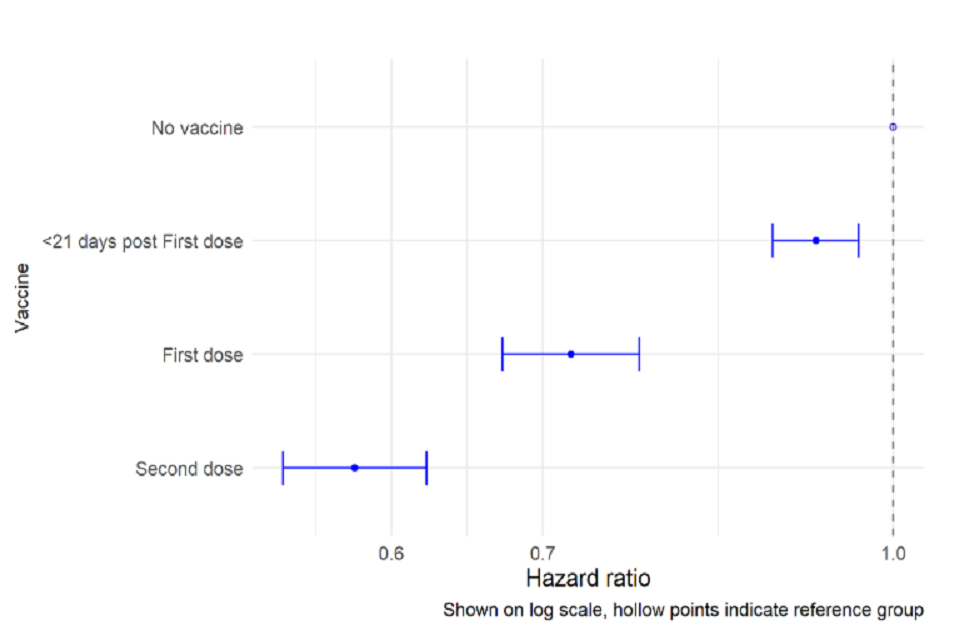
The estimated hazard of hospitalised fatality is shown to vary according to vaccination status. Compared to the reference of no vaccine, each additional dose reduces the hazard of hospitalised fatality, to 0.72 (0.67 - 0.77) among those admitted >21 days post first vaccine, and 0.58 (0.54 - 0.62) for those admitted >14 days post second vaccine.
Figure 4: Hospitalised fatality sub-distribution hazard ratios for sex, ethnicity, IMD quintile, hospital load and CCI, stratified by age group, region of residence and vaccination status, with regression adjustment (main effects) on month of admission (shown in Figure 2).
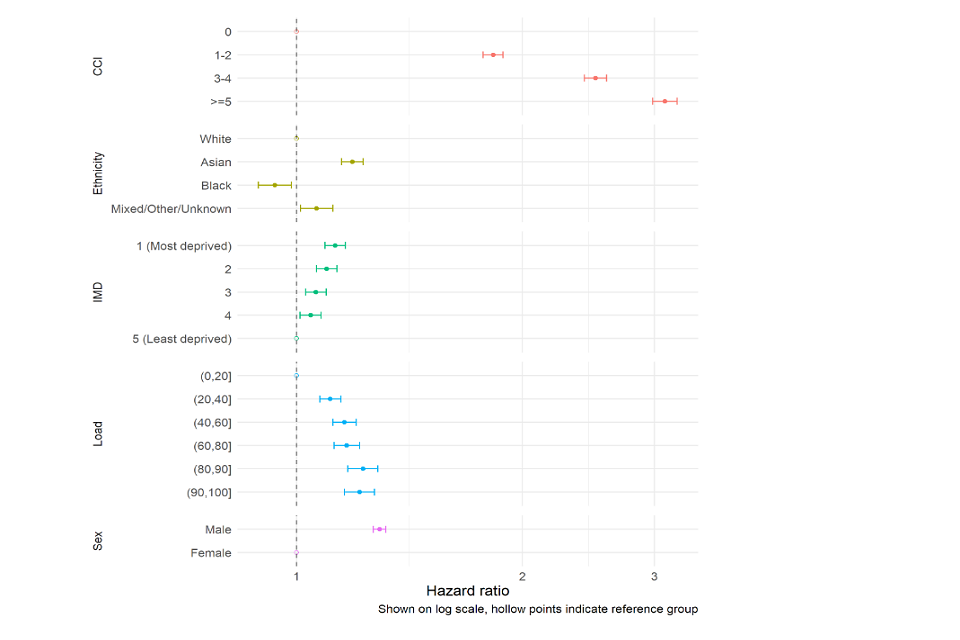
Estimated hazards of hospitalised fatality according to comorbidity, ethnicity, deprivation, hospital load, and sex are shown, as described in the text.