EMHP wastewater monitoring of SARS-CoV-2 in England: 15 July 2020 to 30 March 2022
Published 12 May 2022
Applies to England

© Crown copyright 2022
This publication is licensed under the terms of the Open Government Licence v3.0 except where otherwise stated. To view this licence, visit nationalarchives.gov.uk/doc/open-government-licence/version/3 or write to the Information Policy Team, The National Archives, Kew, London TW9 4DU, or email: psi@nationalarchives.gov.uk.
Where we have identified any third party copyright information you will need to obtain permission from the copyright holders concerned.
This publication is available at https://www.gov.uk/government/publications/monitoring-of-sars-cov-2-rna-in-england-wastewater-monthly-statistics-15-july-2020-to-30-march-2022/emhp-wastewater-monitoring-of-sars-cov-2-in-england-15-july-2020-to-30-march-2022
Data showing the concentration of SARS-CoV-2 RNA and variants of concern (VOC) and variants under investigation (VUI) detected in wastewater by the Environmental Monitoring for Health Protection (EMHP) wastewater monitoring programme.
The EMHP SARS-CoV-2 wastewater monitoring programme was scaled down and paused at the end of March 2022. Wastewater Based Epidemiology is likely to be of significant importance in the future, both domestically and internationally, and we are exploring further opportunities for this technology.
These publications are therefore being discontinued. Transparency data covering the time period up to the end of March 2022 is included in this publication after which regular publications will cease. Any future ad-hoc transparency publications will be announced in advance on this page and on the Statistics at UKHSA page.
Note: As of 1 April 2022, previous variants of concern which no longer meet the criteria for VOC label according to the UK Health Security Agency (UKHSA) variant classification system have been redesignated. New variants of note based on genomic features, vaccine escape and growth, now receive a variant number (V-date-number).
Background on the Environmental Monitoring for Health Protection (EMHP) wastewater monitoring programme
People infected with coronavirus (COVID-19) shed the virus during daily activities such as going to the toilet and blowing their nose. The virus enters the sewer system through sinks, drains and toilets. Fragments of SARS-CoV-2 (the virus that causes COVID-19) can be detected in samples of wastewater (untreated sewage).
The EMHP programme is led by the UKHSA and run in partnership with the Department for Environment, Food and Rural Affairs (Defra), the Environment Agency (EA), the Centre for Environment, Fisheries and Aquaculture Science (Cefas), academia, and water companies. It provides coverage of approximately 74% of the population in England. The EMHP team coordinates with programmes in the devolved administrations to provide UK-wide wastewater monitoring.
The programme tests sewage for fragments of SARS-CoV-2 RNA. Untreated influent samples are taken from approximately 302 Sewage Treatment Works in England, 3 times a week (see figures 1 to 9). EMHP also sample from sewer network sites (manholes), untreated influent samples are taken from approximately 197 sewer network sites in England, 4 times a week.
Data from sewer network sites are included in the ‘Detection of the Omicron variant in wastewater samples; 22 November 2021 to 27 March 2022’ section of this publication to ensure continuity with previous publications. Data from sewer network sites are not included in the rest of this publication as these sites generally fall within STW catchments.
As the threat of variants has emerged, the programme has played a key role in the detection of mutations of the virus, including those associated with known variants of concern (VOC), and variants under investigation (VUI). This is achieved through genomic sequencing of wastewater samples, to provide an indication of where VOCs and VUIs may be present across England.
Findings are reported to national decision makers and local stakeholders on a regular basis, helping to inform national strategy and localised action. Wastewater analysis has the benefit of detecting the virus regardless of whether people have symptoms or whether they are tested. Wastewater monitoring complements other testing programmes and public health actions to help protect against the threat of new variants.
The data presented in this publication are generated by non-accredited research laboratories and should be considered experimental. Formal validation of wastewater monitoring as a variant surveillance system is underway. EMHP advise caution when directly comparing data from Sewage Treatment Works and concentration of SARS-CoV-2 RNA in wastewater with clinical testing data. Wastewater detections of a variant are reported as either confirmed or possible, based on the number of signature or unique SNPs, and co-occurrence on the same amplicon.
This describes the level of confidence EMHP has in the specificity of the detection; ‘confirmed’ status is assigned when there is a high degree of confidence the variant was present in the wastewater sample, ‘possible’ is assigned where there is some evidence that the variant was present.
These definitions are different to the clinical case definitions and the 2 should not be compared. Lack of a positive wastewater sequencing result is not necessarily confirmation that no variant cases reside within a given geography, due to factors such as rainfall dilution impacting RNA recovery.
Interpretation of all data in this publication should be made with careful consideration of the points in the ‘Uncertainty, data quality, and revisions’ section.
EMHP sampling sites
EMHP sample at sewer network sites (manholes in the street which generally serve a local area) and Sewage Treatment Works (which generally serve wider areas such as a city or town). Associated with every Sewage Treatment Works and sewer network site is a catchment, the geographical area from which wastewater flows into the sampling location. EMHP SARS-CoV-2 RNA concentrations data from sewer network sites are not included in this publication as these sites generally fall within STW catchments.
In addition, EMHP change sampling strategy and locations of sewer network sites to meet epidemiological priorities (for example to support local public health responses). Further detail about EMHP wastewater coverage can be found in this publication.
Figures 1 to 9 show the location of Sewage Treatment Works that EMHP sample at in each region.
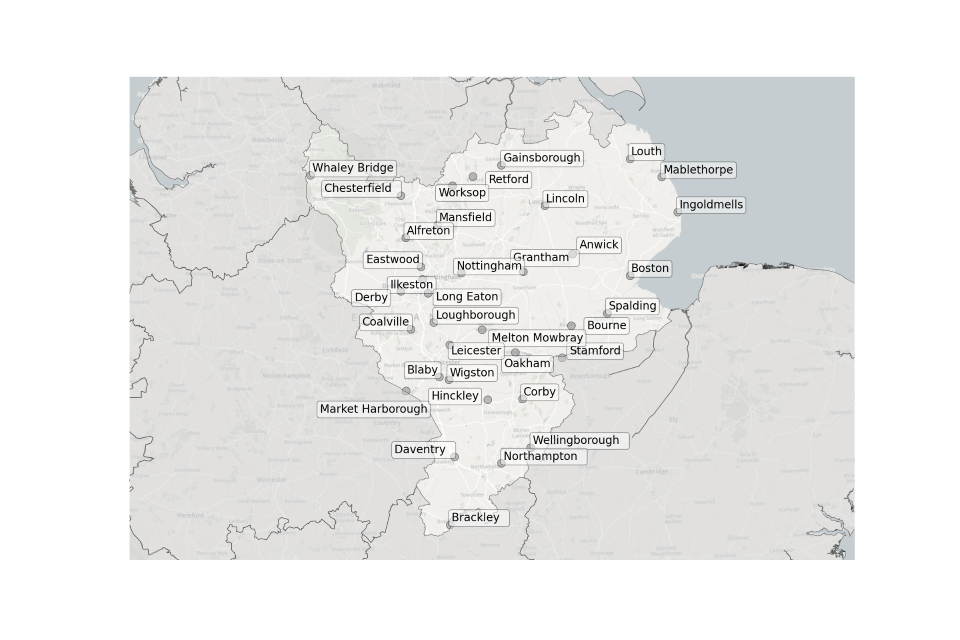
Figure 1. Map showing the location of Sewage Treatment Works sampled in the East Midlands.
Location of STWs sampled in the East Midlands:
- Alfreton
- Anwick
- Blaby
- Boston
- Bourne
- Brackley
- Chesterfield
- Coalville
- Corby
- Daventry
- Derby
- Eastwood
- Gainsborough
- Grantham
- Hinckley
- Ilkeston
- Ingoldmells
- Leicester
- Lincoln
- Long Eaton
- Loughborough
- Louth
- Mablethorpe
- Market Harborough
- Mansfield
- Melton Mowbray
- Northampton
- Nottingham
- Oakham
- Retford
- Spalding
- Stamford
- Wellingborough
- Whaley Bridge
- Wigston
- Worksop
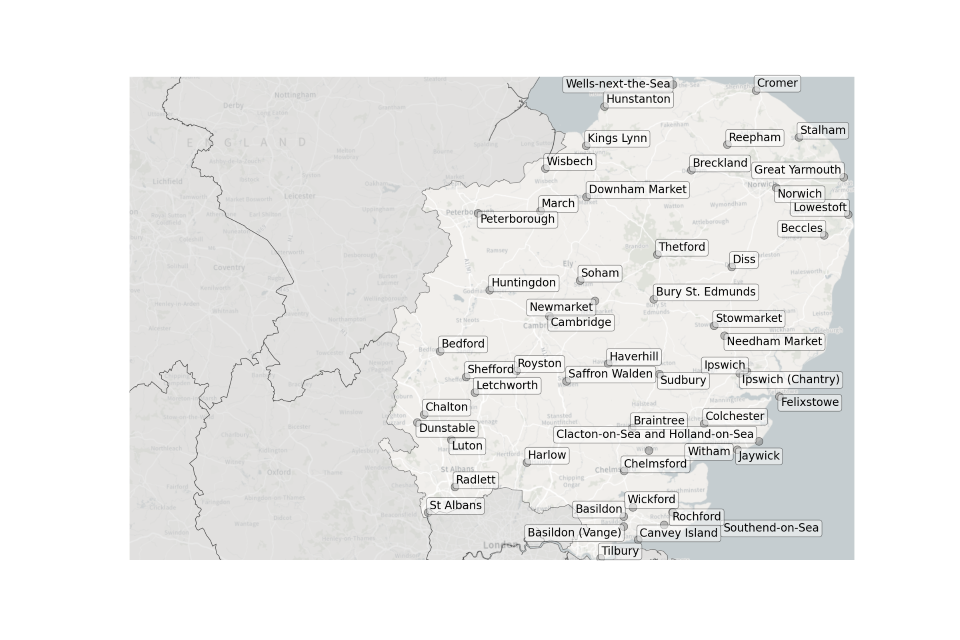
Figure 2. Map showing the location of Sewage Treatment Works sampled in the East of England.
Location of STWs sampled in the East of England:
- Basildon
- Basildon (Vange)
- Beccles
- Bedford
- Braintree
- Breckland
- Bury St Edmunds
- Cambridge
- Chalton
- Chelmsford
- Colchester
- Cromer
- Diss
- Downham Market
- Felixstowe
- Great Yarmouth
- Harlow
- Haverhill
- Hunstanton
- Huntingdon
- Ipswich
- Ipswich (Chantry)
- Jaywick
- Kings Lynn
- Letchworth
- Lowestoft
- Luton
- March
- Needham Market
- Newmarket
- Norwich
- Peterborough
- Radlett
- Reepham
- Rochford
- Royston
- Saffron Walden
- Shefford
- Soham
- St Albans
- Stalham
- Stowmarket
- Sudbury
- Southend-on-Sea
- Thetford
- Tilbury
- Wells-next-the-Sea
- Wickford
- Wisbech
- Witham

Figure 3. Map showing the location of Sewage Treatment Works sampled in London.
Location of STWs sampled in London:
- Beckton
- Beddington
- Crossness
- Deepham
- Hogsmill Valley
- Long Reach
- Mogden
- Riverside
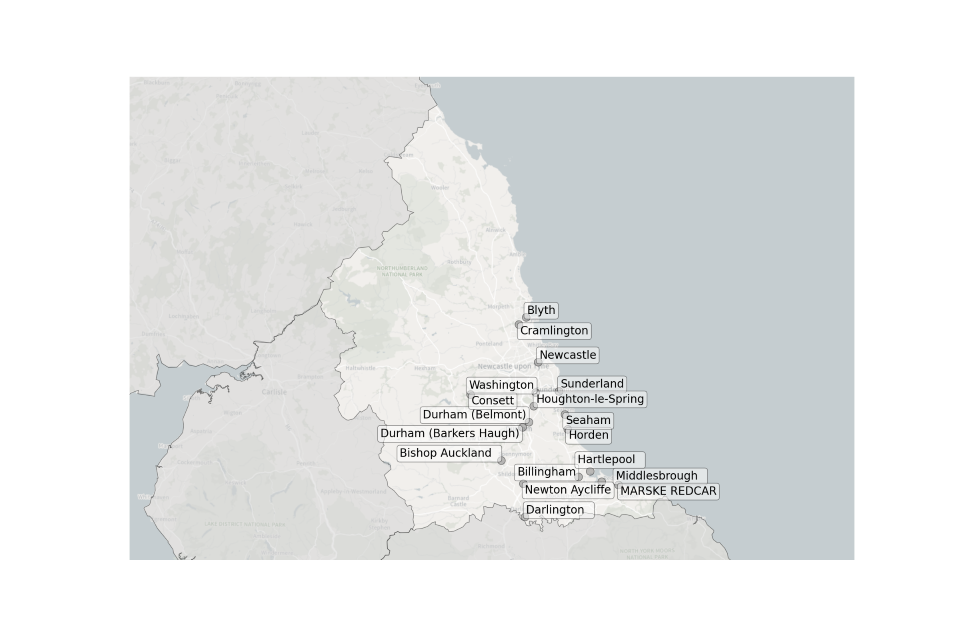
Figure 4. Map showing the location of Sewage Treatment Works sampled in the North East.
Location of STWs sampled in the North East:
- Billingham
- Bishop Auckland
- Blyth
- Consett
- Cramlington
- Darlington
- Durham (Barkers Haugh)
- Durham (Belmont)
- Hartlepool
- Horden
- Houghton-le-Spring
- Marske Redcar
- Middlesbrough
- Newcastle
- Newton Aycliffe
- Seaham
- Sunderland
- Washington

Figure 5. Map showing the location of Sewage Treatment Works sampled in the North West.
Location of STWs sampled in the North West:
- Barnoldswick
- Barrow-in-Furness
- Birkenhead
- Blackburn
- Bolton
- Bromborough
- Burnley
- Bury
- Carlisle
- Clitheroe
- Congleton
- Crewe
- Ellesmere Port
- Fleetwood
- Huyton and Prescot
- Hyde
- Hyndburn
- Kendal
- Lancaster
- Leigh
- Liverpool (Sandon)
- Macclesfield
- Maghull
- Northwich
- Penrith
- Preston
- Rochdale
- Rossendale
- Skelmersdale
- St. Helens
- Stockport
- Walton-Le-Dale
- Warrington
- Wigan
- Wirral
- Workington
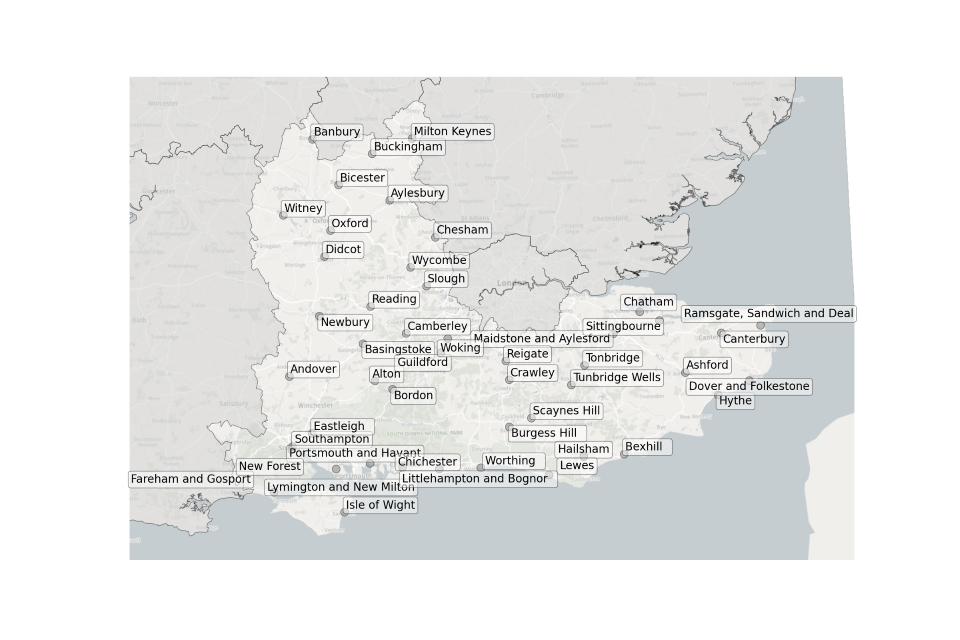
Figure 6. Map showing the location of Sewage Treatment Works sampled in the South East.
Location of STWs sampled in the South East:
- Andover
- Alton
- Ashford
- Aylesbury
- Banbury
- Basingstoke
- Bexhill
- Bicester
- Bordon
- Buckingham
- Burgess Hill
- Camberley
- Canterbury
- Chatham
- Chesham
- Chichester
- Crawley
- Didcot
- Dover and Folkestone
- Eastleigh
- Fareham and Gosport
- Guildford
- Hailsham
- Hythe
- Isle of Wight
- Lewes
- Littlehampton and Bognor
- Lymington and New Milton
- Maidstone and Aylesford
- Milton Keynes
- Newbury
- New Forest
- Oxford
- Portsmouth and Havant
- Ramsgate, Sandwich and Deal
- Reading
- Reigate
- Scaynes Hill
- Sittingbourne
- Slough
- Southampton
- Tonbridge
- Tunbridge Wells
- Witney
- Woking
- Worthing
- Wycombe
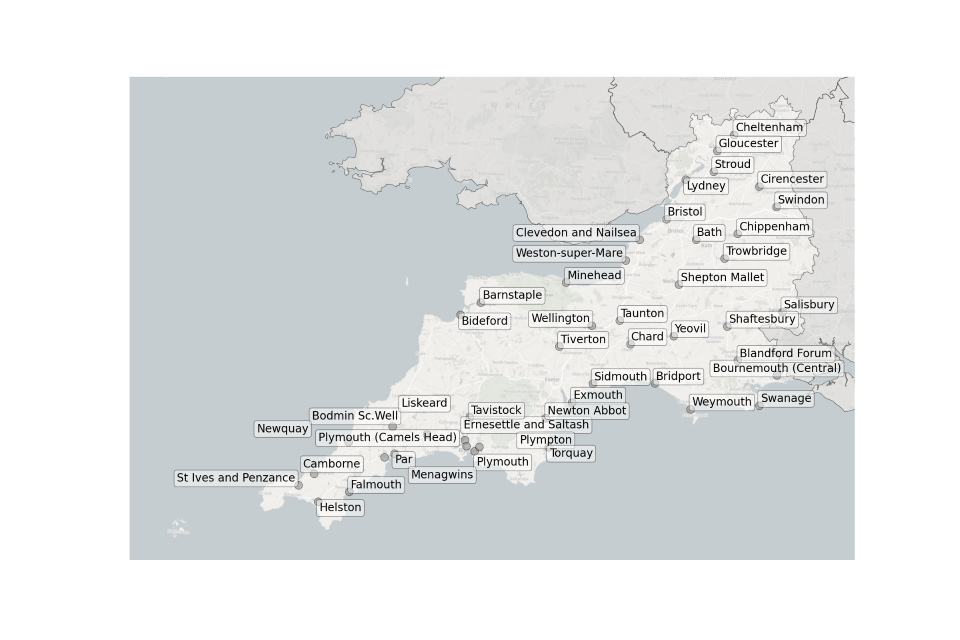
Figure 7. Map showing the location of Sewage Treatment Works sampled in the South West.
Location of STWs sampled in the South West:
- Barnstaple
- Bath
- Bideford
- Blandford Forum
- Bodmin Sc Well
- Bournemouth (Central)
- Bridport
- Bristol
- Camborne
- Chard
- Cheltenham
- Chippenham
- Cirencester
- Clevedon and Nailsea
- Ernesettle and Saltash
- Exmouth
- Falmouth
- Gloucester
- Helston
- Liskeard
- Lydney
- Menagwins
- Minehead
- Newquay
- Newton Abbot
- Par
- Plymouth (Camels Head)
- Plymouth
- Plympton
- Salisbury
- Shaftesbury
- Shepton Mallet
- Sidmouth
- St Ives and Penzance
- Stroud
- Swanage
- Swindon
- Taunton
- Tavistock
- Tiverton
- Torquay
- Trowbridge
- Wellington
- Weston-super-Mare
- Weymouth
- Yeovil

Figure 8. Map showing the location of Sewage Treatment Works sampled in the West Midlands.
Location of STWs sampled in the West Midlands:
- Barston
- Brancote
- Checkley
- Birmingham (Coleshill)
- Birmingham (Minworth)
- Burton on Trent
- Coventry
- Evesham
- Kidderminster
- Leek
- Ludlow
- Malvern
- Market Drayton
- Nuneaton
- Oswestry
- Rugby
- Spernal
- Stoke-on-Trent
- Stourbridge and Halesowen
- Telford
- Telford South
- Walsall
- Warwick
- Wolverhampton
- Worcester

Figure 9. Map showing the location of Sewage Treatment Works sampled in Yorkshire and the Humber.
Location of STWs sampled in Yorkshire and the Humber:
- Barnsley
- Barton-upon-Humber
- Beverley
- Bingley
- Bradford
- Bridlington
- Castleford
- Colburn
- Dewsbury
- Doncaster (Thorne)
- Doncaster (Sandall)
- Driffield
- Grimsby
- Halifax
- Harrogate North
- Harrogate South
- Hemsworth and South Elmsall
- Huddersfield
- Hull
- Keighley
- Leeds
- Maltby
- Malton
- Mexborough and Conisbrough
- Northallerton
- Pontefract
- Scarborough
- Scunthorpe
- Sheffield (Blackburn Meadows)
- Sheffield (Woodhouse Mill)
- Wakefield
- York
Concentration of SARS-CoV-2 RNA in wastewater samples: 15 July 2020 to 31 May 2021
EMHP wastewater concentration data from 15 July 2020 to 31 May 2021 is available in the accompanying spreadsheet. Samples collected from 182 STWs during this time period were analysed at the David Jones laboratory. By 31 May 2021 this had decreased to 10 STWs then to 0 STWs by the 31 July 2021.
All other STW samples throughout the life of the EMHP Programme have been analysed at the Environment Agency laboratory. Methods used at both labs should enable direct comparison of historical data (15 July 2020 to 31 May 2021) and later data (1 June 2021 to 30 March 2022) but this change in laboratories should be taken into account when interpreting results of any further analysis.
In addition, population coverage of the EMHP programme gradually increased over this time period. Therefore, regional and national averages have not been calculated for this time period and graphical visualisations of this historical data are not shown in this report.
Concentration of SARS-CoV-2 RNA in wastewater samples: 1 June 2021 to 30 March 2022
EMHP wastewater concentration data from 1 June 2021 to 30 March 2022 is available in the accompanying spreadsheet. The spreadsheet includes data from previous months’ publications, along with the latest data from March 2022. The most recent 4 weeks of data are visualised in figures 10 and 11; England concentration maps. Note that Sewage Treatment Works are omitted from figures 10 and 11 if no samples were taken during the week.
In the week beginning 8 March, 57 of 298 STWs (19%) had a decrease in average concentration levels relative to the previous week. In the week beginning 15 March, 92 of 299 STWs (31%) had lower average concentration than the preceding week. In the week beginning 22 March, 196 of 268 STWs (73%) had a decrease in average concentration compared to the previous week. Interpretation should be made with careful consideration of the points in the ‘Uncertainty, data quality and revisions’ section below.
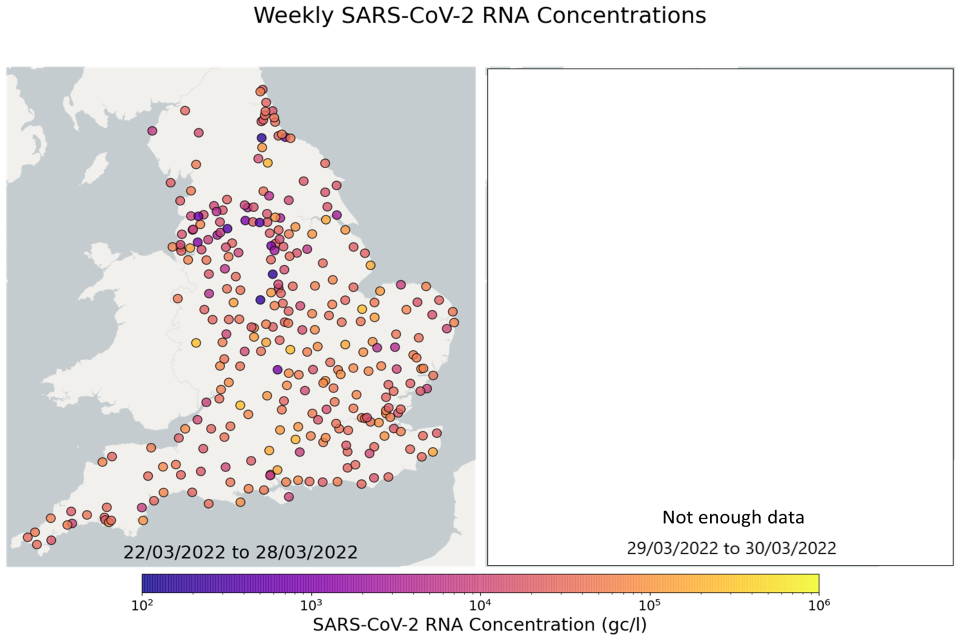
Figure 10. England concentration map: map showing the location of Sewage Treatment Works sampled. Colour indicates the weekly-average SARS-CoV-2 RNA concentration (gene copies per litre) in the last week. See regional maps for the names of each Sewage Treatment Works. Note due to the pause in the EMHP Programme on 30 March 2022 there is insufficient data to calculate weekly estimates for the week commencing 29 March 2022.
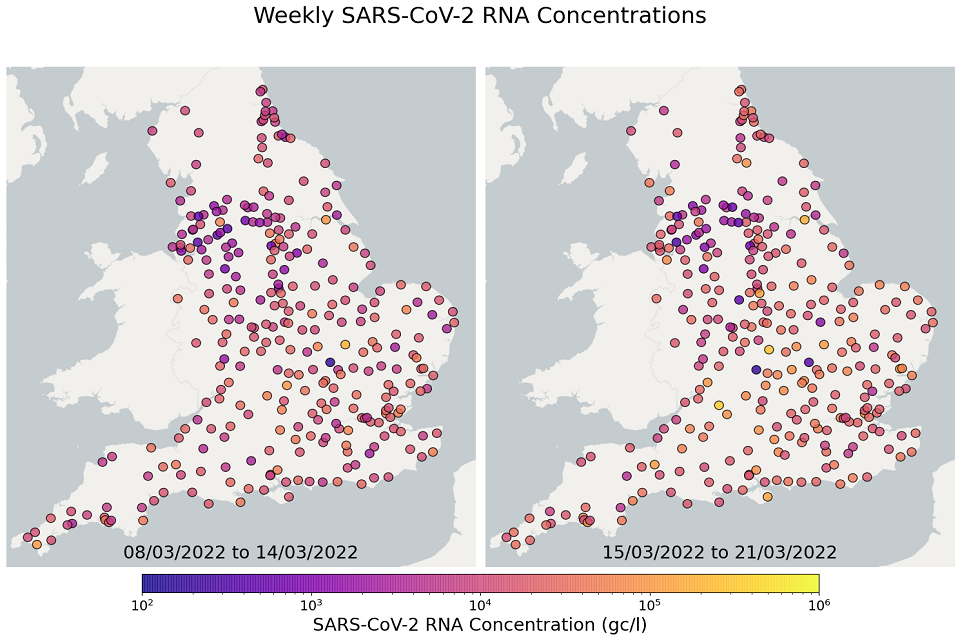
Figure 11. England concentration map: map showing the location of Sewage Treatment Works sampled. Colour indicates the weekly-average SARS-CoV-2 RNA concentration (gene copies per litre) in the first two weeks. See regional maps for the names of each Sewage Treatment Works.
Regional average concentration of SARS-CoV-2 RNA in wastewater: 1 June 2021 to 30 March 2022
In the latest period (8 March to 30 March) concentration data showed signs of an upward trend in all regions. Concentration levels in the West Midlands, North East, North West and Yorkshire and the Humber were below the national average in February. In the month of March, despite a peak in mid-March, concentrations in these regions were below the national average by the end of March.
Yorkshire and the Humber showed the lowest average concentrations relative to other regions. There is high variability in concentration between individual STWs, nationally. Interpretation should be made with careful consideration of the points in the ‘Uncertainty, data quality, and revisions’ section.
Figures 12 to 20 show the 7-day rolling average SARS-CoV-2 concentration detected in wastewater for each region in England, together with the national average of SARS-CoV-2 concentration detected in wastewater and individual site data. Samples where no SARS-CoV-2 was detected are assigned the value 160 (gc/l) which is the Theoretical Limit of Detection. Data are weighted by catchment population to account for varying catchment sizes. For further information, see ‘methodology’ section below.
Note: there was limited wastewater sampling over the Christmas period, therefore trends are not shown for the period 21 December 2021 to 28 December 2021
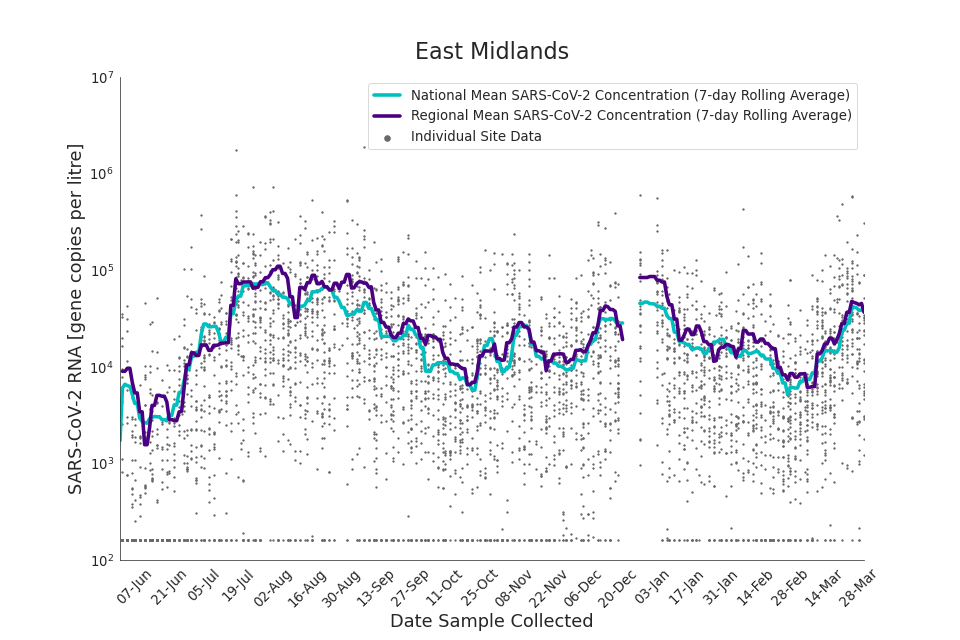
Figure 12. East Midlands 7-day rolling average SARS-CoV-2 RNA concentration
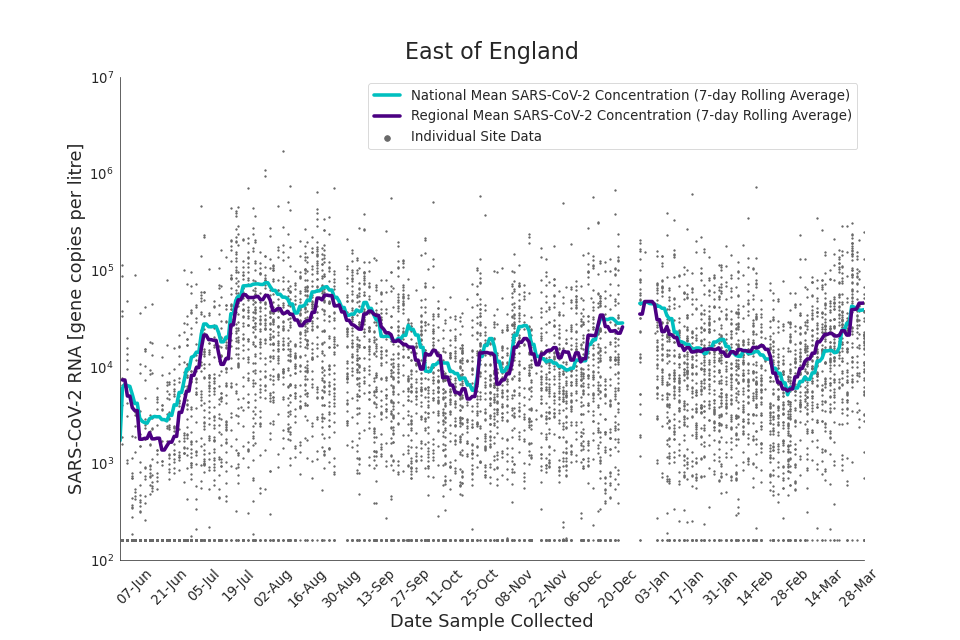
Figure 13. East of England 7-day rolling average SARS-CoV-2 RNA concentration
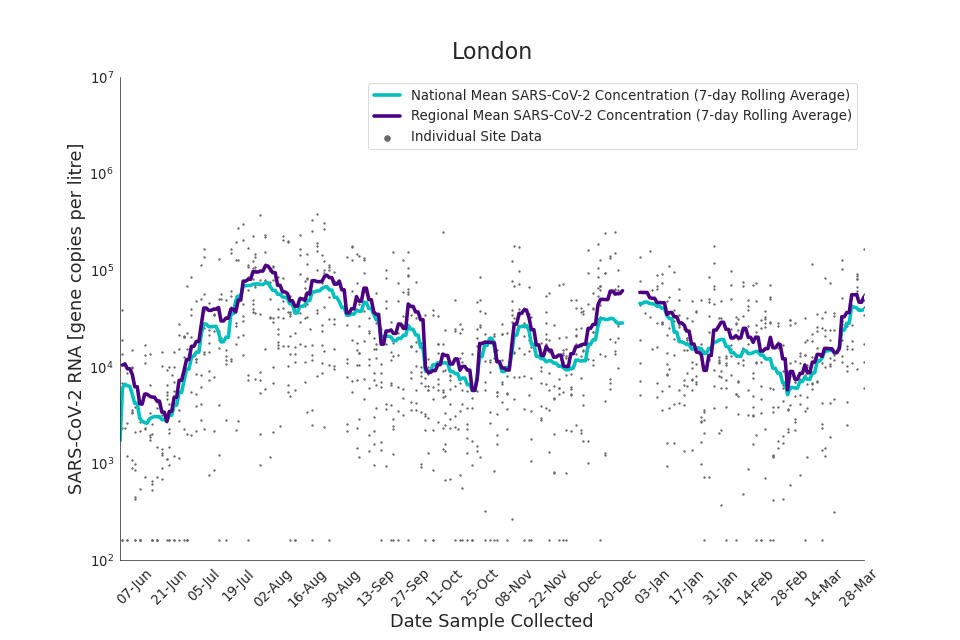
Figure 14. London 7-day rolling average SARS-CoV-2 RNA concentration
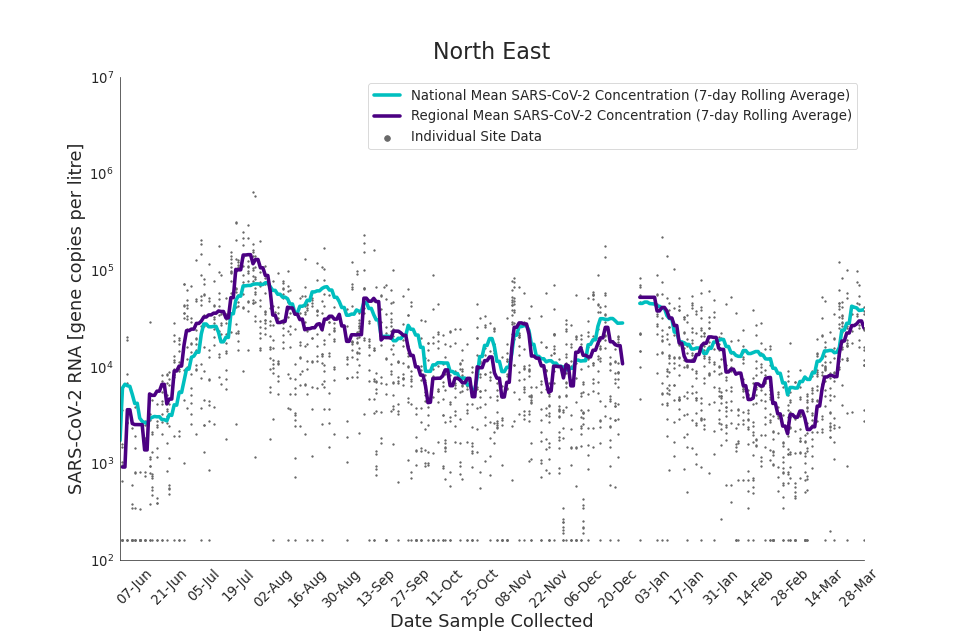
Figure 15. North East 7-day rolling average SARS-CoV-2 RNA concentration
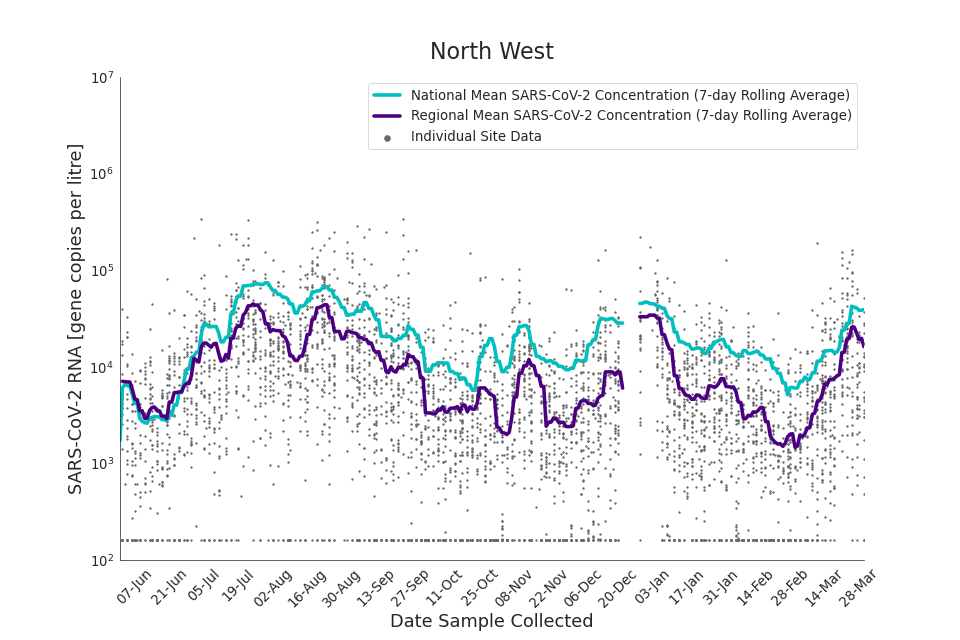
Figure 16. North West 7-day rolling average SARS-CoV-2 RNA concentration
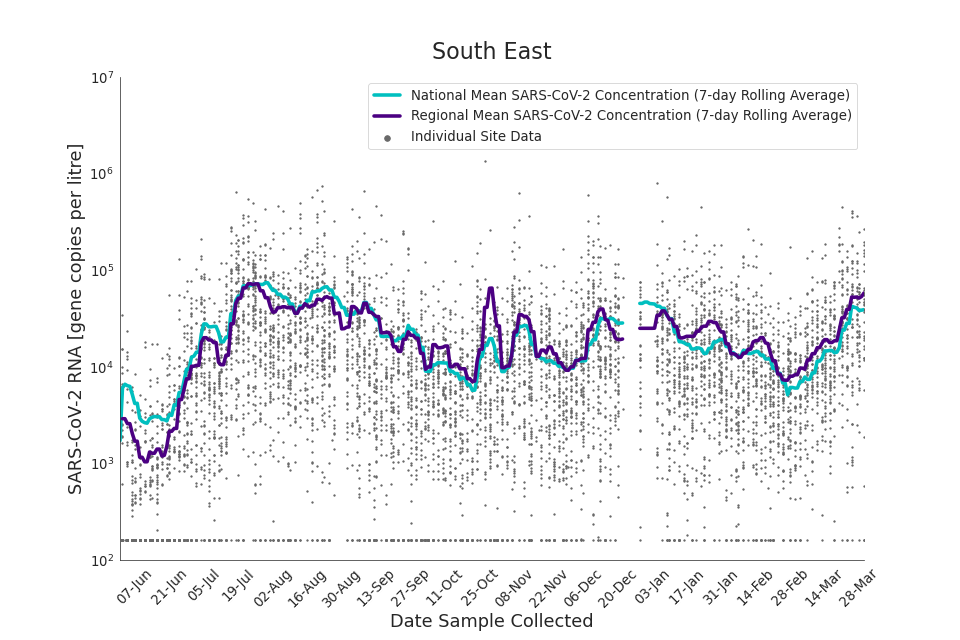
Figure 17. South East 7-day rolling average SARS-CoV-2 RNA concentration
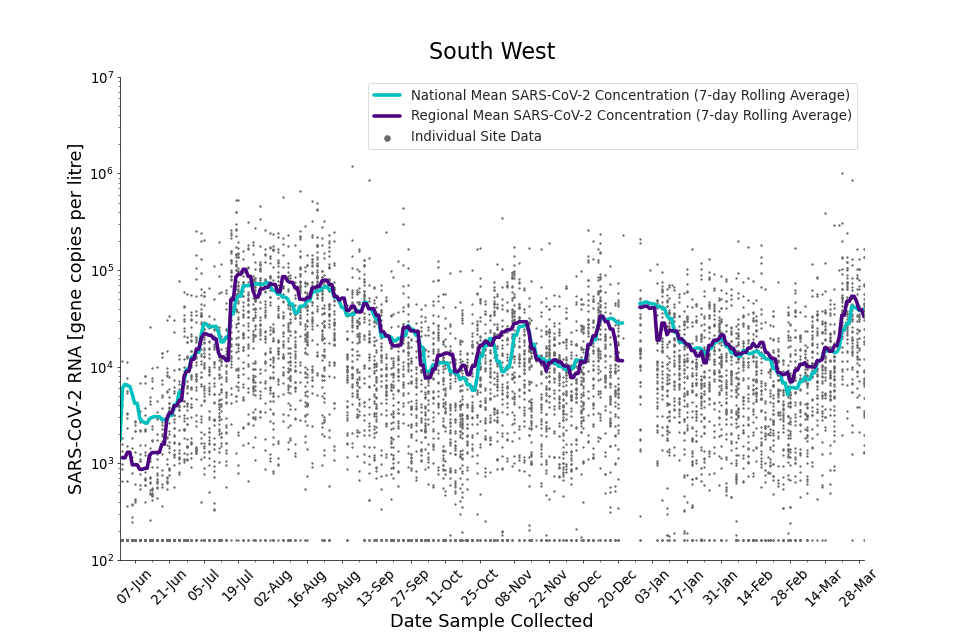
Figure 18. South West 7-day rolling average SARS-CoV-2 RNA concentration
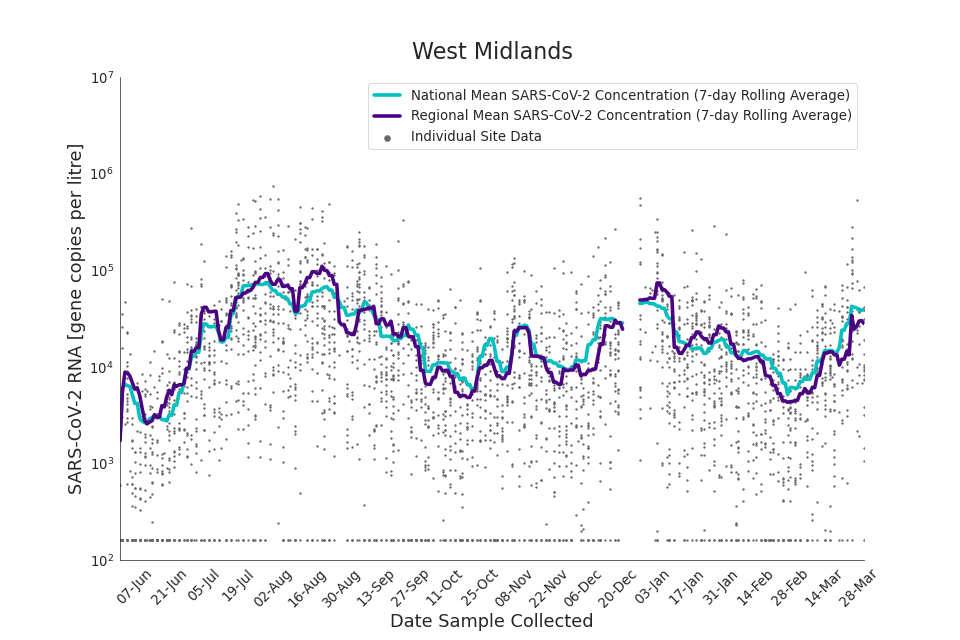
Figure 19. West Midlands 7-day rolling average SARS-CoV-2 RNA concentration
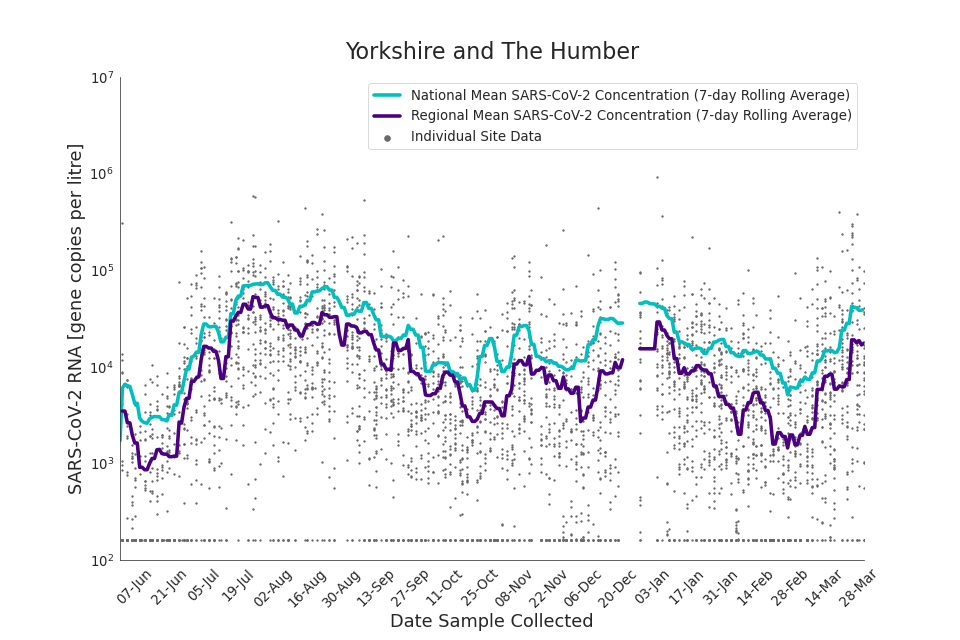
Figure 20. Yorkshire and the Humber 7-day rolling average SARS-CoV-2 RNA concentration
Detection of SARS-CoV-2 variants and mutations in wastewater samples: 1 May 2021 to 27 March 2022
Detections of SARS-CoV-2 variants
Applying the Wastewater Variant Genomic Case Definition (see ‘Methodology’), wastewater samples collected from STW sites across England from 1 May 2021 up to 27 March 2022 were analysed for the presence of VOC or VUI. EMHP variant detection data showing the most common variants is available in the accompanying spreadsheet.
The spreadsheet includes a table showing the number of sequenced samples and whether those samples contained a Confirmed or Possible detection of Delta, Kappa, B.1.1.318, AY4.2, Omicron, Omicron-BA.1 and Omicron-BA.2. Note that this data is subject to change as methods are further developed.
The prevalence of a variant in a catchment area (that is, the number of individuals infected with that variant) cannot be deduced from wastewater data. Instead, a variant is categorised Confirmed, Possible or not detected in each sequenced sample. Lack of a positive sequencing result is not necessarily confirmation that no variant cases reside within a given geography, due to factors impacting RNA recovery (see ‘Methodology’).
Figure 21 shows the proportion of wastewater STW catchment sites in which each variant was detected. Given the consideration above, this should be interpreted as a geographical metric and not a measure of prevalence. The replacement of the Delta variant with Omicron can be seen clearly in Figure 21, as can the replacement of Omicron-BA.1 with Omicron-BA.2. By 27 March, using a 7-day rolling average, Omicron-BA.1 and Omicron-BA.2 were detected in 29% and 92% of STW sites, respectively.
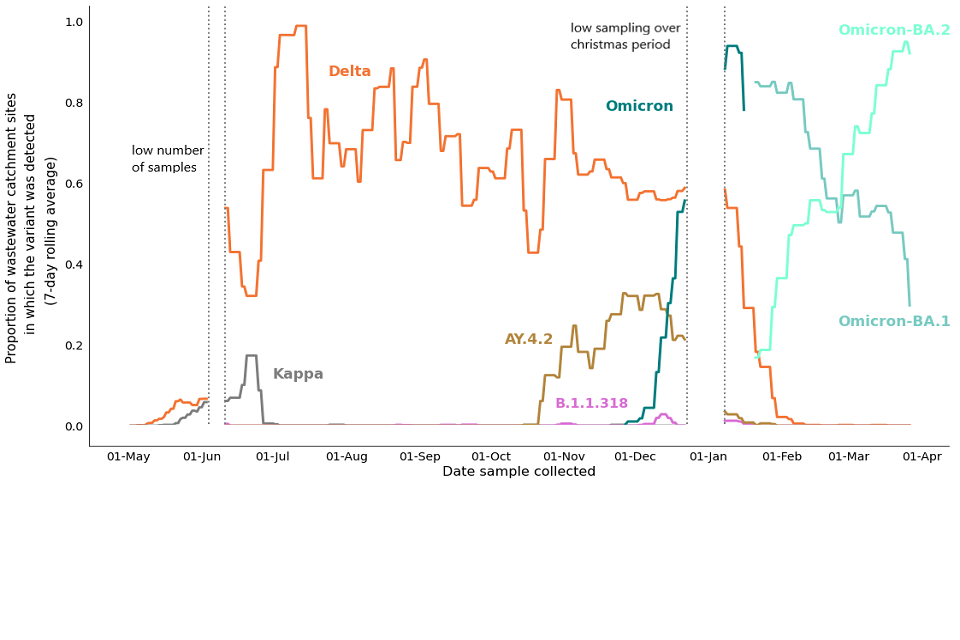
Figure 21. VOC detections (STWs) in England: 7-day moving average of variant detections (confirmed and possible) as a proportion of wastewater STW catchment sites sampled and sequenced each day, 1 May 2021 to 27 March 2022. Note that any days with less than 50 sequenced catchment sites have been excluded and are considered as missing data for the purposes of this chart.
Detections of SARS-CoV-2 single mutations
Applying the Wastewater Variant Genomic Case Definition (see ‘Methodology’), wastewater samples collected from STW sites across England from 1 May 2021 up to 27 March 2022 were analysed for the presence of 2 single mutations, K417N and E484K. Detections of a single mutations were only reported as confirmed when found in samples in which no variant with these SNPs in their definition were detected. The accompanying spreadsheet includes a table showing confirmed detections of K417N and E484K. Note that this data is subject to change as methods are further developed.
Detection of the Omicron variant in wastewater samples: 22 November 2021 to 27 March 2022
Applying the wastewater variant genomic case definition (see ‘Methodology’), wastewater samples collected from STW and network sites across England from 22 November 2021 up to 27 March 2022 have been analysed for the presence of Omicron, Omicron-BA.1 and Omicron-BA.2. To ensure continuity with previous publications we have included an updated table showing the number of sequenced samples by region and the number of confirmed and possible Omicron detections in the accompanying spreadsheet.
This table includes data from both STWs and network sites and is the only data in this publication to include network sites. Note that this data is subject to change as methods are further developed. The most recent 4 weeks of Omicron detections data are visualised in figures 22 to 25.
Over the 4 weeks from 28 February to 27 March, wastewater detections data showed a continuous decrease in the proportion of sequenced samples with detections of Omicron-BA.1. In comparison, the proportion of samples with detections of Omicron-BA.2 continued to increase. In the latest week, South East and South West had the highest proportion of samples with Omicron detections while North East had the lowest proportion of samples with Omicron detections.
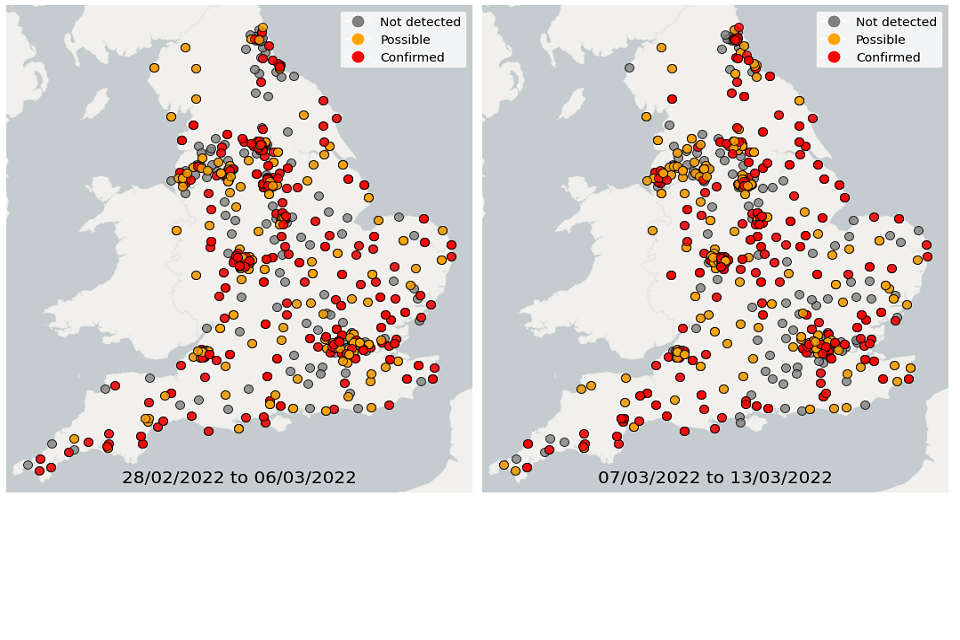
Figure 22. Confirmed and possible detections of Omicron-BA.1 (VOC-21NOV-01) in wastewater samples collected in England, data from 28 February to 13 March 2022
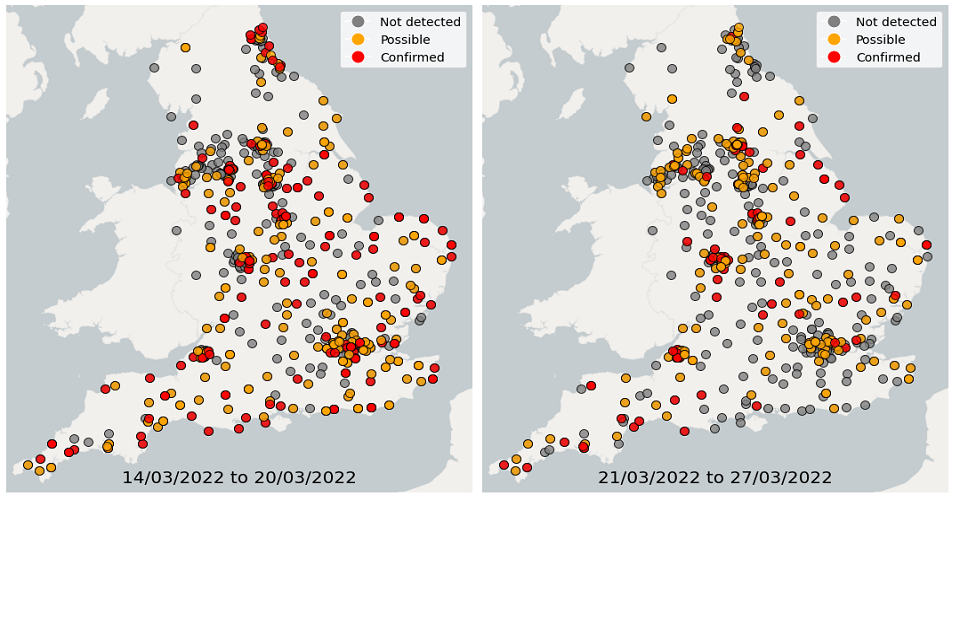
Figure 23. Confirmed and possible detections of Omicron-BA.1 (VOC-21NOV-01) in wastewater samples collected in England, data from 14 March to 27 March 2022
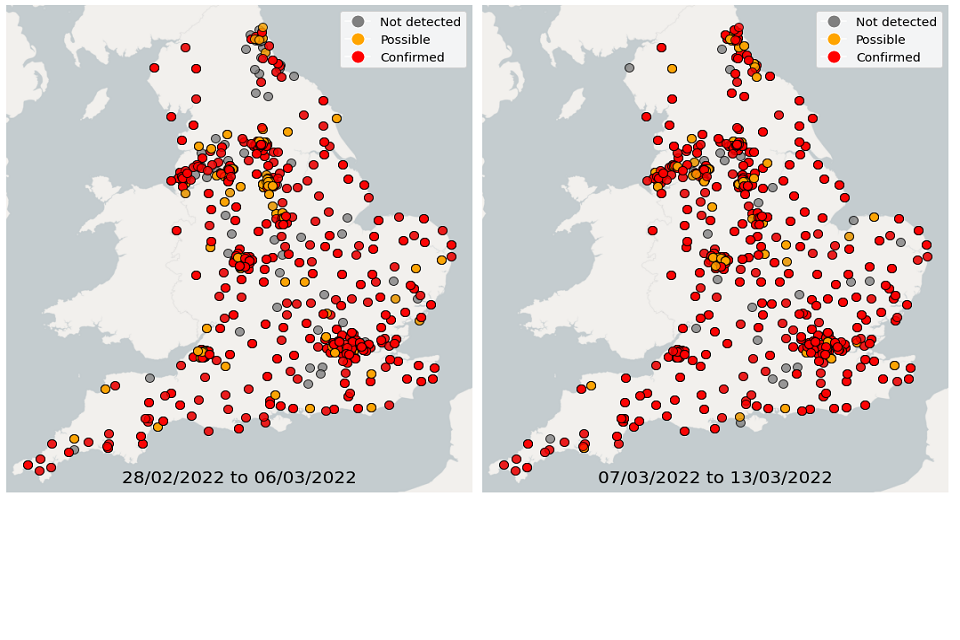
Figure 24. Confirmed and possible detections of Omicron-BA.2 (VOC-22JAN-01) in wastewater samples collected in England, data from 28 February to 13 March 2022
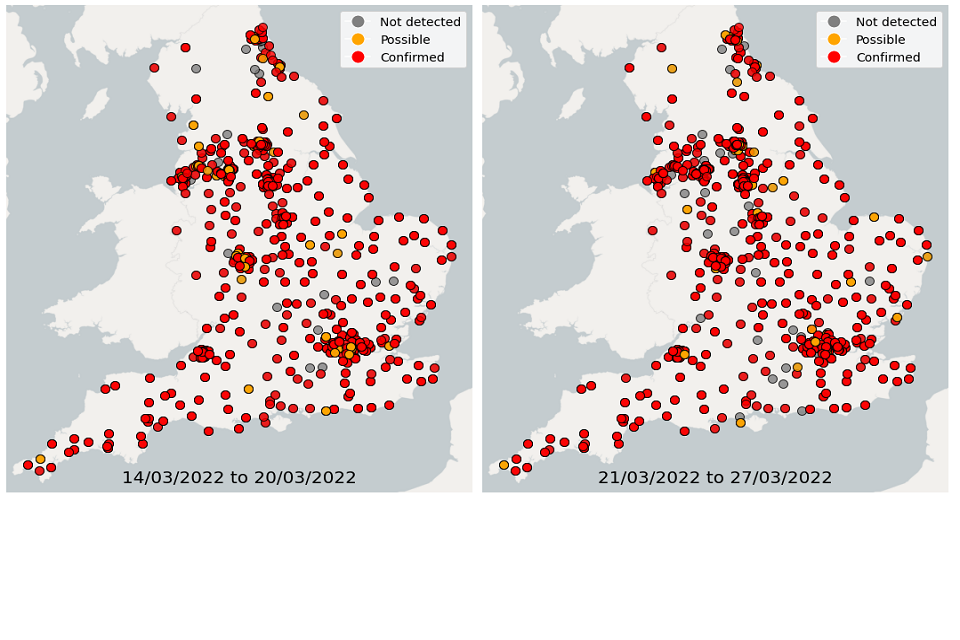
Figure 25. Confirmed and possible detections of Omicron-BA.2 (VOC-22JAN-01) in wastewater samples collected in England, data from 14 March to 27 March 2022
Methodology
About these data
SARS-CoV-2 RNA Concentration
EMHP sample wastewater from Sewage Treatment Works (STWs) throughout England. Samples are analysed for the concentration of SARS-CoV-2 by quantifying the number of copies of the nucleocapsid gene (N1). Samples are transported to Environment Agency laboratory for quantification of the N1 gene using a process called Reverse Transcriptase Polymerase Chain Reaction.
The data reported here are the number of SARS-CoV-2 N1 gene copies per litre of wastewater (shortened to gene copies/litre throughout this document). Generally, the more people with COVID-19 in the community the more viral RNA will be shed into wastewater. Therefore, the concentration in wastewater is indicative of the prevalence of COVID-19 in the community.
Samples are analysed for the concentration of SARS-CoV-2 RNA and concentration is adjusted for flow (see ‘Uncertainty, data quality, and revisions’). Typically, 4 samples per week are analysed from each STW. However, occasionally fewer samples will be collected and/or analysed. This can be due to several reasons such as EMHP altering sampling strategy because of testing capacity constraints, changing epidemiological priorities and current local response activities.
Weekly Concentration Table and Daily Concentration Table in the accompanying spreadsheet show the concentration of SARS-CoV-2 RNA in wastewater samples (gene copies/litre). Note that there is sensitivity associated with the analysis of wastewater; the Limit of Detection (LOD) is the minimum concentration of SARS-CoV-2 RNA that can be reliably detected. Data tables contain the values ‘tLOD’ where analysis of the sample did not detect presence of SARS-CoV-2 RNA.
For the purposes of averaging data to produce weekly averages in the Weekly Concentration Table and Figures 10 and 11, EMHP assign a concentration of 160 gene copies/litre to all ‘tLOD’ samples. This concentration is the Theoretical Limit of Detection and is calculated by the Environment Agency. Note that there is uncertainty in this calculation, please see the ‘Uncertainty, data quality, and revisions’ section for further information.
To calculate region averages, data from each STW was weighted by catchment population. To estimate the population of STWs, the catchment areas of STWs are matched to lower layer super output areas (LSOA)s. Catchment areas were provided by the 9 water companies serving England.
See the EMHP publication Wastewater testing coverage data for the Environmental Monitoring for Health Protection (EMHP) programme for a detailed description of this method. Regional and national averages were calculated by taking the 7-day rolling arithmetic mean. Figures are displayed on a logarithmic scale for ease of interpretation.
SARS-CoV-2 variant and single mutation detections
The wastewater routine analysis is to look for the presence of pre-defined sets of single nucleotide polymorphisms (SNPs) that identify known variants of concern, variants under investigation, and signals in monitoring. It is possible to look for mutations associated with variants in the wastewater, but detection of variants can be transient and the correlation between population prevalence and wastewater variant detection has not been established for Omicron. Wastewater monitoring remains under development and is currently considered as supplementary data in variant monitoring.
A proportion of samples are sent to Liverpool, Nottingham and Exeter Universities Sequencing facilities each week for genomic sequencing, results are analysed by EMHP for the presence of known VOCs and VUIs officially recognised by UKHSA. Wastewater detections of a variant are reported as either confirmed or possible, based on the number of signature or unique SNPs, and co-occurrence on the same amplicon.
This describes the level of confidence EMHP has in the specificity of the detection; ‘confirmed’ status is assigned when there is a high degree of confidence the variant is present, ‘possible’ is assigned where there is some evidence that the variant is present. These definitions are different to the clinical case definitions and the 2 should not be compared. Lack of a positive sequencing result is not necessarily confirmation that no variant cases reside within a given geography, due to factors such as rainfall dilution impacting RNA recovery.
Results were also analysed by EMHP for the presence of some single mutations. Detections of a single mutation were only reported as confirmed when found in samples in which no variant with these SNPs in their definition were detected.
The wastewater variant genomic case definition used for detections in this publication is detailed below. Note that these definitions are subject to change.
Wastewater variant genomic case definition
B.1.1.529-BA.2 (VOC-22JAN-01) Omicron-BA.2
B.1.1.529-BA.2 lineage has 4 synonymous and 16 non-synonymous signature SNPs of which 12 are unique amongst known VOC and VUI. Co-occurrence of signature mutations occurs on 1 amplicon for Nimagen protocol*.
Confirmed – ≥ 13 of 20 signature SNPs detected, ≥ 6 of 12 unique SNPs detected and co-occurrence detected OR if ≥ 16 signature SNPs and ≥ 6 unique SNPs are present, but with no co-occurrence confirmed presence can be assigned if some position of the cooccurring pairs are not covered
Possible – ≥ 8 of 16 signature SNPs detected and ≥ 4 of 12 unique SNPs detected OR if < 8 signature SNPs and ≥ 4 unique SNPs are detected, but ≥ 6 SNPs are not covered possible presence can be assigned if those not covered are present across 2 dates from the same site, but in the same sequencing run.
Not detected - < 7 of 16 signature SNPs detected.
(*: amplicon_119 [22595-22837] positions 22679, 22688U,22775U and 22786U)
B.1.1.529-BA.1 (VOC-21NOV-01) OMICRON-BA.1 (updated 25/01/2022)
B.1.1.529-BA.1 lineage has 1 synonymous and 16 non-synonymous signature SNPs of which 11 are unique amongst known VOC and VUI. Co-occurrence of signature mutations occurs on 2 amplicons for Nimagen protocol*.
Confirmed – ≥ 11 of 16 signature SNPs detected, ≥ 6 of 11 unique SNPs detected and co-occurrence detected OR if ≥ 16 signature SNPs and ≥ 6 unique SNPs are present, but with no co-occurrence confirmed presence can be assigned if some position of the cooccurring pairs are not covered
Possible – ≥ 7 of 16 signature SNPs detected and ≥ 3 of 11 unique SNPs detected OR if < 7 signature SNPs and ≥ 3 unique SNPs are detected, but ≥ 6 SNPs are not covered possible presence can be assigned if those not covered are present across 2 dates from the same site, but in the same sequencing run.
Not detected – < 5 of 16 signature SNPs detected.
(*: amplicon_121 [22876-23119] positions 22898 and 23048, amplicon_139 [26476-26705] position 26530 and 26577.)
B.1.1.529 (VOC-21NOV-01) Omicron
The wastewater routine analysis is to look for the presence of pre-defined sets of single nucleotide polymorphisms (SNPs) that identify known variants of concern, variants under investigation, and signals in monitoring. For the detection of Omicron VOC-21NOV-01 (B.1.1.529) in wastewater, the following definition is based on the detection of a number of SNPs from the list in the official definition is noted below. No distinction is made between SNPs which can be used to define wastewater detections, unless otherwise stated.
Confirmed – ≥ 16 of 22 variant defining SNPs detected, ≥ 9 of 20 unique SNPs detected and co-occurrence detected on at least 7 OR if ≥ 16 signature SNPs and ≥ 9 unique SNPs are present without co-occurrence, OR co-presence of the following SNPs on amplicon 121 with co-occurrence: 22882, 22898, 22992, 23013, 23040, 23048 and 23055
Possible – ≥ 10 of 22 variant defining SNPs detected and ≥ 6 of 20 unique SNPs detected OR if < 10 signature SNPs and ≥ 6 unique SNPs are detected, but ≥ 9 SNPs are not covered possible presence can be assigned if those not covered are present across 2 dates from the same site, but in the same sequencing run.
Not detected – < 7 of 22 variant defining SNPs detected unless co-presence of the following SNPs on amplicon 121: 22882, 22898, 22992, 23013, 23040, 23048 and 23055
AY.4.2 (V-21OCT-01)
AY.4.2 is Delta + 3 unique signatures among VOC/VUI: A1711V (protein nsp3), A222V (Spike protein) and Y145H (Spike protein).
Confirmed – ≥ 11 of 16 signature SNPs detected including the presence of A1711V, A222V and Y145H. If ≥ 11 signature SNPs are present and at least 5 are not covered, confirmed presence can also be assigned if at least 2 of the 3 unique SNPS are covered
Possible – ≥ 8 of 16 signature SNPs detected and presence of A222V and Y145H. If < 8 signature SNPs and 2 out of 3 unique snips are detected, but ≥ 5 SNPs are not covered possible presence can be assigned if those not covered are present across 2 dates from the same site within the same sequencing run.
Not detected – ≤ 7 of 14 signature SNPs detected.
B.1.617.2 (V-21APR-02) Delta
B.1.617.2 has 13 signature non-synonymous SNPs, of which none are unique amongst known VOC and VUI. Co-occurrence of signature mutations occurs on 1 amplicon for both ARTIC and Nimagen protocols, respectively.
Confirmed – ≥ 9 of 13 signature SNPs detected and co-occurrence detected on one amplicon. If ≥ 9 signature SNPs are present, but those co-occurring are not covered, confirmed presence can also be assigned.
Possible – ≥ 5 of 13 signature SNPs detected. If < 5 signature SNPs are detected, but ≥ 5 SNPs are not covered possible presence can be assigned if those not covered are present across 2 dates from the same site, but in the same sequencing run.
Not detected - ≤ 4 of 13 signature SNPs detected.
B.1.617.1 (V-21APR-01) Kappa
The B.1.617 lineage has 11 signature synonymous and non-synonymous SNPs, of which 4 are unique amongst known VOC and VUI. Co-occurrence of signature mutations occurs on 1 amplicon for both ARTIC and Nimagen protocols, respectively.
Confirmed – ≥ 8 of 11 signature SNPs detected, ≥ 3 of 4 unique SNPs detected and co-occurrence detected on one amplicon. If ≥ 8 signature SNPs and ≥ 3 unique SNPs are present, but those co-occurring are not covered, confirmed presence can also be assigned.
Possible – ≥ 5 of 11 signature SNPs detected and ≥ 2 of 4 unique SNPs detected. If < 5 signature SNPs and ≥ 2 unique SNPs are detected, but ≥ 5 SNPs are not covered possible presence can be assigned if those not covered are present across 2 dates from the same site, but in the same sequencing run.
Not detected – ≤ 4 of 11 signature SNPs detected.
B.1.1.318 (V-21FEB-04)
The B.1.1.318 lineage has 14 signature synonymous and non-synonymous SNPs, of which 12 are unique amongst known VOC and VUI. Co-occurrence of signature mutations occurs on 3 and 2 amplicons for ARTIC and Nimagen protocols, respectively.
Confirmed – ≥ 11 of 14 signature SNPs detected, ≥ 6 of 12 unique SNPs detected and co-occurrence detected on at least one amplicon. If ≥ 11 signature SNPs and ≥ 8 unique SNPs are present, but those co-occurring are not covered, confirmed presence can also be assigned.
Possible – ≥ 5 of 14 signature SNPs detected and ≥ 3 of 12 unique SNPs detected. If < 5 signature SNPs and ≥ 5 unique SNPs are detected, but ≥ 6 SNPs are not covered possible presence can be assigned, if those not covered are present across 2 dates from the same site, but in the same sequencing run.
Not detected – ≤ 4 of 14 signature SNPs detected.
Data sources
Wastewater samples are collected by water companies and transported to an Environment Agency Laboratory. Concentration data are from Environment Agency analysis of wastewater samples. Sequencing data is from Liverpool, Nottingham and Exeter Universities / Sequencing facilities. Variant detection’s data are from EMHP Genomics Analysis.
Figures in this publication show the location of STWs. These locations were obtained from the European Commission urban wastewater website. Note that names differ between those used in this document and the European Commission urban wastewater website, sites can be linked using the ‘STW Site Code’ in the attached data tables.
The figures and analysis presented will evolve over time to ensure the most relevant information is included and the needs of stakeholders are met. These figures were initially published monthly, from June 2021 to March 2022.
This publication is the final regular publication, covering data up to the pausing of the EMHP Programme on 30 March, and regular publications will now cease. Any future changes to these figures and analysis, or any future ad-hoc publications, will be announced in advance on the Statistics at UKHSA page.
How these figures can be used
These figures and data can be used to view the concentration of SARS-CoV-2 RNA in wastewater, which is indicative of prevalence in the community and an indication of where VOCs and VUIs may be present across England. Due to factors relating to data uncertainty, EMHP recommend careful interpretation of this data alongside other data sources such as Weekly Statistics for NHS Test and Trace (England).
Uncertainty, data quality, and revisions
The figures here are compiled by professional analysts and have been quality assured. However, the analytical pipeline to produce this data should still be considered experimental; it is subject to an ongoing quality assurance process. Any revisions to past publications will be in line with DHSC’s revision policy and highlighted in future publications accordingly.
SARS-CoV-2 RNA concentration
From September to November 2021 the ratio of SARS-CoV-2 RNA concentrations measured in wastewater to clinical measures of prevalence (Pillar I+II, CIS data) diverged significantly. This manifested as a monotonically decreasing ratio indicative of reduced RNA concentrations in wastewater in contrast to plateauing or rising case rates in the population. No firm conclusions as to the cause of this divergence can be drawn at this time.
However, from the end of November 2021, coinciding with the emergence of the Omicron variant in England, this trend in the ratio changed. While there remained a significant difference between the measured and expected RNA concentrations based on pre-divergence observations, the dynamics of this measure adhered to the trends observed in clinical estimations of cases and prevalence.
Given reports from a number of other countries of similar observations in their data, the so-called “Omicron effect” was postulated to be a result of lower viral shedding in faeces in individuals infected with the Omicron variant. In the absence of empirical evidence to test this hypothesis and relying on as yet unpublished analyses ruling out other possible causes (for example, reduction in testing uptake), no firm conclusions can yet be drawn.
EMHP advise caution when directly comparing data from Sewage Treatment Works and concentration of SARS-CoV-2 RNA in wastewater with clinical testing data.
Interpretation should be made with careful consideration of the points below:
The sites from which EMHP sample can change on a regular basis depending on testing capacity, epidemiological priorities, and current local response activities. This can result in changes to specific Sewage Treatment Works (STWs) covered. This means the STW included in subsequent publications may change.
This publication shows STWs as single points. Every STW has an associated geographical catchment area (area from which wastewater flows into the sampling location). These catchments are not yet presented in these statistics publications. There is uncertainty surrounding catchment geography, as catchments vary in size and population covered, and in some cases an STW may not be located within the catchment it serves (for example, if wastewater is pumped to the STW). Therefore, the location of STW should be used as a general guide only.
Wastewater is an inherently variable material and can change greatly within and between days (foodstuffs being consumed; when washing machines are switched on and many other factors), the physical infrastructure and the type and levels of industrial wastes. It is generally more useful to consider trends over medium- and long-term periods of time, rather than between individual days.
There are several factors that can impact the quality of the signal recorded from wastewater and introduce uncertainty:
1. The concentration of SARS-CoV-2 RNA in wastewater may be impacted by weather, for example heavy rainfall wastewater may cause dilution. EMHP mitigate this by adjusting concentration to consider flow.
2. Whether samples are ‘composite’ or ‘grab’. Composite samples are where an autosampler (a machine which gathers wastewater at regular intervals over a set time period) gathers wastewater throughout the day. Grab samples are where a single sample is taken at one point in the day and are subject to greater variability; they are influenced by flow characteristics, time of day, and are more susceptible to outliers in the sewage. EMHP aim to mitigate this by sampling during times of peak load and ensuring the sample is collected mid-stream rather than close to the edges or bottom of the pipe.
3. Calculating the Limit of Detection (LOD; the minimum concentration of SARS-CoV-2 RNA that can be reliably detected in a wastewater sample) can be achieved by several methods. Since June 2021 – March 2022 we have used the Theoretical LOD as calculated by the Environment Agency. Data from July 2020 – May 2021, samples were assigned Theoretical LOD value of 133 gc/l (Environment Agency laboratory) or 610 gc/l (David Jones laboratory).
4. The Theoretical LOD uses several assumptions. Laboratory data is required to inform the more realistic Practical LOD. The Practical LOD for this analysis is not yet reported here. It is likely that the LOD used in producing these statistics will change in future publications. EMHP will clearly state when this occurs.
5. Although the exact value of the LOD is uncertain, it is unlikely to have a noticeable impact on the interpretation of this data. This is because the difference between Theoretical and Practical LOD is relatively small, with most impact at low levels of the target being measured.
6. Samples collected from 182 STWs during 15 July 2020 to 31 May 2021 were analysed at the David Jones laboratory. By 31 May 2021 this had decreased to 10 STWs then to 0 STWs by 31 July 2021. All other STW samples throughout the life of the EMHP Programme have been analysed at the Environment Agency laboratory. Methods used at both labs should enable direct comparison of historical data (15 July 2020 to 31 May 2021) and later data (1 June 2021 to 30 March 2022) but this change in laboratories should be taken into account when interpreting results of any further analysis.
7. Similarly the evolution of lab methods over time may also affect fair comparisons of the wastewater data across location and time.
8. As explained in the ‘About this data’ section, typically 4 wastewater samples are taken at each STW per week. The average of all samples within the week is presented in the Weekly Concentration Table. Uncertainty occurs where fewer samples are taken. For example, if only one sample is taken during a week, that one sample defines the week average. This means weeks with fewer samples are more susceptible to variability and outliers. Sample Count Table shows how many samples were taken at an STW for each week in this release.
For the above reasons EMHP advise caution when directly comparing data from Sewage Treatment Works and concentrations of SARS-CoV-2 RNA in wastewater with clinical testing data. Methodology and limitations will differ across data sources and this should be taken into account.
SARS-CoV-2 variant and single mutation detections
The lack of a positive sequencing result is not confirmation that no variant cases reside within a given geography (given limitations of wastewater testing).
Environmental factors such as rainfall dilution can influence the detection of variants in wastewater. Therefore, low total detections on some days may not be reflective of low community infection levels.
Due to limitations of wastewater testing, EMHP cannot estimate the number of cases associated with a detection. In small catchments it is possible, but unlikely, the detection is due to a single individual. In larger catchments a detection is likely caused by a higher number of cases.
Figure 21 shows the daily proportion of wastewater catchments with detections. Data has been smoothed by taking 7 day rolling averages. Detections include confirmed and possible detections. Samples are from STWs only. The prevalence of a variant in a catchment area (that is, the number of individuals infected with that variant) cannot be deduced from wastewater data. In a typical week there are approximately 200 sequenced samples per day (3 days per week). Any days with less than 50 sequenced samples (equivalent to 50 sequenced catchment areas since catchment areas are sampled once a day) have been excluded and are considered as missing data for the purposes of this chart.
Detections of a single mutation are only reported as confirmed when found in samples in which no variant with these SNPs in their definition were detected.
Figures 22 and 25 show the location of Omicron detections in STWs and sewer networks as single points. Sewer networks tend to be relatively small geographical areas. Please note that the underlying characteristics of city sewer networks can be complex. For example, there may be varying flow from other areas into the catchment, and/or the exact catchment geography may be uncertain. With this in mind, maps are presented as a general guide to the location of a detection.
It is possible that a detection in a catchment is contributed to by case(s) who do not reside in the catchment; interpretation with other epidemiological indicators, such as known clinical cases, is encouraged.
The data presented in this publication are generated by non-accredited research laboratories and should be considered experimental. Formal validation of wastewater monitoring as a variant surveillance system is underway.
If you would like to give user feedback, please email TestandTrace.Statistics@ukhsa.gov.uk