Migration Advisory Committee (MAC) annual report, 2021 (accessible version)
Published 15 December 2021

© Crown copyright 2021
This publication is licensed under the terms of the Open Government Licence v3.0 except where otherwise stated. To view this licence, visit nationalarchives.gov.uk/doc/open-government-licence/version/3 or write to the Information Policy Team, The National Archives, Kew, London TW9 4DU, or email: psi@nationalarchives.gov.uk.
Where we have identified any third party copyright information you will need to obtain permission from the copyright holders concerned.
This publication is available at https://www.gov.uk/government/publications/migration-advisory-committee-annual-report-2021/migration-advisory-committee-mac-annual-report-2021-accessible-version
December 2021
Foreword
The Framework Document that covers our governance requires us to produce an annual report to inform Parliament and the public of the work we have done and our use of resources. It also suggests that the report contain comment on, and recommendations relating to, all aspects of the immigration system.
The new immigration system that began in 2021 coincided with the COVID-19 pandemic. This has produced operational challenges as well as making it difficult to isolate the effect of the immigration changes from the effects of the pandemic. On the operational side, we have heard from a number of stakeholders that the new Skilled Worker route has been launched smoothly and that the streamlining and digitisation of the route are working well. The Home Office are to be congratulated on this achievement. Numbers using the route have now recovered to the levels seen pre-pandemic, with the health sector remaining a key user of the route. Only a small share of visas have been issued to the occupations newly eligible (the RQF 3-5 jobs), though the care sector are actively using the route for senior care workers. We would expect the share of these new occupations to gradually rise over time as firms become more familiar with the new system.
In the last few months, the Government have agreed to some temporary visas for various occupations such as HGV drivers and poultry workers. There is a balancing act here between maintaining the general principles of the new Skilled Worker route and not being completely inflexible in the face of challenges that may have substantial consequences for the economy – some of which are the result of the pandemic. The MAC are generally supportive of the approach the Government have taken, though we have some concerns over the exact details of the routes. If the government wants to establish visa options for roles not currently eligible for the Skilled Worker route, we suggest that it may be more sensible to consider designing a formalised route that can be temporarily accessed under clear criteria, rather than announcing last-minute changes.
We have seen tragic deaths of people in the English Channel in recent weeks as they seek a better life in the UK. The asylum system faces many difficult challenges that must be addressed. The legal and operational aspects of the asylum system are outside of our remit, but the MAC are particularly focused on how good policy can ensure that asylum seekers integrate well into society. In that context, we urge the Government to review the ban on employment for asylum seekers. There is clear evidence of the harm that this causes, some of which we document in this Report, and little evidence that we are aware of that it provides significant benefits. The harm is exacerbated by the increasing numbers of asylum seekers who are having to wait over six months for an initial decision on their application.
We are currently in the middle of a commission investigating the impact of the ending of freedom of movement on the adult social care sector. We provide an update in this report on our preliminary findings and unusually are taking the opportunity to make a formal recommendation to the Government. Given the severe and increasing difficulties the sector is facing in terms of both recruitment and retention, we are recommending that care worker jobs immediately be made eligible for the Health and Care Visa and placed on the Shortage Occupation List. We will be producing the final report in April 2022.
The MAC also produced a review on the Intra-Company Transfer (ICT) route in 2021 which broadly concluded that the route was working well and served a useful purpose for international businesses. Our most substantive recommended change was that the ICT route should become a route for settlement. We also made recommendations on other aspects of global mobility. We look forward to receiving the Home Secretary’s response to this report.
We are again indebted to stakeholders who have taken the time during the year to assist us with our work, both in response to formal commissions and in on-going engagement. We have also continued our active engagement with the Devolved Administrations and have appointed new members of the MAC secretariat in each of the Devolved Nations. Finally, the Committee are grateful to the excellent work that the secretariat has done during this difficult year.
We look forward in the coming year to continue in advising the Government on the development of an immigration policy that delivers for the people of the United Kingdom.
Prof. Brian Bell (Chair)
Prof. Dina Kiwan
Prof. Sergi Pardos-Prado
Madeleine Sumption MBE
Prof. Jo Swaffield
1: The pandemic labour market and the new immigration system
Introduction
At the end of 2020, the UK immigration system saw some of the most substantial changes for a generation, as the UK came to the end of the transition period, having left the European Union. In addition, the UK has experienced significant impacts as a result of the ongoing COVID-19 pandemic. This chapter will provide an overview of the changes in the labour market, evidence from data on the new Skilled Worker route, and a discussion of the pressures facing sectors that do not have access to the new work route. We would emphasise that there remains a heightened level of uncertainty as to how the labour market will evolve over the next year and the effect that this will have on migration flows.
Overview of the UK labour market
After several years of falling unemployment and a strong labour market, the COVID-19 pandemic was a dramatic shock for the UK labour market. Nationwide lockdowns forced a number of sectors to effectively close down or significantly reduce their activity. This section will cover the overview of the UK labour market in light of the COVID-19 pandemic, exploring employment and vacancies, including a specific focus on sectoral and geographic differences in recovery.
Employment
Figure 1.1: Employment rate, 2006 to 2021
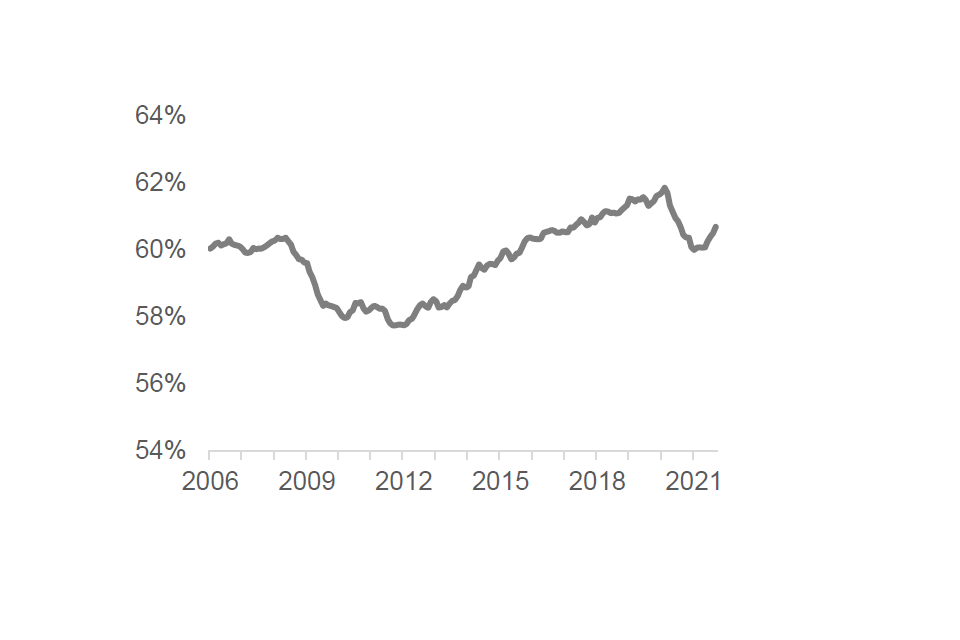
Figure 1.2: Economic inactivity and unemployment rate, 2006 to 2021
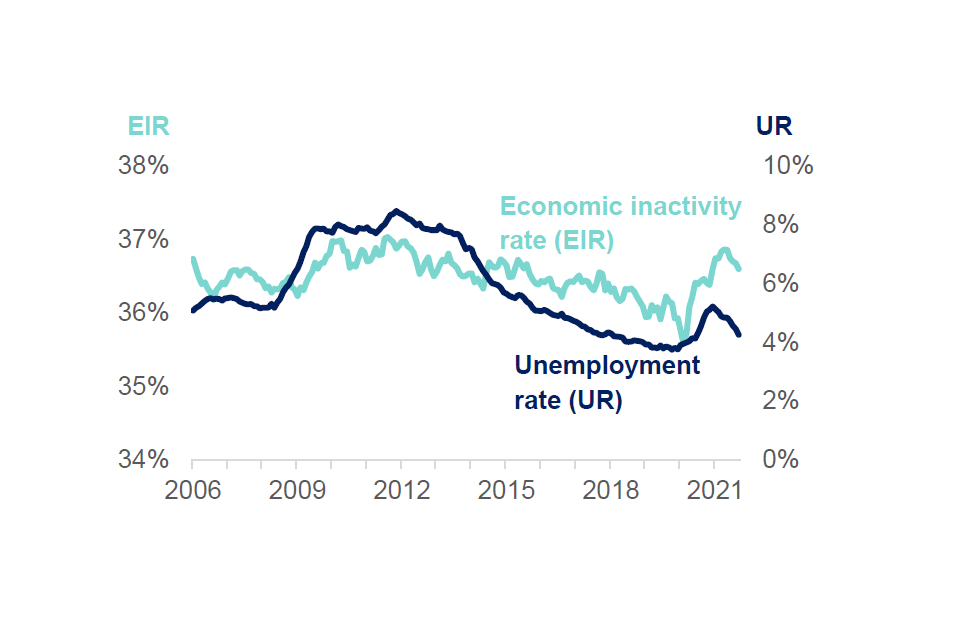
Source: ONS, Labour market statistics, November 2021.
Note: Seasonally adjusted data, includes all aged 16 and over. Each data point represents a three month period (e.g. Aug-Oct 2020). Data points have been grouped into year categories for ease of reading the chart, each year includes a data point from Nov-Jan, Dec-Feb, Jan-Mar, Feb-Apr, Mar-May, Apr-Jun, May–July, Jun–Aug, July–Sep, Aug–Oct, Sep–Nov and Oct-Dec. 2021 only includes data points up to May-July 2021.
Figure 1.1 shows the UK employment rate from 2006 to mid-2021. From 2013 until the onset of the pandemic, the employment rate was rising, as the recovery from the global financial crisis gathered pace. With the onset of COVID-19, the employment rate dropped by almost two percentage points, falling to 60% in November - January 2021. The decline in the employment rate was less severe than that witnessed during the financial crisis, despite the much more substantial decline in GDP. The furlough scheme, discussed below, was a key reason why employment held up much better.
Figure 1.2 shows the unemployment and economic inactivity rates for the same time-period. The financial crisis saw a significant and sustained rise in the unemployment rate, peaking at 8.5% in the second half of 2011. Mirroring the rise in employment, unemployment fell consistently over the following years to below 4% by early 2020. Whilst we saw rising unemployment in 2020, coinciding with the pandemic, the peak of 5.2% in Oct-Dec 2020 was significantly lower than that experienced during the 2008 financial crisis. The rise in unemployment has also been substantially lower than was forecast – at the time of our last Annual Report, the Bank of England predicted that unemployment would rise to 6.7% in the final quarter of 2021, whilst the most recent data report an unemployment rate of 4.3%, almost back to pre-pandemic levels. There has been a noticeable rise in economic inactivity rates since the start of the pandemic, with a peak of 36.9% in March – May 2021. This has since begun to decline but the rate is still around one percentage point higher than pre-pandemic levels, suggesting that some individuals have chosen to leave the labour force throughout the pandemic.
Figure 1.3: Number of individuals in employment and unemployed, millions
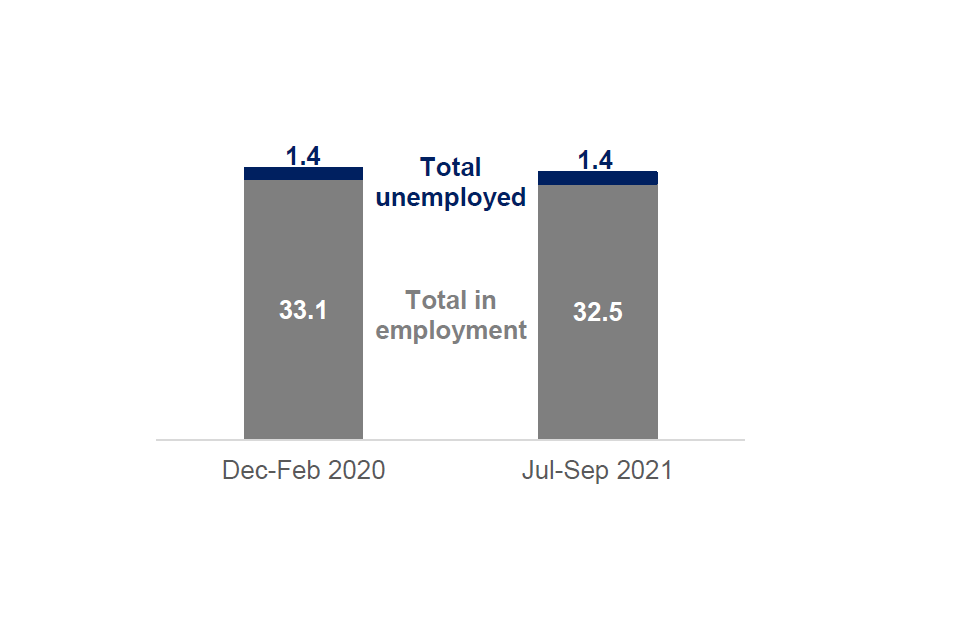
Source: ONS, Labour market statistics, November 2021
Note: Seasonally adjusted, for all aged over 16.
Figure 1.4: Number of individuals in economic inactivity, millions
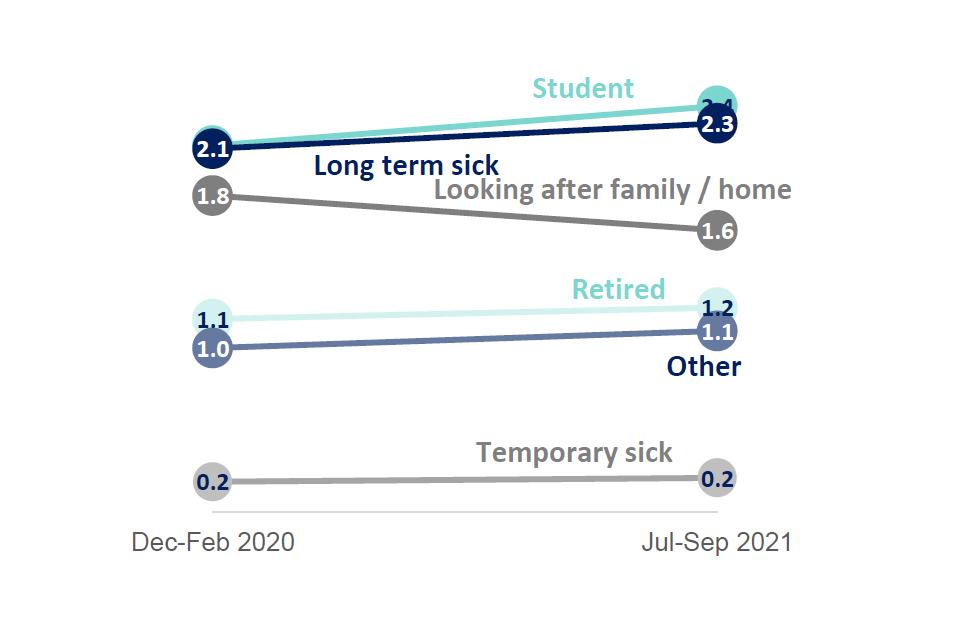
Source: ONS, Labour market statistics, November 2021.
Note: Seasonally adjusted, for those aged 16 – 64 years.
Figures 1.3 and 1.4 show the absolute levels of employment, unemployment, and economic inactivity both pre-pandemic (Dec 2019 - Feb 2020) and in the most recent data (July - Sep 2021). The number of people in employment has declined by just over half a million between these dates, highlighting that the labour market has still not fully recovered. However, the make-up of employment has changed significantly. ONS data shows that the number of employees in employment are now 255,000 above pre-pandemic levels (Dec 2019 - Feb 2020), whilst self-employment has dropped by 751,000. The rise in the number of employees broadly matches the change in the real-time number of payroll employees using HMRC data, that show a rise of 235,000 over the same period. Interestingly, ONS data shows the rise in employees is entirely due to full-time work, as the number of part-time employees is still 388,000 below pre-pandemic levels.
Most of the decline in total employment has fed through to a rise in the number who are economically inactive rather than to unemployment. The number of unemployed is currently only 84,000 above pre-pandemic levels, whilst the number of inactive has risen by 364,000 (Figure 1.4). The number of individuals in economic inactivity due to being a student, long-term sick, retired and other has risen. It is uncertain how this rise in inactivity will play out over the coming years. Some of the rise may reflect a permanent change as workers chose to retire earlier than planned or pursue other activities as a result of the pandemic changing attitudes and behaviours. This will then reduce labour supply. It may also reflect the rise in people extending their studies, where it is reasonable to expect some will flow into the labour market when conditions are better. It is important to remember however that around one-fifth of the economically inactive (a pool of 1.7m individuals) report that they want a job. Firms with the right job offer may well be able to hire from this pool, though it may require more targeted recruitment. It is difficult to predict what the net impact on supply will be when combining early retirement and delayed access or return to the labour market for younger people.
Much of the reason for the more subdued labour market response to the large decline in GDP, compared to previous recessions, can be attributed to the policies the Government introduced in response to the crisis. The furlough scheme paid employers 80% of their employees’ wages if they could no longer work. The scheme had several changes throughout including allowing employees to be partially furloughed, as well as the amount the employer had to contribute. This is unlike any other policy implemented historically and was clearly successful in keeping individuals in employment. Figure 1.5 below shows the number of employees furloughed from March 2020 until August 2021.
Figure 1.5: Number of employees furloughed (millions)
Source: Coronavirus Job Retention Scheme statistics, November 2021.
Note: Furlough statistics are published by the day, these represent the number of employees furloughed as at the end of every month (e.g. March 20 is 31/03/2020).
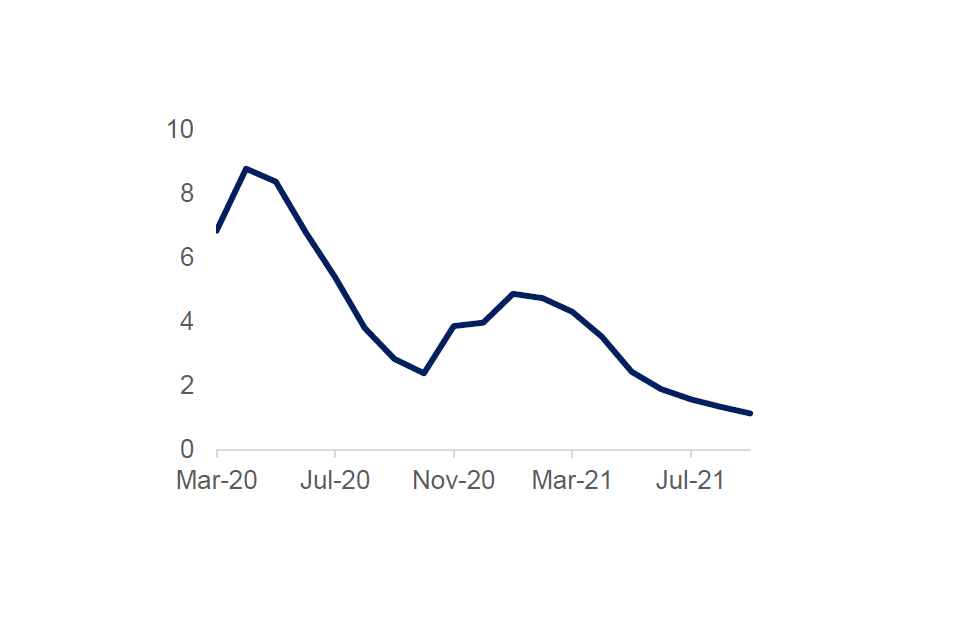
Figure 1.6: Average hours worked, January 2020 to June 2021
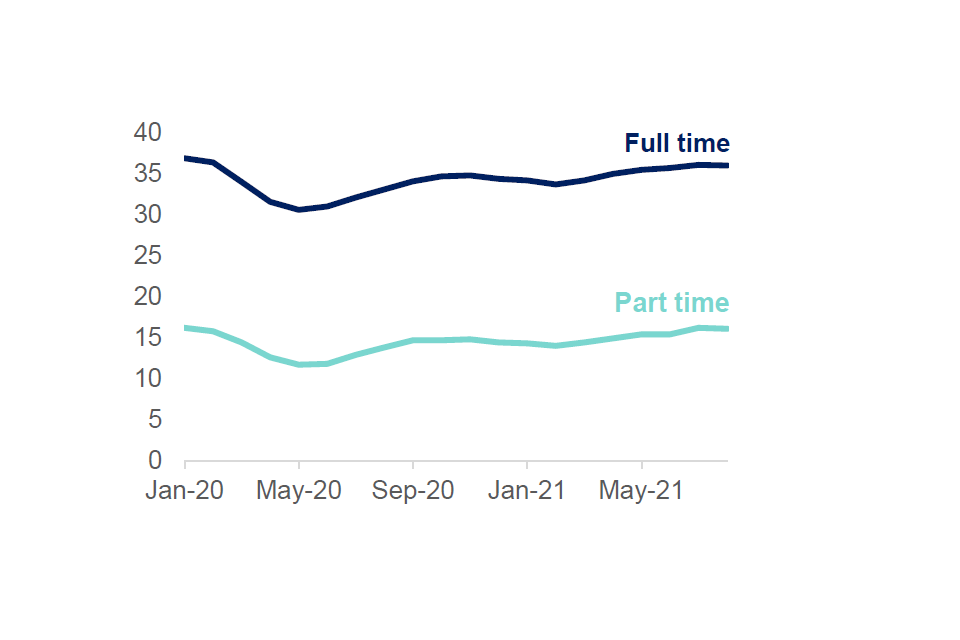
Source: ONS, Labour market statistics, November 2021.
As shown in figure 1.5, the furlough scheme supported many jobs, particularly during the nationwide lockdowns where many industries were forced to effectively close. The number of employees furloughed peaked at 8.9m in mid May 2020, which was over 30% of total employees. The introduction of this alongside other measures such as the Self-Employed Income Support (SEIS) scheme helped to reduce the negative impact of the pandemic on the labour market.
Whilst the impact on unemployment has been relatively muted, we can see the effect of the pandemic in the average number of hours worked in Figure 1.6. The average number of hours dipped to a low in May 2020 for both full and part time (30.6 and 11.7 hours respectively). Whilst hours have gradually risen since then, they were still slightly below pre-pandemic levels in June 2021, which is likely to be reflective of the ongoing furlough scheme which has only recently ended in September 2021.
Vacancies
Figure 1.7 shows the total number of vacancies from August 2012 to October 2021. As the economy recovered from the financial crisis, vacancies rose significantly. As the pandemic hit and the first national restrictions were imposed, vacancies fell to a low of 340,000, the lowest number observed since the ONS Vacancy Survey began in 2001. As the pandemic eased and restrictions were relaxed, vacancies rapidly rebounded, and by October 2021 there were almost 1.2m vacancies, the highest on record.
Figure 1.7: Vacancies July 2012 – October 2021 (thousands)
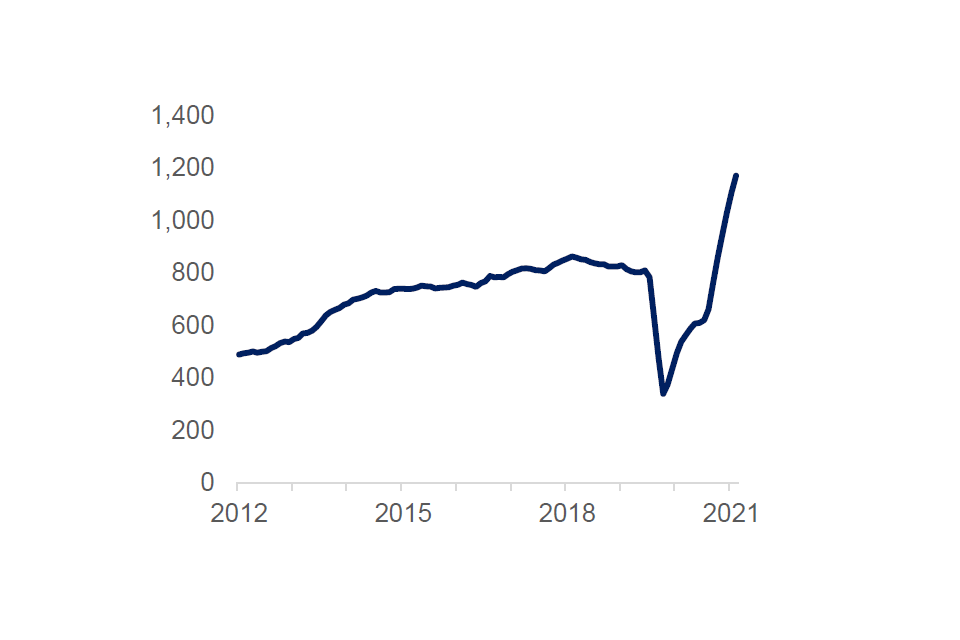
Source: ONS Vacancy Survey, 2012 – 2021.
Figure 1.8: Index of job vacancies by qualification level required, monthly (Index 100 = September 2019)
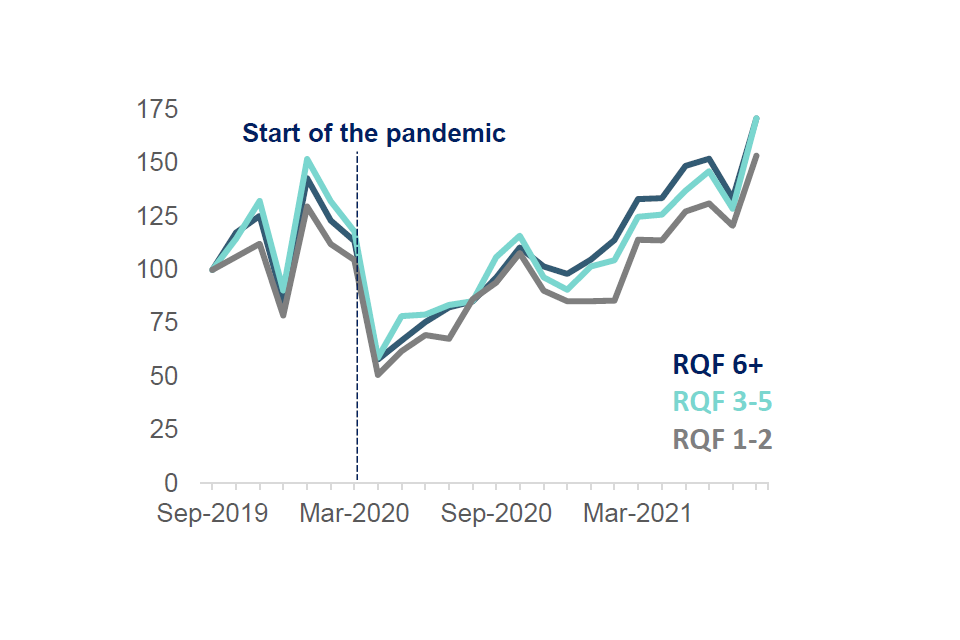
Source: Labourinsight Burning Glass, 2019 – 2021.
Some occupations were impacted more than others as a result of the pandemic, with jobs requiring different skill levels affected differently. Figure 1.8 shows the change in vacancies by RQF skill level required for the job advertised.
Across all skill levels in Figure 1.8, vacancies dropped by 50% from March to April 2020, and there were no particularly noticeable differences across skill levels. Vacancies in all skill levels followed the same initial pattern of recovery but fell again when restrictions were reimposed in November 2020. Vacancy levels for RQF 1-2 jobs stagnated between December 2020 and February 2021. In the same period, vacancies in RQF 3-5 and RQF 6+ jobs increased by 15% and 16% respectively, showing that they had started to recover before RQF 1-2 job vacancies did.
Sector focus
The COVID-19 pandemic and the restrictions introduced as a result had a different impact across sectors within the economy. Sectors such as hospitality and retail faced closure or limited opening rules when restrictions were in place. This section will focus on exploring this differential impact and the recovery in these labour markets.
Figure 1.9 shows the levels of employment for certain industries in December 2019 and October 2021. This shows that these selected industries have broadly recovered to pre-pandemic levels.
Figure 1.9: Number of payroll employees by industry (thousands), December 2019 to October 2021
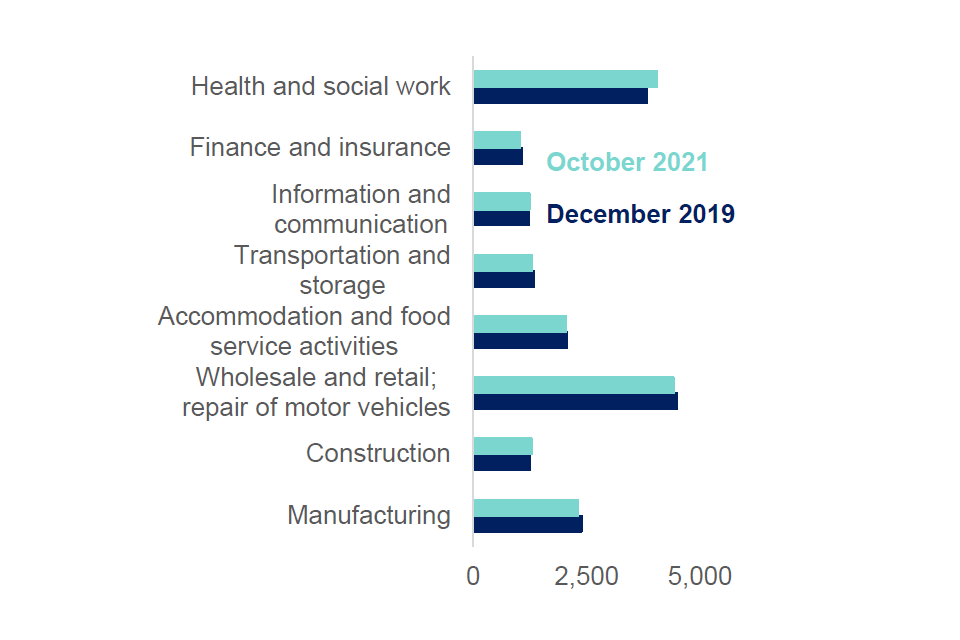
Source: Employees by industry (SIC07), Pay As You Earn Real Time Information, November 2021. Seasonally adjusted.
Figure 1.10: Number of job vacancies by selected industry, December-February 2020 and August-October 2021 (thousands)
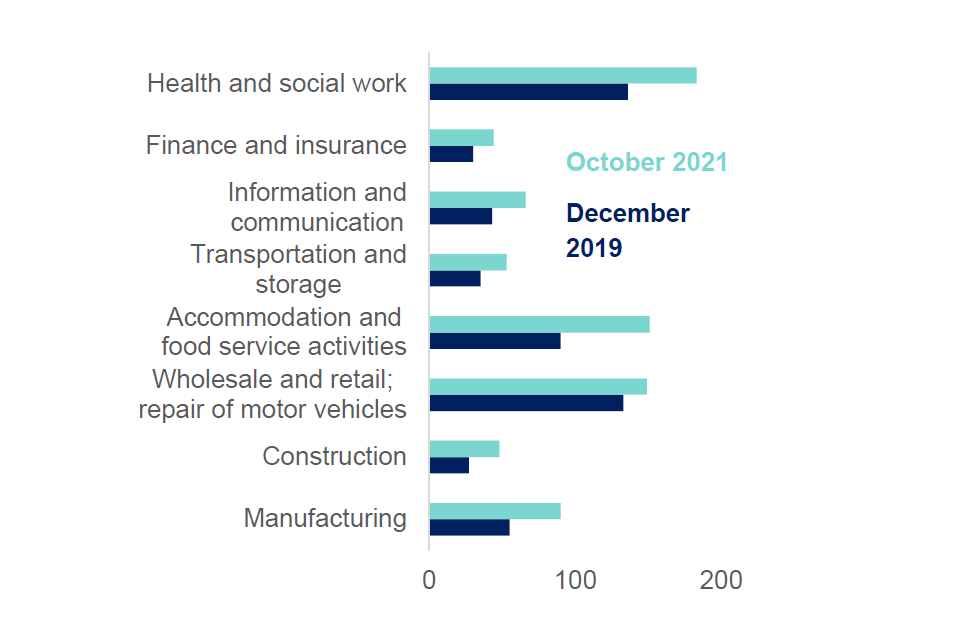
Source: ONS Vacancy Survey, November 2021, table VACS02.
Figure 1.10 shows the number of vacancies in the same selection of industries. All the industries shown have a higher number of vacancies now compared to pre-restrictions. Vacancies are over 50% higher now than pre-pandemic in manufacturing, construction, information and communication, accommodation and food service activities, and transportation and storage. This aligns with the trend seen in Figure 1.7, with a sharp recovery in vacancy numbers in recent months.
Geographical impact
The COVID-19 pandemic also produced different impacts across the nations and regions of the UK. Some of this was a result of regional restrictions introduced in the latter half of 2020 which saw different regions experience different levels of closures. Regions have also experienced different levels of recovery, with cities and urban areas more heavily impacted by the shift to working from home.
Figure 1.11: Change in levels of employment by region, December 2019 to October 2021
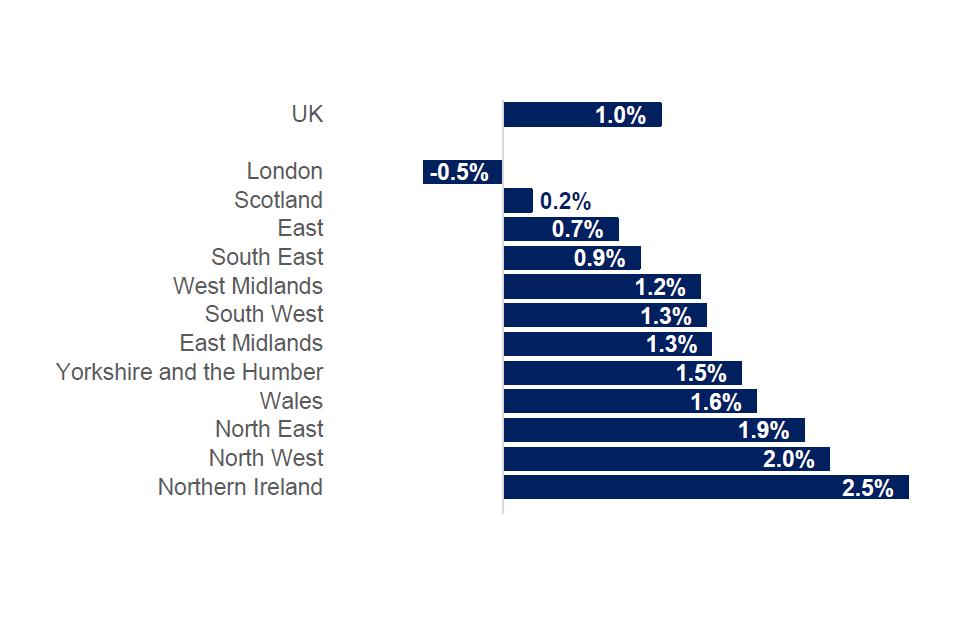
Source: Pay As You Earn Real Time Information, seasonally adjusted, November 2021.
Figure 1.11 focuses on the change in levels of employment from pre-pandemic to October 2021, highlighting the differential impact across regions. The UK as a whole experienced a rise in levels of employment compared to pre-pandemic level. London was the only region to see a fall compared to pre-pandemic levels potentially reflecting the impact on cities described above. Whilst the South East, East, and Scotland saw a rise in levels, this was lower than the UK.
Summary
Overall, we have seen significant impacts on the labour market as a result of the COVID-19 pandemic. Policies introduced such as the furlough scheme helped to protect jobs and employment fell less (and unemployment rose less) than would have been expected given the size of the economic shock. The furlough scheme has now closed, and early indications suggest that this has had no substantial impact on unemployment, though this will become clearer in the December publication of the ONS Labour Market Overview. The rise in inactivity may partly be a short-term response to the pandemic but may also reflect longer run changes in attitudes to work. Vacancies have rebounded sharply in the last few months across all skill levels and employers are reporting increasing difficulty in filling these vacancies.
The new immigration system
At the end of 2020, the UK’s immigration system saw a substantial change. The new Points Based System (PBS) was introduced in December 2020, alongside the ending of freedom of movement for EEA nationals at the start of 2021. The new Skilled Worker (SW) route replaced the Tier 2 General (T2(G)) route as the main route for skilled work into the UK. SW applicants must have a job offer with a salary of at least £25,600 or the going rate for the occupation, although there are lower salary rates for shortage occupations, people with PhDs, and new entrants to the labour market.
Under this route the range of jobs that can be filled by migrants on a skilled work visa has expanded to include those at RQF 3-5 (at or above A-level, NVQ3 or equivalent), reducing the threshold from RQF 6+ (Degree level or equivalent and above). The general salary threshold was also reduced from £30,000 to £25,600, in line with MAC recommendations (PDF, 3.5 MB), to reflect the broader group (RQF 3-5) who are now eligible occupations for this route. Lower thresholds may be in place if the occupation is listed on the Shortage Occupation List (SOL), the individual has a PhD, or if the occupation is based on national pay scales but can in no circumstance be less than £20,480.
This section of the report will focus on the use of the new system, including the use of the SW route, particularly focusing on usage by EEA nationals and uptake by those from non-EEA countries working in occupations at RQF 3-5 who were previously ineligible for the route.
Use of the new system
Figure 1.12 shows the number of visa applications for the T2(G) and SW route from January 2019 to September 2021. Given the uncertainty around the COVID-19 pandemic we had in our Annual Report 2020 (PDF, 2MB) anticipated limited use of the new SW route in at least the first half of 2021. It is difficult to isolate the separate impact of COVID-19 and the introduction of the new immigration system in the data presented in Figure 1.12, as both occurred at a similar time.
There was a clear decline in the number of applications during the first national lockdown as a result of the pandemic making cross border movements more difficult and the temporary closure of the UK Visa Application Centres (UK VACs) making it difficult for individuals to apply for visas to enter the UK. Visa processing times were also impacted by decision makers needing to access office locations to complete processing. By contrast, subsequent lockdowns appear to have had very little effect on visa applications for the work route, and in fact in the first three months of 2021 the number of visa applications was over 70% higher than that seen in the first three months of 2019.
Figure 1.12: Total visa applications for T2(G) and SW route, January 2019 to September 2021
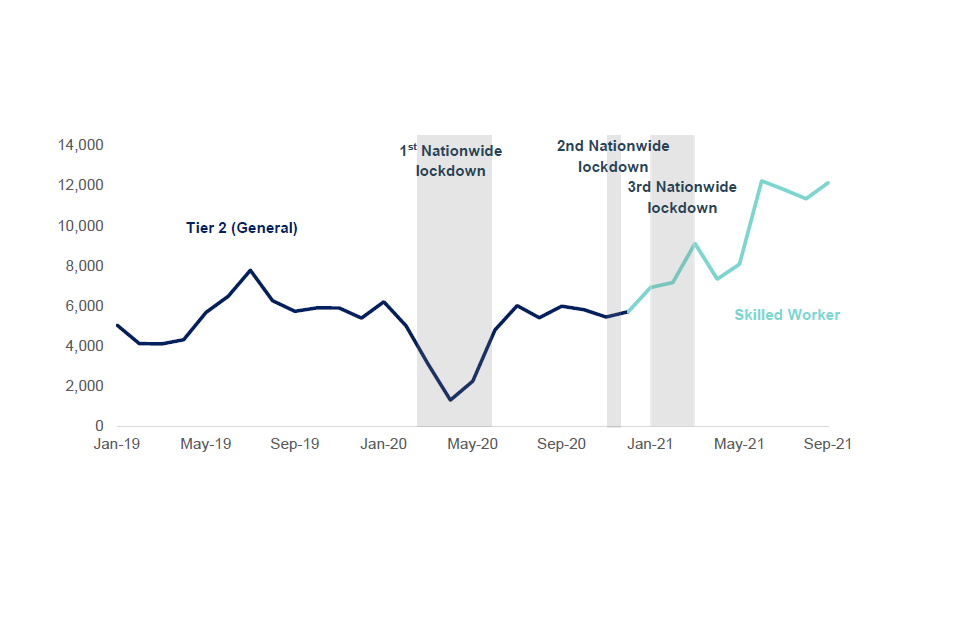
Source: Home Office Management information, Certificate of Sponsorship (CoS) data 01 Jan 2019 to 30 Sept 2021.
Note: Used CoS. CoS is assigned to a migrant by their sponsoring employer and the migrant can then use the certificate number to make a visa application.
Figure 1.12 shows a substantial rise in applications in the months following the ending of the third national lockdown, with monthly applications rising by over 50% between May and June 2021. Part of this rise may well have been the result of pent-up demand for visas, but the number of applications continues to be higher than levels seen in 2019, consistent with the tighter labour market we have described. It will be important to monitor further usage of the route to understand long term migration trends.
During discussions with stakeholders, many have praised the operation of the new immigration system and have found it more user-friendly and efficient than the previous system. It should be noted that these stakeholders would have been familiar with the previous system, so may not be representative of the experience of SMEs and others who may not have previously had any significant interaction with the work visa system. Whilst the lower levels of applications during the pandemic may have helped to smooth out the move to the new system, it is also difficult to launch a new system during a pandemic and the Home Office deserves credit that the move to the new system appears to have been operationally successful.
Who is using it?
After decades of free movement, from January 2021 EEA nationals wanting to work in the UK must apply to the SW route, alongside migrants from all other nationalities. As a result, the data on the two visa routes are not directly comparable, as the SW route data includes EEA nationals whilst T2(G) did not. Figure 1.13 shows the usage of the SW route by these groups between January 2021 and September 2021.
Figure 1.13: Total SW route visa applications January 2021 to September 2021, split by EEA and Non-EEA nationality
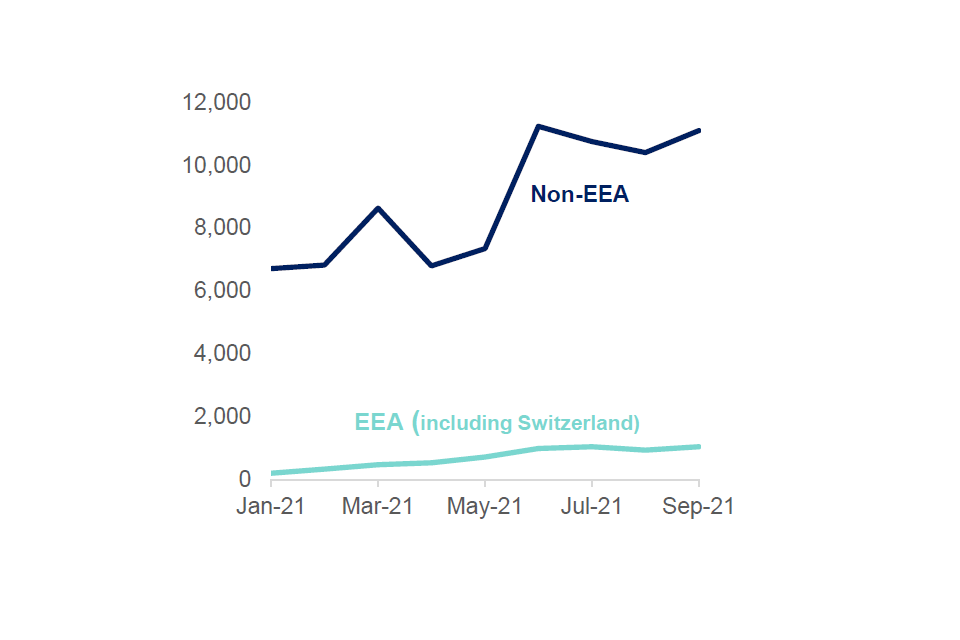
Source: Home Office Management information, Certificate of Sponsorship (CoS) data 01 Jan 2021 to 30 Sept 2021.
Note: Used CoS. CoS is assigned to a migrant by their sponsoring employer and the migrant can then use the certificate number to make a visa application.
Figure 1.14: SW and T2(G) applications by migrant nationality, Non-EEA only
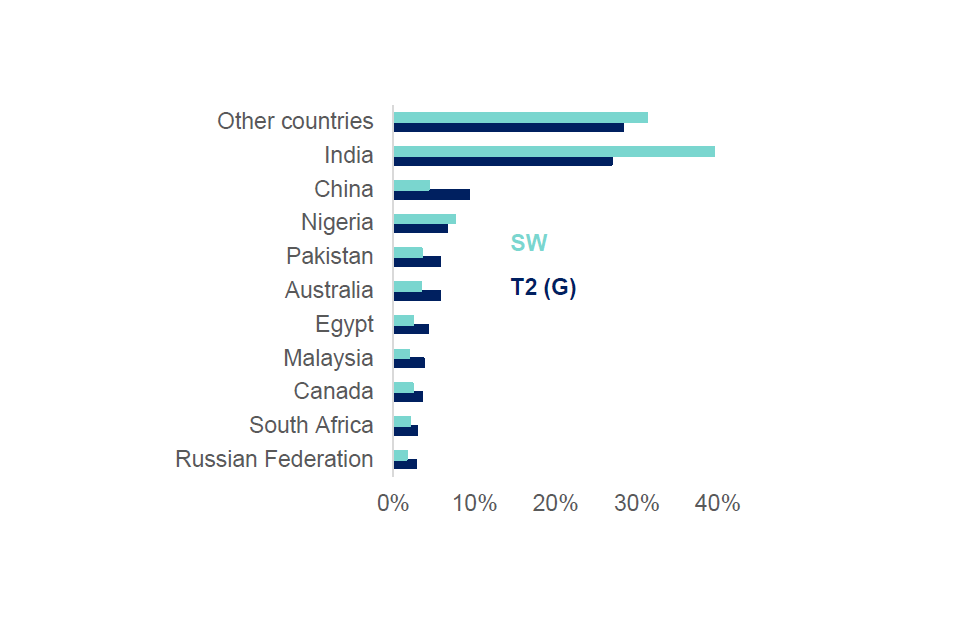
Source: Home Office Management information, Certificate of Sponsorship (CoS) data 01 Jan 2019 to 30 Sept 2021.
Note: T2(G) is for 01 January 2019 – 30 November 2020. SW is 01 December 2020 – 30 September 2021. Used CoS. CoS is assigned to a migrant by their sponsoring employer and the migrant can then use the certificate number to make a visa application.
Figure 1.13 shows that the recovery in visa applications during 2021 was primarily driven by non-EEA nationals, as there is relatively low usage from EEA nationals compared to the rest of the world. EEA nationals made up only 8% of applications over this period. Figure 1.14 suggests that some countries have experienced a small decline in the number of applications while there has been a substantial rise in the share of work visas issued to Indian nationals.
As with the previous T2(G) route, the SW route requires employers to sponsor employees ahead of them applying for their visa. Certain occupations where there is increased demand for labour may be driving changes in the number of applications. The UK saw a large increase in applications in the second quarter of 2021, with the number of visa applications 68% higher than in the same quarter in 2019. Approximately 17% of this increase was due to the rise in applications for those entering nursing and midwifery professionals’ occupations. The top five occupations in terms of absolute increases seen in the number of visa applications between 2020 and 2021 are shown in Figure 1.15 below.
Figure 1.15: Number of visa applications by occupation, for top five in terms of absolute increases between 2020 and 2021, Q2 2019, Q2 2020 and Q2 2021
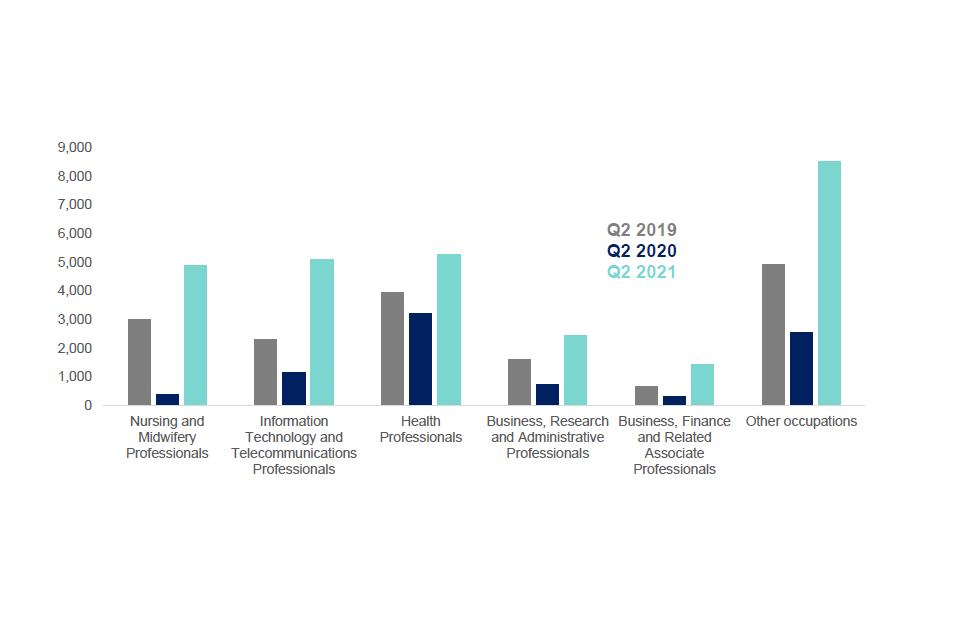
Source: Home Office Management information, Certificate of Sponsorship (CoS) data Q2 2019, Q2 2020 and Q2 2021.
Note: Used CoS. CoS is assigned to a migrant by their sponsoring employer and the migrant can then use the certificate number to make a visa application.
Of the total number of visa applications in the second quarter of 2021, almost 70% were for jobs in these five occupations. Figure 1.15 shows the large increases seen in the number of visa applications across these occupations. The substantial rise seen in the number of visa applications for Nursing and Midwifery professionals and health professionals may reflect some of the shortages seen in the sector throughout the COVID-19 pandemic. However, Migration Observatory analysis shows that this is also a longer-term trend with IT and health being the two largest industry users of the skilled work visas.
Whilst there are a number of factors at play, which may have driven the rises we see in the number of visa applications in the second quarter of 2021, it is likely to be a combination of the reopening of the economy and certain occupations seeking an increased number of people to work.
RQF 3-5 occupations
Employers can now sponsor employees for roles that are RQF 3-5 (at or above A-level, NVQ3 and equivalent) under the SW route. Figure 1.16 shows that so far in 2021 we have seen little use of the route for these expanded occupations, with over 90% of applications being for roles at RQF 6+. Breaking the data by nationality shows no significant difference, with EEA and non-EEA nationals applying for RQF 6+in 86% and 91% of applications respectively. Of the 5,200 applications for roles in RQF 3-5 occupations over a third were for senior care workers. The rate of applications for senior care workers has risen over the course of the year and is currently around 400 – 500 per month.
Figure 1.16: Proportion of visa applications by RQF level
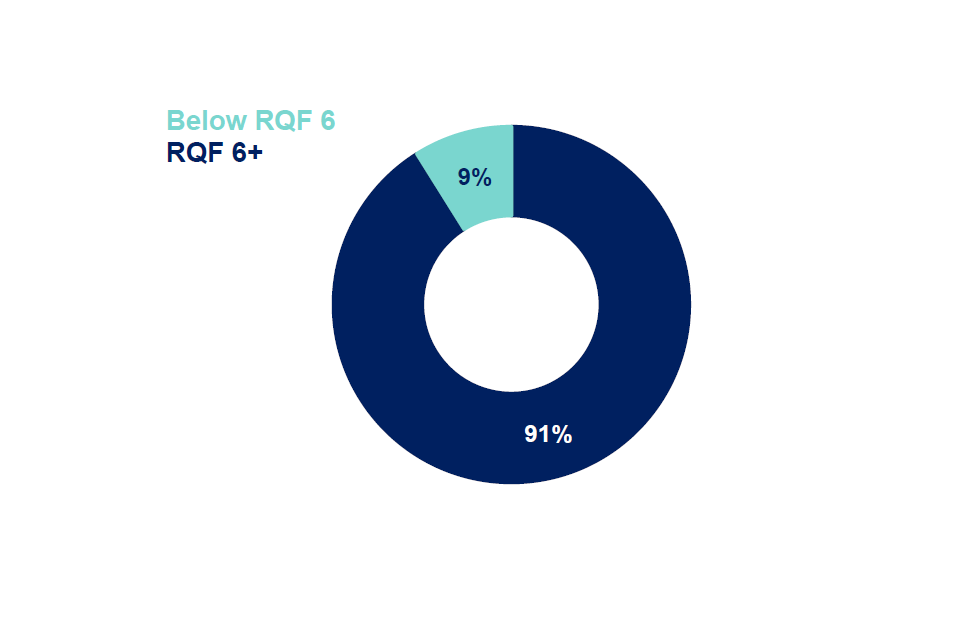
Source: Home Office Management information, Certificate of Sponsorship (CoS) data 01 Jan 2021 to 30 Sept 2021.
Note: Used CoS. CoS is assigned to a migrant by their sponsoring employer and the migrant can then use the certificate number to make a visa application.
In our Annual Report 2020 (PDF, 2MB), we discussed the costs for employers in hiring a worker from abroad and anticipated that many would conclude that it is not feasible to use the new SW route for hiring RQF 3-5 workers as a result of these associated costs. The low usage of the route for occupations below RQF 6 in 2021 so far supports this hypothesis. Chapter four of this report will cover the costs of using the immigration system in more detail and shows that the costs of using the immigration system are proportionately much larger for lower paying jobs and also comparatively higher than other countries which might make the UK less competitive when attracting skilled workers.
More generally, we might expect a heavier usage of the SW route for RQF 6+ jobs compared to RQF 3-5. Such jobs tend to be filled by more internationally mobile staff and many such occupations compete globally for talent. This is less common in RQF 3-5 jobs. In addition, the training time required to become competent in an RQF 3-5 job is generally significantly lower than at RQF 6+ level, so some employers may find it easier to recruit and train UK workers for vacancies even if there is a skill shortage.
Regional Focus
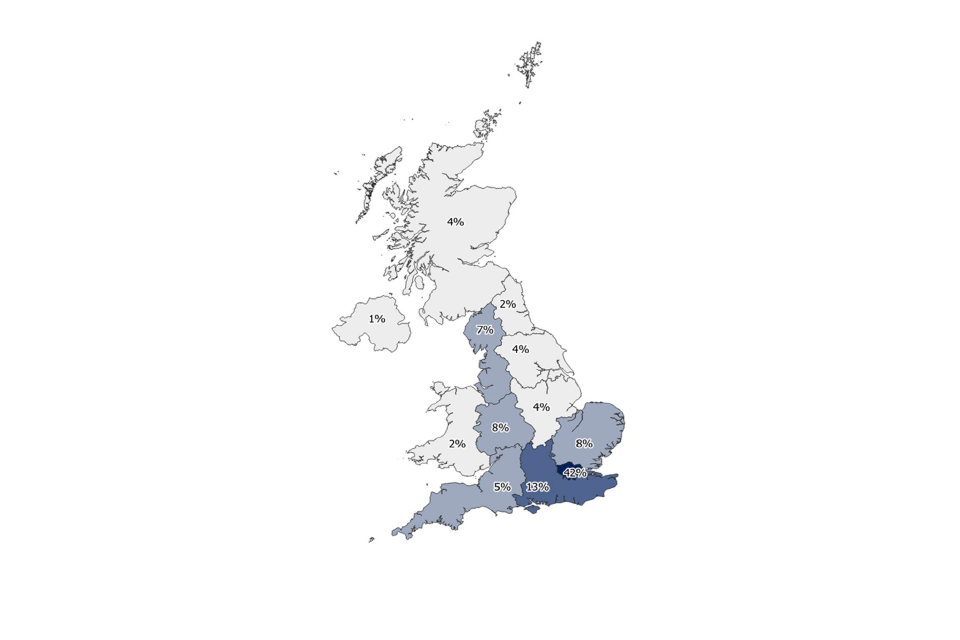
Figure 1.17 shows that the highest share of SW applications in 2021 are in London, which accounts for 42% of the total visas in 2021. This may be reflective of the occupation skill mix, with London having a higher share of RQF 6+ occupations. It may also be a result of the salary threshold being relatively cheaper for London based companies, where wages tend to be higher. The MAC intend to look into the regional use of the immigration system in more detail in future.
Figure 1.17: Applications by Government office region, 2021
Source: Home Office Management information, Certificate of Sponsorship (CoS) data 01 Jan 2021 to 30 Sept 2021.
Note: Used CoS. CoS is assigned to a migrant by their sponsoring employer and the migrant can then use the certificate number to make a visa application. This refers to region of workplace, this might differ to the region the migrant lives in.
Shortage Occupation List (SOL)
The SOL contains those occupations, amongst those eligible for the SW route, which are judged to be in ‘shortage’ i.e. where employers find it difficult to secure adequate numbers of workers with the required skills to fill their vacancies, and where we judge migration is a sensible response to that shortage. Decisions on which occupations to include on the SOL are made by Ministers following recommendations from the MAC. These occupations are then subject to different, more favourable, migration arrangements, enabling employers to access a wider pool of suitable workers, at a lower threshold of £20,480 or 80% of the going rate, whichever is higher. This lower threshold is the primary advantage of an occupation being listed on the SOL in the SW route.
Figure 1.18 shows that 54% of visa applications in the first nine months of 2021 were for occupations that are listed on the SOL. This is an increase to that seen in 2020 (43%), and a significant rise on the 17% in 2019. This figure may suggest a significant effect of the COVID-19 pandemic, since SOL visa applications increased substantially before the new immigration system was in place. With travel restrictions in place and significant uncertainty in the economy some employers may have chosen to pause recruitment from abroad, whereas those recruiting for occupations on the SOL may have continued as they are in ‘shortage’. It might also be reflective of the larger list of occupations now listed on the SOL. It will be interesting to monitor this trend to see if it continues in future years, to determine whether this is an effect of the pandemic or not, given the rise in healthcare occupations seen.
Figure 1.18: Breakdown of Visa applications by SOL and non-SOL, 2019-2021
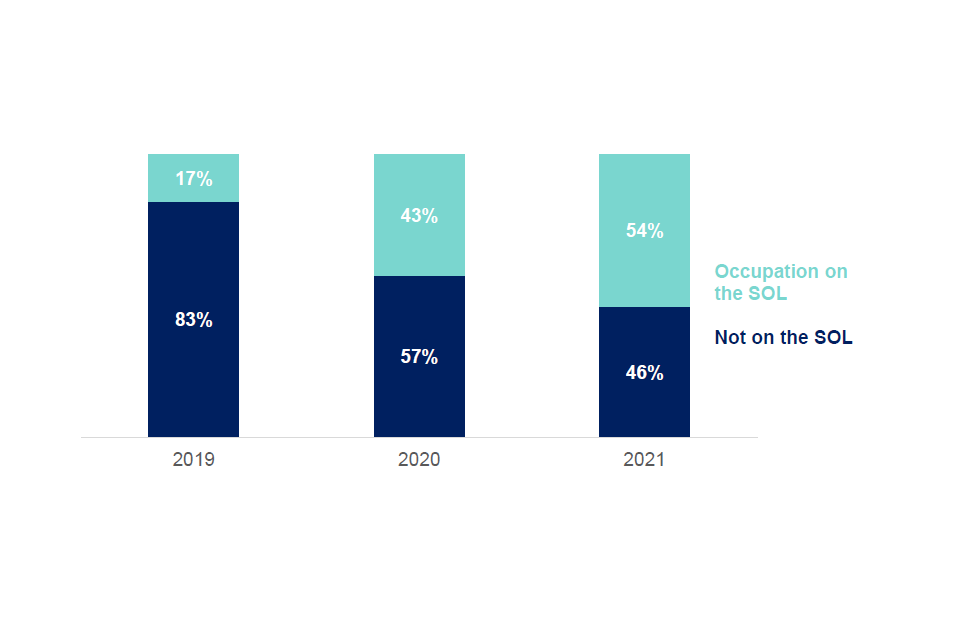
Source: Home Office Management information, Certificate of Sponsorship (CoS) data 01 Jan 2019 to 30 Sept 2021. 2021 is not the fully year and only includes applications up to the end of September.
Note: Used CoS. CoS is assigned to a migrant by their sponsoring employer and the migrant can then use the certificate number to make a visa application.
Table 1.19: SOL occupations that can pay below the going-rate threshold
| Occupation | 25th percentile | SOL threshold |
|---|---|---|
| Health services and public health managers and directors | £38,400 | £30,720 |
| Physical scientists | £36,500 | £29,200 |
| Civil engineers | £35,000 | £28,000 |
| Mechanical engineers | £33,400 | £26,720 |
| Electrical engineers | £37,000 | £29,600 |
| Electronics engineers | £34,700 | £27,760 |
| Design and development engineers | £34,100 | £27,280 |
| Production and process engineers | £33,100 | £26,480 |
| Engineering professionals n.e.c. | £32,700 | £26,160 |
| IT business analysts, architects and systems designers | £36,600 | £29,280 |
| Programmers and software development professionals | £33,300 | £26,640 |
| Veterinarians | £32,500 | £26,000 |
| Actuaries, economists and statisticians | £32,800 | £26,240 |
| Architects | £35,000 | £28,000 |
Source: Skilled Worker visa: shortage occupations.
Note: This excludes health and education occupations listed on the SOL on national payscales.
As mentioned previously, the primary advantage of an occupation being listed on the SOL is the lower salary threshold. Table 1.19 shows the occupations that are listed on the SOL and are able to pay below the going rate.
The MAC has never supported lowering the salary threshold below the ‘going rate’ for an occupation. If there is a shortage in the occupation, it seems perverse that paying lower wages will address the issue. Furthermore, the ‘going rate’ thresholds are in place to prevent undercutting of resident workers and being placed on the SOL should not enable employers to avoid this constraint. In practice, few employers are using this advantage, with only 15% of applications for these select SOL occupations in the first nine months of 2021 paying below the ‘going rate’. The evidence that few are taking advantage of this suggests it is not helpful for employers either, and we would therefore recommend that the Government reconsider whether SOL occupations should be allowed to pay below the ‘going rate’ for the occupation.
In contrast, the MAC are more supportive of a lower salary threshold for lower paid occupations on the SOL, which are generally RQF 3-5 jobs, where this will not lead to undercutting. For example, senior care workers would face a salary threshold of £25,600 (the general threshold) if they were not on the SOL. This is above the 75th percentile of the wage distribution for this occupation, making it an unrealistic route for most such jobs. The 20% discount on the general threshold that being on the SOL allows, reduces the threshold to £20,480. This is still comfortably above the ‘going rate’ for this occupation (£16,900), reducing any concerns over undercutting. The MAC would suggest that any salary threshold advantage to being on the SOL should be limited to those occupations where such a reduction does not go below the ‘going rate’ for that occupation.
RQF 1-2 occupations
As detailed in the new immigration section, the ending of freedom of movement for EEA migrants at the start of 2021 was a substantial change. Previously EEA migrants were not restricted in terms of which occupations they could migrate to the UK to work in. Now, new EEA migrants arriving in the UK on a work visa are no longer able to apply for RQF 1-2 (below A-level, NVQ3 or equivalent) occupations, though those arriving as dependents may work in these roles.
Prior to the ending of freedom of movement almost half of EEA nationals worked in RQF 1-2 occupations. In our Annual Report 2020 (PDF, 2MB), we discussed how this change could result in a tighter labour market for such jobs in the UK. However, this was expected to depend on the COVID-19 pandemic and unemployment levels at the time. This section will provide an update on this and cover some of the temporary visa routes the Government have implemented where there have been issues in the labour market for these occupations.
Labour market for RQF 1-2 jobs
Figure 1.20: Level of employment in selected RQF 1-2 occupations (Index 100 = 2015/16)
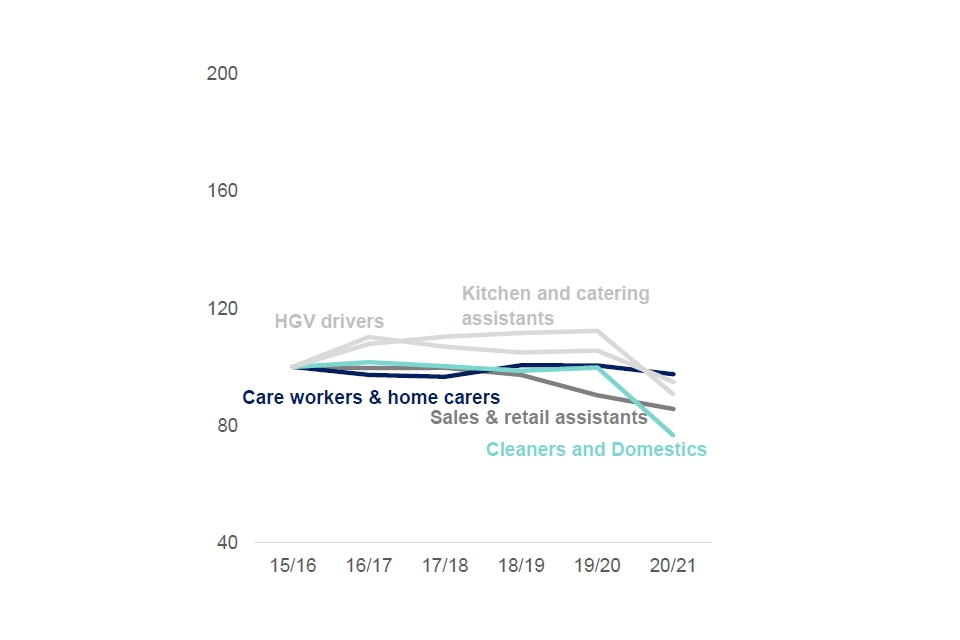
Source: Annual population survey, April – March.
Figure 1.21: Level of vacancies in selected RQF 1-2 occupations, (Index 100 = 2015/16)
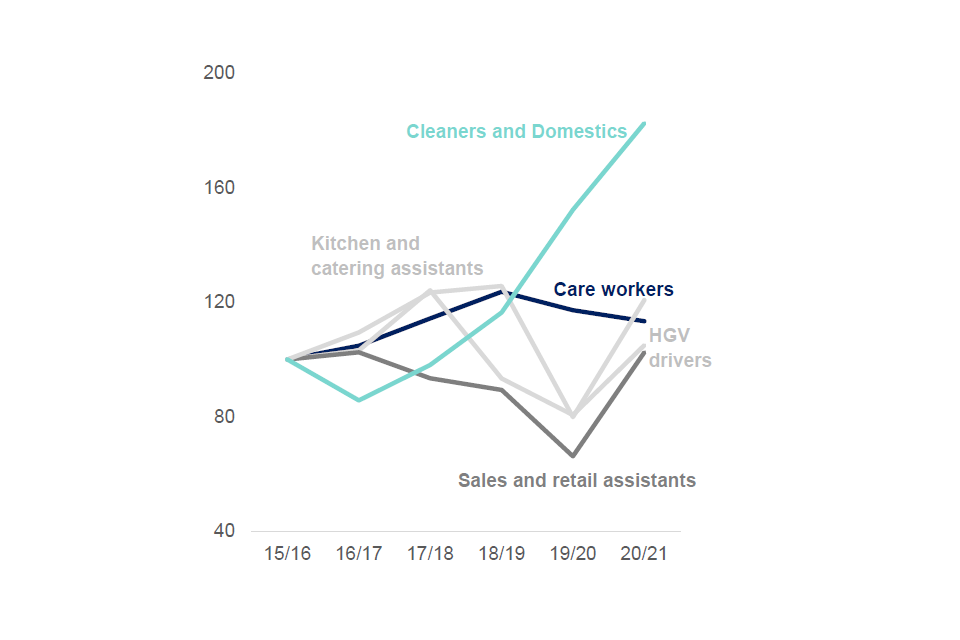
Source : Skills for Care (Care workers), LabourInsight Burning Glass (all others).
Note : For LabourInsight Burning Glass, Years are start of October to end of September, e.g. 1st October 2012 to 30 September 2013 is 2012/13. For Skills for Care data, years are from April to March.
Figure 1.20 shows the indexed level of employment in selected RQF 1-2 occupations. Since 2015/16, employment has remained relatively stable across occupations, however sales and retail assistants and Cleaners and domestics faced a fall in the levels of employment in 20/21. However, this data does not capture the rebound in employment after the ending of the third lockdown. Figure 1.21 shows the number of vacancies in the same selected RQF 1-2 occupations. Across all the selected occupations we see a rise in vacancies between 2019/20 and 2020/21, except for care workers. More recent data for care workers and latest vacancy rates is shown in the social care section; Figure 1.21 does not reflect a rise in vacancy rates in the sector that has been observed since the end of March 2021.
Figure 1.22: Median gross hourly pay (nominal) 2015, 2019 and 2021
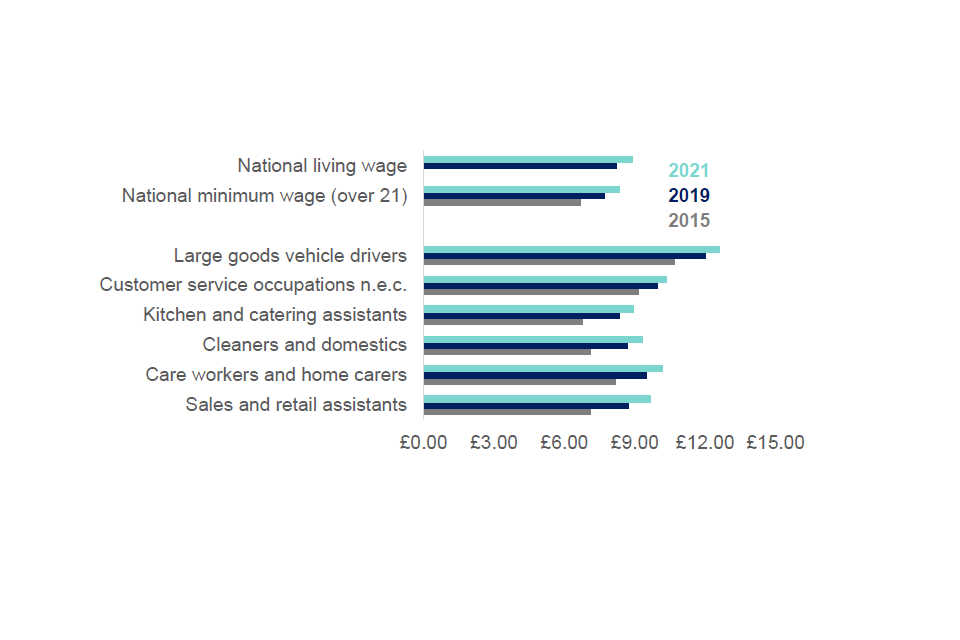
Source: Annual Survey of Hours and Earnings (ASHE), Table 15.5a Gross hourly pay, 2015 (r), 2019 (r) and 2021 (p). National minimum wage and living wage rates.
Figure 1.22 shows the median nominal gross hourly pay for selected RQF 1-2 occupations in 2015, 2019 and 2021. Between 2015 and 2019 the National Minimum Wage (NMW) increased by 15% for those aged over 21. Some of the selected occupations median hourly pay grew faster than this: sales and retail assistants (23%), cleaners and domestics (22%) and kitchen and catering assistants (23%). These occupations had slightly lower median hourly pay than large goods vehicle drivers (£10.69) and customer service occupations (£9.98) and were therefore likely to be more affected by changes in the minimum wage.
RQF 1-2 occupations and EU exit
Table 1.23 shows the proportion of RQF 1-2 workers by nationality. Both at the time of the Brexit referendum and at the beginning of the pandemic around 9% of RQF 1-2 workers were EEA nationals. To put this into context EEA nationals account for 7% of the UK workers across all occupations, so they are somewhat over-represented in these occupations. More substantial changes in the proportions of EEA workers may be expected going forward as we see the impact of a decreasing flow of EEA nationals into the UK.
Table 1.23: Proportion of RQF 1-2 occupations by nationality
| Nationality | 15/16 | 19/20 |
|---|---|---|
| EEA | 8% | 9% |
| Non-EEA | 4% | 4% |
| UK nationals | 88% | 86% |
Source: ONS, Annual Population Survey.
Note: 2015/16 is April 15 to March 16, 2019/20 is April 19 to March 20. Occupations are based on 4-digit SOC codes.
Table 1.24: Job skill mix by sector and the proportion filled by migrants in RQF 1-2 jobs, 2019/20
| Proportion of RQF 1-2 occupations in sector | Proportion of migrants in RQF 1-2 occupations in sector | |
|---|---|---|
| Accommodation and Hospitality | 63% | 23% |
| Agriculture | 29% | 7% |
| Manufacture of Foods and Beverages | 57% | 31% |
| Residential and Social Care | 44% | 19% |
| Transport | 73% | 21% |
| Warehousing | 64% | 30% |
| Wholesale and Retail Trade | 57% | 13% |
Source: ONS, Annual Population Survey (APS). April 19 to March 20.
Note: APS does not capture seasonal workers so will only cover permanent employees in Agriculture.
Table 1.24 shows the proportion of migrants in RQF 1-2 jobs in these sectors prior to the pandemic, and highlights some of the sectors that may be particularly affected with the new immigration system. A large share of the RQF 1-2 jobs are held by migrants in the manufacture of foods and beverages (31%) and warehousing industry (30%).
Temporary visas
The Government has recently introduced several temporary visas to provide routes for migrants to fill mainly RQF 1-2 occupations. For example, temporary visa routes were set up for 5,000 Heavy Goods Vehicle (HGV) drivers and 5,500 poultry workers to come to the UK in the period up to Christmas to avoid potential further pressure on the food industry and supply chains. These temporary visa routes for HGV drivers (see box below), butchers and poultry workers have been put in place using the Seasonal Agricultural Workers Scheme (SAWS). This is a pilot scheme which began in 2019.
Historically the MAC has cautioned against sector-specific schemes that all too often benefit sectors that shout the loudest or have the most effective lobbying strategy. At the same time, we recognise that problems in some sectors can have substantial knock-on effects to the wider economy that need to be considered. There is no perfect solution here. On the one hand, offering visas to a wider range of occupations that require shorter training may disincentivise firms’ investment in innovating production and increasing automation. Our previous report (PDF, 2.2 MB) found there is also some evidence that suggests lower-skilled workers face a negative wage impact from migration, though the magnitude of the impact is generally estimated to be small. On the other hand, a rigid rejection of all visa options in occupations that require shorter training periods risks causing permanent damage to sectors that need time to adjust following the pandemic. The MAC is broadly supportive of the approach taken by the Government to resist wide scale changes to the immigration system, though we have some concerns over the design of the temporary routes that we discuss below.
There is a distinction between SAWS and the Skilled Worker (SW) route. The former was designed explicitly for seasonal work in agriculture where the nature of the job tends to make it unattractive to domestic workers, both because it is non-permanent and often located in more remote rural areas. Many countries operate an equivalent of the SAWS scheme. The SAWS does not have an English language requirement, does not in general have minimum salary thresholds and time spent on the route does not count toward settlement. In contrast, the SW route is designed for longer-term work in the UK and is a route to settlement. The SW route imposes an English language requirement and has a set of salary thresholds to prevent undercutting of domestic workers.
The English language requirement is beneficial for society, as it enhances the ability of migrants to integrate successfully when coming to the UK. Importantly it also helps to protect migrants from exploitation as they are more able to voice their concerns and would also find it easier to move to another job if they have good fluency in English. The MAC recommended English language proficiency as an essential requirement for the SW route. This is primarily because this is a route to settlement and English language provides long-term integration benefits. For the SAWS we are more concerned about exploitation, particularly for lower paid workers who are more likely to be exploited. A 2017 report (PDF, 693 KB) from the Gangmasters and Labour Abuse Authority noted that a lack of language skills, amongst other circumstances such as a lack of representation, can lead to labour exploitation. Immigration must not be thought of as something that should only be focused on benefiting firms – the rights of migrants must also be considered.
Whilst these temporary routes may have value in the short-term, they come with a number of issues including uncertainty for employers and should not come to be seen as a long-term solution. We are also not convinced that the approach of using last minute, very short-term fixes should become the norm, since it reduces employers’ ability to plan and is in any case unlikely to generate the flows of migrant workers sought. If the government is willing to offer concessions to specific industries, it would likely make more sense to establish a migration route with clear conditions attached and a transparent method to decide when specific industries or occupations would be eligible to use this. This would surely be preferable to using the SAWS for purposes well outside its design. In terms of the SAWS scheme that began in 2019, the Government is yet to publish the evaluation of the scheme, despite stating in Parliament in October that this would be published shortly. Publishing an evaluation of the pilot scheme is central to completing the pilot to demonstrate its effectiveness and discuss whether changes are needed. We would welcome the findings of their evaluation to help inform our view on the SAWS scheme.
We have a heightened concern about butchers being allowed to use the SAWS route on a temporary basis. This occupation is eligible for the SW route, so migrants could enter the UK to work under this route. Employers may find the SAWS route beneficial over the SW route for a number of reasons. We know from research with employers in other occupations, and using other immigration routes, that the lack of an English language requirement is often viewed favourably, because of the saving in administrative burden and time this confers. If this is the case then as discussed, our view is that the requirement for English language proficiency is a measure to protect migrants, even if it makes some ineligible. There are concerns that migrants could be exploited via this route. It is possible that those entering on the SAWS may learn English in the UK, and then apply for the long-term route to settlement through the SW route. Furthermore, we recognised that butchers were in shortage in our last SOL review, where we recommended that the occupation was added to the SOL. However, the Government decided not to implement this recommendation at the time, and it may be that a more sensible approach to the recent difficulties would have been to implement this recommendation.
Stakeholder evidence in the 2020 SOL review highlighted issues with adverse working conditions and limited training/skills for butchery amongst the domestic workforce. These are longstanding issues which were also raised in the 2008 SOL review, and employers we spoke to in food manufacturing (particularly in shellfish and meat processing) as part of our recent qualitative research with employers (publication of which is forthcoming) again reiterated these concerns, despite efforts made to attract and retain the domestic workforce. For example, we spoke to a representative in the food processing sector who told us that the average British worker recruited stayed in post for 24 days before leaving, compared to the average Lithuanian worker staying 176 days, and the average Polish worker 288 days, before leaving.
It is possible that some employers could do more to attract and retain British workers, particularly among those who have not traditionally worked in the occupation. For example, as part of the qualitative research mentioned above, we spoke to one employer who had redesigned the nature of some of their butchery work to make it more easily done by women and was planning to offer part-time working; in contrast, another processor had recently stopped offering school hours shifts and part-time work despite difficulty recruiting. Employers who are able to offer conditions that suit the greatest number of people are likely to be those who find it easiest to recruit staff.
Box: HGV drivers
In Autumn 2021 the UK experienced a breakdown in many of its supply chains, particularly those involving the transport of food and fuel. Many in the industries affected said that a lack of HGV drivers available to transport goods had caused this and called for government intervention to prevent further damage.
The COVID-19 pandemic led to a steep drop in the number of HGV drivers employed. The number of HGV drivers employed in other countries also decreased, with large shortages widely reported in Europe and the U.S.A. From the year ending June 2019 to the year ending June 2021, estimates suggest that the number of UK national drivers fell by almost 26,000 and the number of drivers from the EU fell by 12,000. We should however be cautious about these estimates given the difficulties in conducting the Labour Force Survey (see section below).
Figure 1.25: Number of HGV drivers employed, 2016 to 2021 (thousands)
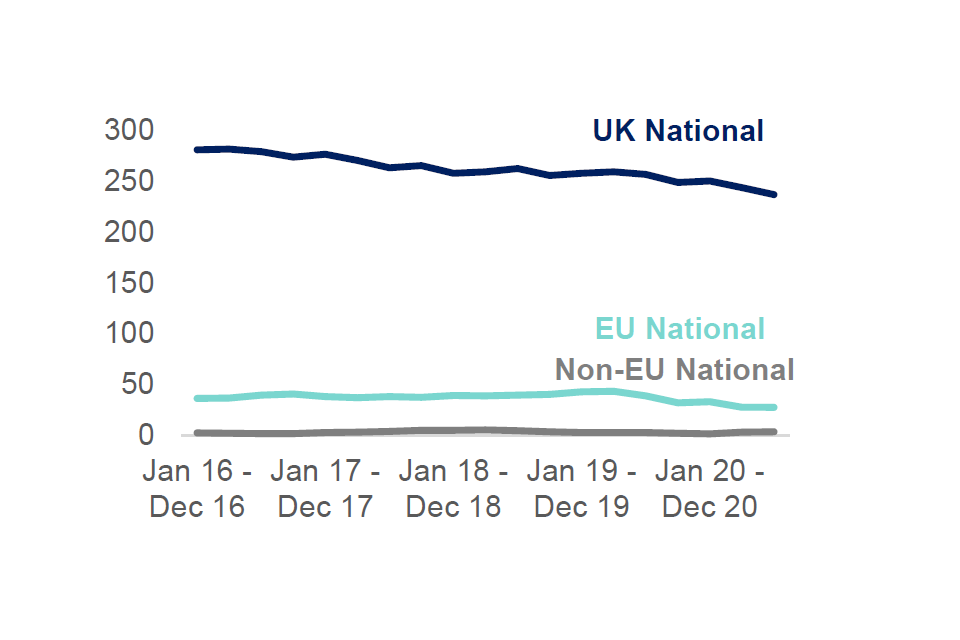
Source: ONS, Annual Population Survey, Jan 16 - Dec 16 to Jul 20 – Jun 21.
Figure 1.26: Number of LGV licence tests conducted, April 2019 – July 2021, monthly
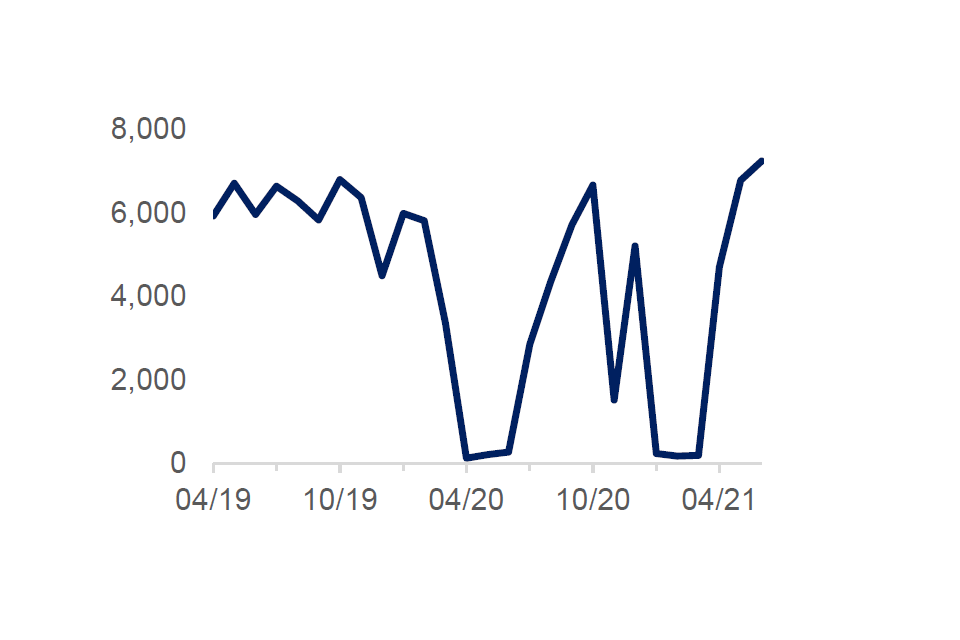
Source: DfT/DVSA, DRT0501: Practical large goods vehicles (LGV) test pass rates by gender, monthly: Great Britain. 2019/20 to 2020/21.
The industry will need to drive up recruitment domestically in order to make a full recovery. One issue that has been raised is the number of tests that have been conducted during the pandemic. During the strictest national restrictions in April 2020 and March 2021, the number of new tests conducted fell dramatically to just 2.3% and 3.4% respectively of the number seen in February 2020. Whilst test numbers have now increased to above the pre-pandemic levels, this rise will need to be sustained to ensure that the shortage does not continue long term with UK drivers who leave the profession not being sufficiently backfilled by new starters seeking to qualify in the UK. The cost of training to become a HGV driver is high, and unless covered by an apprenticeship programme or subsidised by an employer, this cost acts as a barrier to individuals to enter the profession.
The makeup of the HGV industry may also present challenges. According to DfT, the industry is made up of 69,000 operators with an average fleet size of only 5.2 vehicles. The low average number of vehicles is due to the number of small firms greatly outweighing the number of large multinational firms. Smaller firms may struggle to attract new entrants if job security, conditions and benefits are perceived to be better in the large multinationals, and they may be less willing to train new workers given the risk of poaching by other firms.
In response to the shortage, the government introduced two schemes providing routes for HGV drivers to work in the UK. The first was a scheme allowing up to 300 EEA nationals qualified as fuel HGV drivers to be granted an emergency short term visa. The second was the provision for 4,700 emergency visas to be granted to HGV drivers for the delivery of food. Whilst full uptake figures are unavailable at the time of publication, the Minister of State for the Department for Business, Energy and Industrial Strategy said in response to a parliamentary question that nine letters of endorsement had been granted to drivers under the fuel tanker driver scheme as of 2nd November 2021.
There are also long-standing demographic issues with the HGV workforce that show little sign of having been addressed in recent years. Of the current workforce, only 18% of drivers are below 35 years old, and the number of drivers aged below 45 has fallen since 2012. Meanwhile, the share of drivers aged 55 and above has increased slightly, showing that the workforce is ageing. In comparison, of all those employed in the UK, 31% are aged below 35.
Figure 1.27 – Share of the total HGV driver workforce, by age group
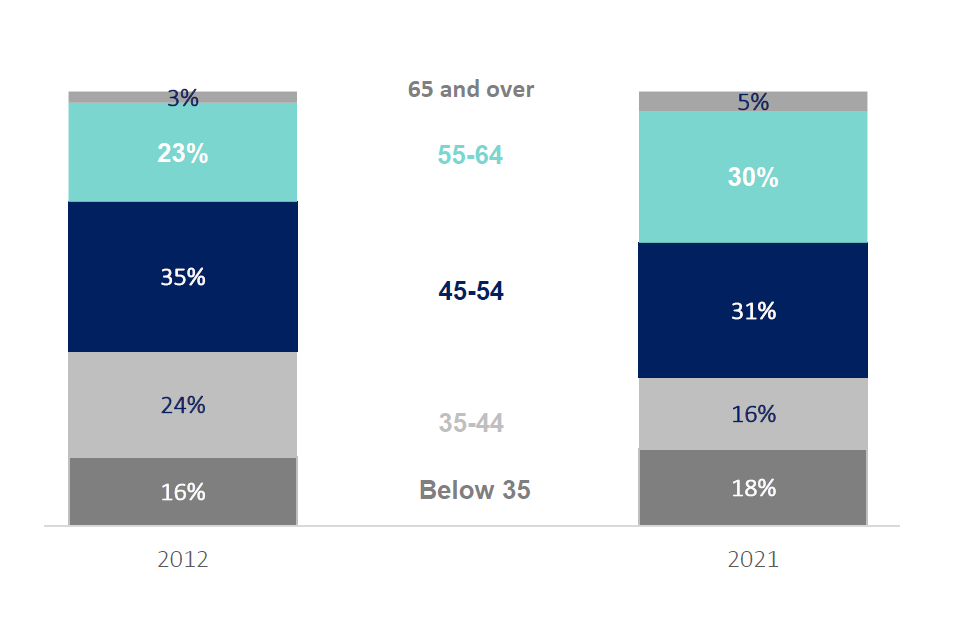
Source: ONS, Annual Population Survey, April 11 Mar 12 – April 20 Mar 21.
Annual Population Survey data estimates that women account for around 1% of the HGV driver workforce, with no significant change over time. The proportion of those from ethnic minority backgrounds represented in the workforce is also historically low. Only about 6% of HGV drivers are ethnically non-white, again with very little change over time. Compared to the whole UK workforce, where 48% of those employed are women and 13% are non-white, representation is very low.
The relatively low proportion of women and young people in the industry suggests that either access is difficult or that public perception of the job is negative amongst the under-represented demographics. Wages and working hours have an impact on the attractiveness of a job. The median number of hours worked in a week by HGV drivers was 48 in 2021, according to the Office for National Statistics (ONS) Labour Market Statistics. In comparison, the median for full time workers across the whole workforce in the UK was 36 hours . The estimated median wage for HGV drivers was £25,500 in 2012, rising to £30,600 in 2021 – an increase of 20%, according to Annual Survey of Hours and Earnings (ASHE) data. Over the same period, the adult National Minimum Wage (NMW) has increased by 44% from £6.19 per hour in October 2012 to the National Living Wage (NLW) of £8.91 in April 2021.
Both national and trade press have also reported that working conditions and facilities for drivers are poor, with a lack of suitable parking spaces with toilet or shower facilities being said to be a major issue. Some have said that working conditions are better abroad, which if correct, could make it difficult to recruit foreign workers to the industry. The government recently increased the number of hours that a driver can work before requiring a rest period, which may have worsened the perception of working conditions for drivers.
It therefore appears that a steep change needs to be made to increase the attractiveness of the job that would help to ensure that the industry maintains stability in the long term and attracts new types of workers. Such a change is likely to require co-ordinated action between industry, government and transport bodies.
Summary
Most HGV drivers are UK nationals who are over 45, male and white. They work much longer hours than the average worker and part-time work is almost non-existent. The shortage of HGV drivers is not a problem entirely to do with Brexit, with a large fall in the number of UK nationals employed in the industry when COVID-19 reached the UK. The failure to retain domestic workers accounts for much of the shortage seen in the post-pandemic recovery. There are wider issues in the occupation and its attractiveness, with young people not entering the profession, resulting in an ageing workforce and a poor record in attracting women to the industry. This combined with the difficulties in completing tests during the pandemic has exacerbated the issues faced by the industry.
EU emigration
One of the most widely publicised questions about the impacts of the pandemic on migration was whether it led to an exodus of European Union (EU) citizens. This could be a result of job loss or wanting to be near family members during the crisis. Understanding how the EU migrant population changed during the pandemic is important for understanding their role in the post-Brexit labour market. In particular it was always assumed that the ending of freedom of movement would not cause any significant change in the stock of EEA workers in the UK but would rather change the flow as EEA workers would no longer be able to work in RQF 1-2 occupations, and would need a work visa for other jobs. If coincidentally the pandemic caused a marked reduction in the population of EEA workers already in the UK, this would cause significant problems for sectors that had a large share of EEA workers prior to the ending of freedom of movement, particularly if they were in RQF 1-2 occupations that could not be easily replaced going forward. Unfortunately, there have been several methodological issues with the main data sources because of the pandemic which have resulted in a large amount of uncertainty around such estimates. This section will discuss these issues and try to provide a sense of what the data seem to be telling us.
Before the COVID-19 pandemic, the International Passenger Survey (IPS) was the main source for statistics on the levels of migration into and out of the UK. This survey was not providing sufficiently accurate data to meet the demands of the policy debate and was due to be replaced with a new approach using administrative data to estimate the migrant population, inflows and outflows. Due to the pandemic, the migration component of the survey was retired earlier than originally anticipated, in March 2020. While the IPS resumed in January 2021, it no longer contains a migrant boost sample, which means that its value for measuring migration flows in future will be limited.
In the absence of the IPS or the new ONS admin-based migration estimates, the main source of data that has remained available to examine EU migration has been the Labour Force Survey (LFS). The LFS provides population estimates to measure changes in the stock of migrants in the UK. It does not measure immigration or emigration flows and provides only an indirect measure of net migration.
Initial outputs from the LFS indicated that around a million people had left the UK in 2020. However, subsequent investigation concluded that this was largely the result of measurement problems and did not reflect real changes in migration patterns. In particular, the LFS interviewers stopped visiting respondents’ addresses to make contact and conduct interviews. Instead, they contacted them by letter, following up by telephone where they were able to obtain a phone number. This new approach led to lower response rates to the survey across the board. It is now widely understood that this change in method had a disproportionate impact on the foreign born, leading to an underestimate of their numbers. This underestimate of migrants, coupled with the fact that the estimated UK population had not been adjusted, also led to an implausible increase in the estimated number of UK born people living in the UK.
In response to these problems, the ONS issued a revised and reweighted dataset in September 2021. The reweighting attempts to adjust for migrants’ increased non-response, using data from administrative sources (notably HMRC PAYE data) that are thought to be less affected by the pandemic. Administrative data suggested that the decline in the employed migrant population had been smaller than the LFS suggested. It must be recognised however there is still a lot of uncertainty about the estimates.
After the reweighting, the estimated EU migrant population is much more stable. Instead of a decline in the hundreds of thousands, the reweighted figures suggest that the EU-born population was broadly stable, declining by only 47,000 between the last quarter of 2019 and the same period in 2020. However, when the reweighted LFS figures are used to examine subgroups of the migrant population and their change over time, there are some unexpected and, in some cases, implausible increases in certain migrant groups. For example, the reweighted data show a 247,000 increase in the number of EU-14 born migrants, alongside a 133,000 decrease in the number of EU-8 migrants. The increase in EU-14 is not explained by actual immigration flows, however. It is primarily driven by a higher estimate of migrants who arrived before the pandemic. In other words, it may simply reflect continued problems with non-response in the survey. For example, it seems likely based on these figures that non-response increased more among EU-8 born than EU-14 born, resulting in an overestimate of the EU-14 born numbers when EU migrant respondents were reweighted to match totals from other datasets. ONS has recognised the uncertainty in LFS-based estimates for migrant subgroups and have recommended that data below the EU and non-EU level should not be compared with previous years. It does however make us considerably cautious in placing faith in any of the published data on levels and changes in the EU-born population.
Figure 1.28: Number of EU migrants estimated to be living in the UK by place of birth, 2004 – 2021, (millions)
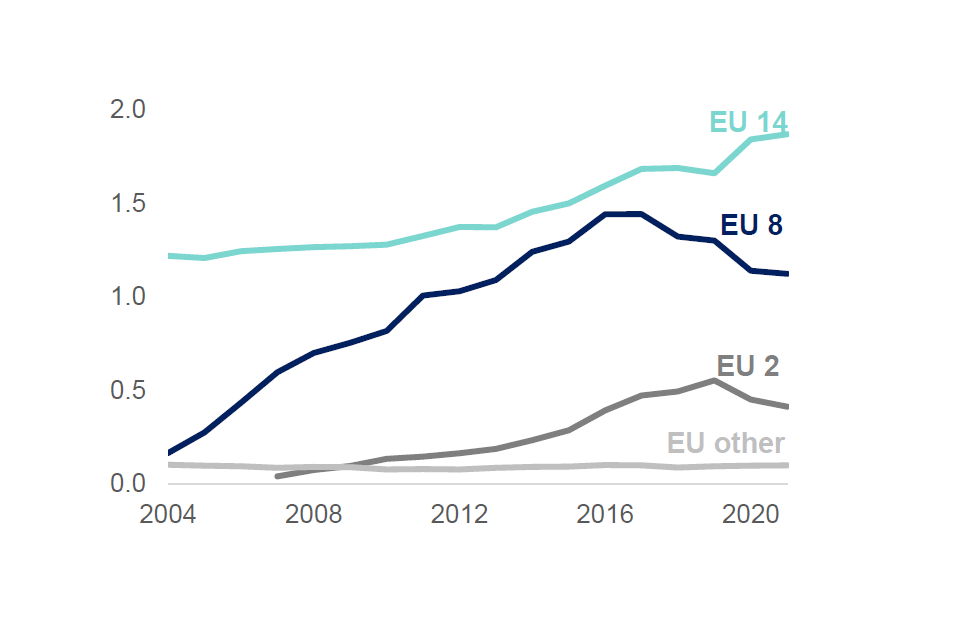
Source: ONS, population by country of birth and nationality.
Note: 2021 point is for July 2020 – June 2021, all others are calendar year. These estimates are based on Annual Population Survey (APS) data.
Figure 1.29: Estimated change in the level of EU employment since Jan – March 2020, by different sources (thousands)
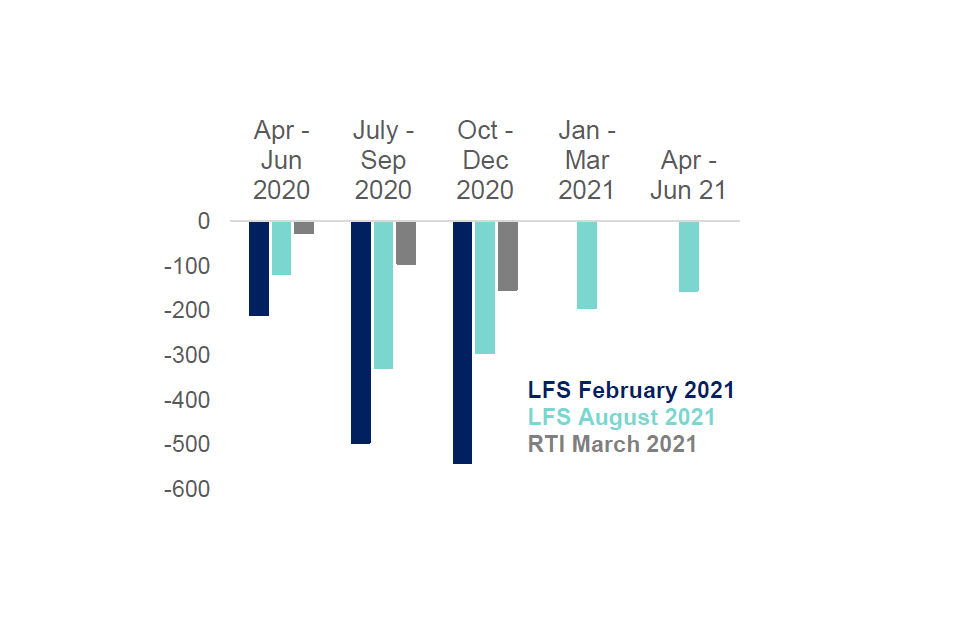
Source: LFS February 2021, LFS August 2021 and Real Time information (RTI).
Note: LFS data is by country of birth, RTI data is by nationality.
Figure 1.29 shows the disparity in estimates when looking at changes in EU employment across the different sources. Original estimates from the LFS suggested EU employment had fallen by 500,000 by the end of 2020, whereas more recent estimates suggest it was never more than 300,000 (and has already recovered to a drop of around 150,000). Data from HMRC PAYE Real Time Information (RTI) which measures the number of pay-rolled employees never estimated the drop to be more than 150,000. It should be noted that the RTI does not include the self-employed, so these data are not directly comparable. It does however strongly point to a significant over-estimate of the decline in EU workers using the survey-based measures.
The overall picture is that the number of EU migrants who left the UK during the pandemic is simply not known. While it seems very likely that the number is lower than the initial estimates that suggested net emigration of approximately 890,000 for all non-UK born, it is also quite possible that the reweighted LFS figures are not accurate. Data from HMRC RTI does suggest significantly smaller falls in the number of EU nationals in pay-rolled employment, although the latter could be affected by more people working abroad temporarily while remaining on UK payrolls during the pandemic. More insight should be possible with the recently published admin-based migration estimates for 2020. The 2021 Census data will also help to address the methodological issues as it will be possible to reweight the LFS data based on the results of the 2021 Census (with the caveat that Scotland has delayed its Census to 2022).
The uncertainty in the current LFS data will have implications for the MAC’s work in the coming year. There have always been problems with migrant non-response in the LFS data; for example, the survey fails to capture newly arrived migrants (Sumption, 2020). However, the increased uncertainty over changes during 2020 and 2021 will create additional challenges in understanding the role of migration in the post-Brexit and post-pandemic labour market.
2: Asylum and integration
The tragic losses of life in the English Channel in recent weeks and months, as people have taken enormous risks to seek a new life in the UK, have highlighted the complex issues around asylum. At the same time, the Nationality and Borders Bill proposes substantial changes to the asylum rules. In this Chapter, we give a broad overview of the asylum context in the UK and discuss policies that can help to improve the integration and long-term outcomes of asylum seekers, particularly in relation to the labour market. The MAC does not intend to comment on broader questions of asylum policy, as the legal and operational aspects of the asylum system are outside of our remit.
Asylum applications and grants in the UK
There are multiple factors contributing to asylum application levels in the UK, such as the UK’s geographical location (being an island in North-Western Europe, and hence unlikely to be the first safe country asylum seekers enter), the prevalence of civil wars and other dislocations in source countries, and more recent events such as the COVID-19 pandemic where global travel plummeted, and borders closed. Figure 2.1 shows the total number of asylum applications received in the UK from 2001 to 2020. Levels in 2020 were 17% lower than 2019: some of this may be a result of the COVID-19 pandemic and travel restrictions. Current levels are broadly in line with those observed over the last decade, and notably lower than the levels at the beginning of the Millennium. Data for the whole of 2021 are not yet available although there was a significant uptick in asylum applications in the summer of 2021.
Figure 2.1: Total number of asylum applications
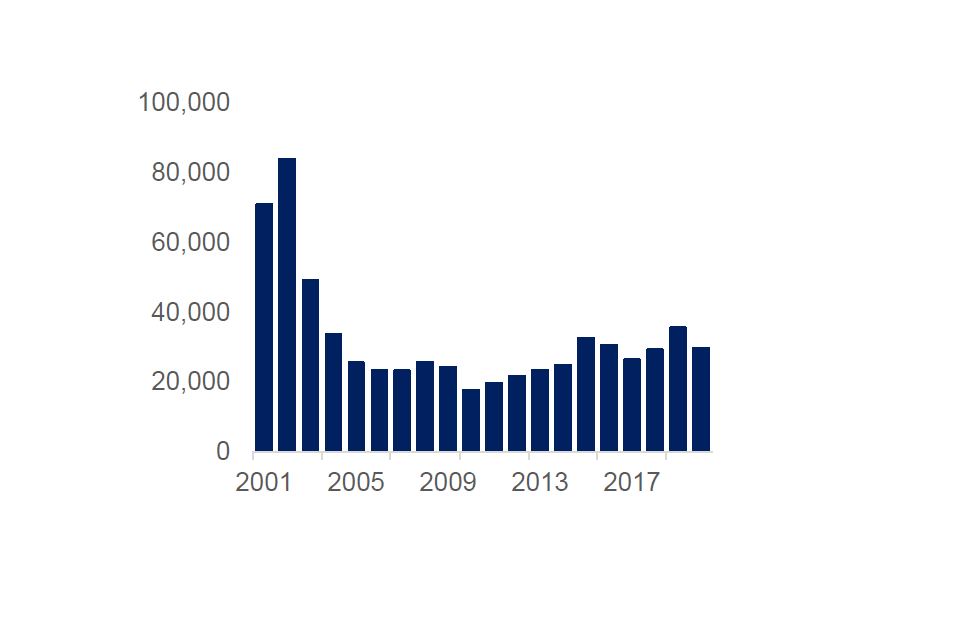
Source: Home Office Immigration statistics
Figure 2.2: Estimated asylum grants per 1,000 population 2020
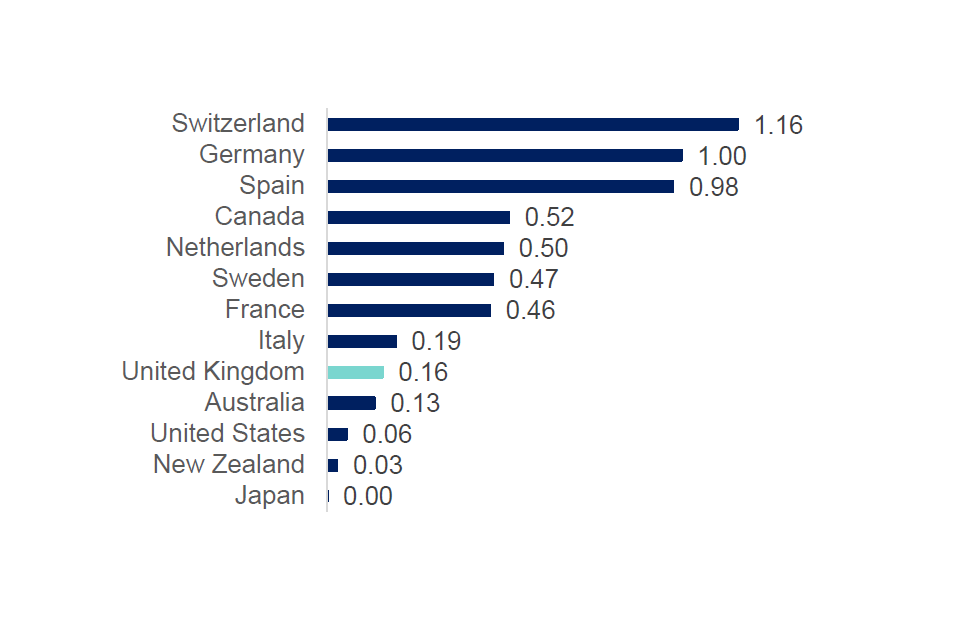
Source: UNHCR 2020 Asylum Decisions, Worldbank.
The UK is below the EU average in terms of grants per 1,000 population. This difference is largely a result of a lower number of applications in the UK, rather than a stricter grant rate compared to other countries. Figure 2.2 shows a comparison of asylum grants per 1,000 population between the UK and selected countries for 2020. The UK had a rate of 0.16 per 1,000 population, which was much lower than many other countries in Europe, such as Sweden (0.47) and Germany (1.0), but above that of the United States (0.06). It is important to remember that the countries that tend to host the largest numbers of refugees are those closest to the source countries, irrespective of their ability to manage such flows.
In common with other countries in Europe, small boat arrivals have become increasingly used to reach the UK in recent years, and since 2018 a growing number of migrants have been arriving across the English Channel by this means. There are no regular published statistics on the numbers of migrants detected to arrive in the UK by boat. However, provisional figures are released occasionally in press reports, and in 2020 an estimated 8,500 people arrived via small boats (PDF, 837 KB), and this had increased to an estimated 23,000 in 2021 by 11 November (1,185 on that day alone, with an additional 15,000 having been prevented from crossing by French authorities by the end of October). Previous evidence has indicated that the vast majority of those crossing the Channel have claimed asylum in the UK.
The UK also offers support to refugees through resettlement schemes. These are different to the asylum route (where the individual applies for asylum after arrival in the UK, and their application is then considered), as under resettlement the individual is recognised as a refugee before arrival in the UK. Previous resettlement schemes have included the Syrian Vulnerable Persons Resettlement Scheme (VPRS) and currently the UK Resettlement Scheme (UKRS) and Afghan Relocations and Assistance Policy (ARAP). The Government has said that the forthcoming Afghan Citizens Resettlement Scheme (ACRS) would see around 5,000 people arriving in the first year and up to 20,000 over coming years. This chapter largely focuses on asylum seekers, rather than refugees that have arrived via resettlement schemes, given that the latter are permitted to access the labour market.
The foundations of integration
The MAC is primarily interested in how well asylum seekers are integrated into the UK, both in the labour market and in terms of social integration and the policies that can help to support their integration.
The Home Office report Indicators of Integration (Ager and Strang, 2004) (PDF, 146 KB) conceptualised the process of refugee integration as a series of “domains” including markers and means (employment, housing, education, and health) and social connections (bonds with those of the same national/cultural background, bridges with those of different backgrounds and links with civil societal institutions). Underpinning all of these was the foundation of rights and citizenship, followed by safety/stability, and language/cultural knowledge (the framework was further updated in 2019 to include digital skills and communication as additional facilitators). This conceptualisation underlines the importance of the decision on refugee status, and the acquisition of English language, in acquiring employment.
Figure 2.3: Home Office Indicators of Integration framework
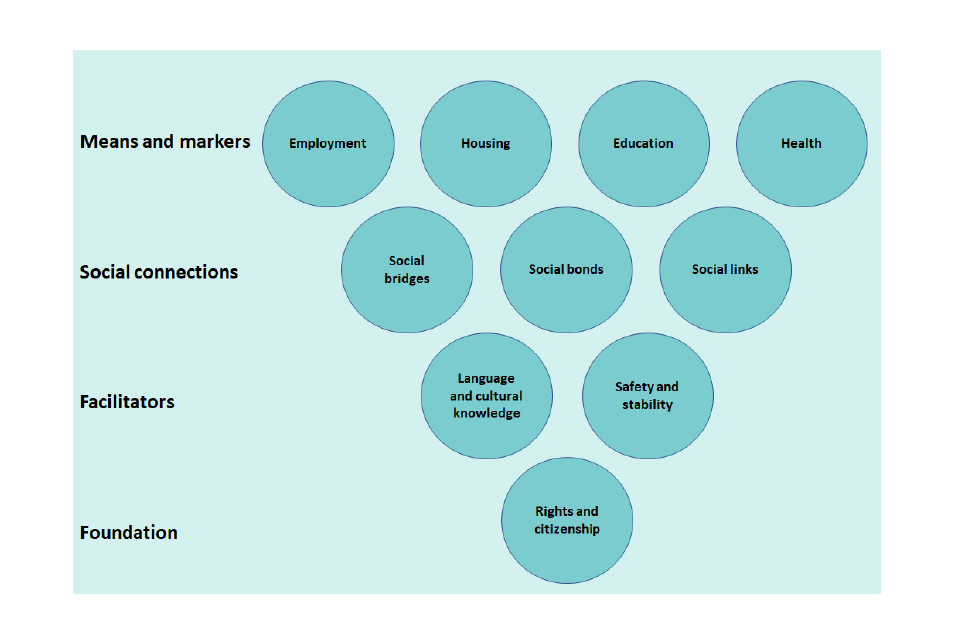
Source: Indicators of Integration, Ager and Strang (2004).
Over time the source countries for asylum seekers have changed, as they are driven by the location of global crises and conflicts. Table 2.4 shows the top five source countries for granted asylum applications in the UK at five-year intervals. As the composition changes, the needs of the refugee populations also fluctuate according to the most prevalent source countries and the specific circumstances precipitating departure. For example, the estimated adult literacy rate in Afghanistan is 43% (30% for women) compared to 86% in Iran and Iraq. Family sizes, ability to speak English, psychological and physical health and trauma, age and cultural gender norms, all of which also have an impact on ability to engage with work-readiness related activities such as English for Speakers of Other Languages (ESOL) and job search, also vary by nationality. This is similarly true for resettlement schemes, where needs may also vary according to intake. For example, intakes of Iraqi and Afghan refugees in the past have included those who have acted as interpreters for British forces overseas.
Table 2.4: Top five source countries for UK asylum grants, and levels
| 2006 | 2011 | 2016 | 2020 |
|---|---|---|---|
| Somalia (1,400) | Iran (1,654) | Eritrea (2,444) | Iran (1,538) |
| Eritrea (1,276) | Sri Lanka (860) | Iran (2,247) | Eritrea (862) |
| Afghanistan (972) | Eritrea (779) | Syrian Arab Rep. (1,812) | Sudan (839) |
| Zimbabwe (972) | Pakistan (656) | Sudan (1,405) | Iraq (812) |
| Iran (763) | Afghanistan (649) | Afghanistan (1,220) | Afghanistan (668) |
Source: UNHCR asylum decisions.
Figure 2.5: Asylum applications awaiting an initial decision by length of waiting time
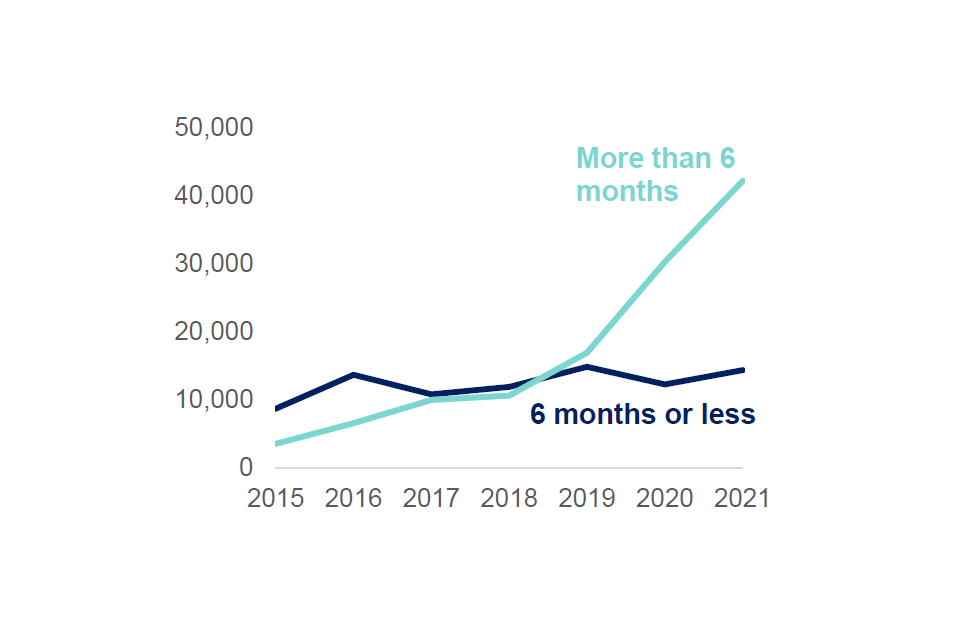
Source: Home Office Immigration statistics Asylum applications awaiting a decisions (Asy_D03), all points are 30 June of the year.
Grant rate at initial decision also varies widely by nationality: published migration statistics indicate that Libyans (93%) and Eritreans (74%) typically have high grant rates at initial decision, while nationals of India (4%) and Bangladesh (17%) have low grant rates. This is relevant as people can only seek work once their claim has been granted.
Figure 2.5 shows the number of applications awaiting an initial decision by the length of waiting time. As of the end of June 2021, there were around 56,600 asylum applications pending an initial decision. Of these, 75% of applications had been waiting for their decision for longer than six months. This share is much higher now than it was five years ago, when only 33% had to wait more than six months for an initial decision. These lengthy delays directly harm the integration of asylum seekers and interact with rules that restrict access to work and English language opportunities that we highlight below.
(i) Labour Market Access
Asylum applicants in the UK are generally not permitted to work whilst their application is pending a decision. If applicants have not received a decision within 12 months, they may apply for permission to work, however if this is granted, they are only able to work in occupations listed on the SOL.
As asylum seekers cannot work whilst awaiting a decision, they may become disengaged with the labour market, therefore making it harder for them to integrate if they are ultimately granted asylum in the UK (as almost half – 48% - were at initial decision in year ending March 2021; this typically increases by 10 to 20 percentage points once appeals are taken into consideration). Ruiz and Vargas-Silva (2021) (PDF, 475KB) explore the existing literature on this and found that the evidence generally supported the idea that shorter waiting times had a large positive impact on long-term employment outcomes for asylum seekers. Similarly, a German study found that employment rates were around 20 percentage points lower for those who had had to wait an additional seven months to access the labour market and that, moreover, this employment gap persisted for around 10 years. Refugee Action (PDF, 3.3 MB) have carried out research which echoed this, describing the anxiety and stress experienced by those awaiting a decision, and commenting that both the impact on wellbeing and the periods of destitution experienced while unable to work or study would be likely to hinder long-term integration. Indeed, the study by Ruiz and Vargas-Silva cited above found that differences in health (particularly mental health) between refugees and other migrants were one of the factors that could explain lower employment outcomes for refugees compared to other groups.
The Home Office has tended to argue for an employment ban for asylum seekers due to the so-called ‘pull factor’. The argument is that asylum seekers may choose to come to the UK over other safe countries because of the attractiveness of the labour market. One review of international evidence (PDF, 791KB) around the ‘pull factor’ found no correlation between access to the labour market and choice of country for asylum. By contrast, other pull factors such as family/friends in the destination country or language spoken amongst others tended to be more important. The Home Office recently made a parliamentary statement regarding analysis of the employment ban, but this contained no evidence on the ‘pull-factor’ but rather focused on fiscal issues which are not the focus of our concern. To the extent that the Home Office has robust evidence to support a link between the employment ban and a pull factor, they should of course make this evidence publicly available for scrutiny and review. That is how good policy is made.
Currently the policy in the UK is more restrictive than in many other countries: EU law specifies that asylum seekers must be allowed access to the labour market after a maximum of nine months; many countries do so after a shorter period, such as Sweden (immediate), Portugal (one month), Germany (from three months), Belgium (four months), and the Netherlands (once residence permit is granted). In Canada and Australia asylum seekers can work immediately, and in the United States they can do so after six months (PDF, 340 KB).
As waiting times for asylum applicants have increased, the work restriction has the potential to become more detrimental to the long-run success in the UK of those ultimately granted asylum. The MAC would recommend the Government review their policy on allowing asylum seekers to work. One option might be to allow applicants to work if an initial decision has not been made within six months. We also question the value of the current restriction that allows work after 12 months only on SOL occupations – this was never the purpose of the SOL, and the original reasoning behind this restriction does not seem to be particularly coherent.
(ii) English Language Skills
As highlighted in a 2017 House of Commons research briefing (PDF, 203 KB) on ESOL provision for refugees, refugees are eligible for ESOL funding via the Adult Education Budget, which asylum seekers can also access after six months waiting for their decision. Resettled refugees (i.e. those who have been granted asylum overseas before entering the UK on a resettlement programme) are eligible for funding over and above this: an additional £850 funding per learner; with a minimum of eight hours’ tuition per week, with additional funding for childcare to enable adults to attend ESOL classes. There are no minimum tuition levels for those on the asylum route. ESOL funding is provided to ESOL Entry 3 (B1 Common European Framework of Reference – CEFR) level in England. In Scotland, refugees and asylum seekers who are waiting for a decision can also access free ESOL, without the waiting period of six months that applies in England, and those who have been granted an alternative form of status such as humanitarian protection, can access free ESOL courses. Wales also does not differentiate between learners on the basis of status and allows asylum seekers as well as refugees to access ESOL. In Northern Ireland, ESOL is also free for refugees.
However, a 2016 report by Refugee Action, Let Refugees Learn (PDF, 2.6 MB) highlighted that despite this, and their desire to learn, refugees face significant barriers in actually accessing ESOL, such as long waiting lists (leading to either not being able to access support at all or being placed in a class at the wrong level), distance to colleges and travel costs, childcare difficulties and barriers relating to gender norms. The APPG on refugees has also raised these concerns. Bloch (2007) also suggests work to overcome individual employability barriers alongside these other factors. We would recommend that the Government review both ESOL provision and accessibility including for asylum seekers, potentially alongside other provision such as digital skills, and considers making free ESOL provision accessible to asylum seekers immediately (rather than after six months) in England, as in Scotland and Wales.
3: Immigration and social care
In July 2021 the Migration Advisory Committee (MAC) was commissioned to undertake an independent review on the impact of the ending of freedom of movement on the adult social care sector. Whilst the MAC has been asked to report in April 2022, based on early analysis we have already identified several key trends and problems within the workforce that the committee think need to be addressed urgently.
Based on the evidence we have collected so far this update outlines these worsening trends and provides an interim policy recommendation for care workers to potentially alleviate some of these problems. Our extensive evidence collection process is ongoing, and this update does not pre-empt any recommendations in our final report. Instead, it seeks to address some of the immediate problems faced by the sector.
The MAC continues to engage with stakeholders and gather more evidence, including through analysis of the recently closed Call for Evidence and other sources for our full report in April. That report will be based on a full analysis of all the available evidence. It will consider in more detail the appropriate immigration routes for adult social care workers.
Key trends and problems in adult social care
The share of non-UK born workers in the adult social care sector is greater than in the wider economy, although the share of European Economic Area (EEA) born workers is slightly lower. As the largest occupation in the sector, care workers account for over three quarters of the adult social care workforce involved in direct care provision. The share of non-UK born care workers has increased over time accounting for 19% of the occupation in the UK in 2012, and 24% in 2020. As Figure 3.1 and 3.2 indicate, non-EEA care workers account for a greater share of the occupation compared to those from the EEA. The share of non-EEA care workers in the UK has increased from 14% in 2012 to 18% in 2020. The share of EEA care workers is still important, growing from 5% of the workforce to 6% over the same period.
With over 50% of EEA care workers stating that they came to the UK for employment, the ending of free movement and the absence of a work route for care workers is likely to contribute to the recruitment problems faced by the sector. However, many of the workforce problems faced by the sector predate the end of free movement and, as highlighted, the sector is more reliant on non-EEA born workers.
These problems in adult social care vary across the devolved nations and regions. This is highlighted by Figure 3.1 and 3.2, which shows that certain regions are more reliant on non-UK born care workers. For example, in London non-EEA care workers account for 55% of the workforce, compared to only 8% in Wales. The absence of a work immigration route for care workers is likely to partly explain why Skills for Care estimate vacancy rates are higher in regions with higher shares of non-UK born care workers.
Figure 3.1: The share of non-EEA born care workers by region, 2020 and Figure 3.2: The share of EEA born care workers by region, 2020
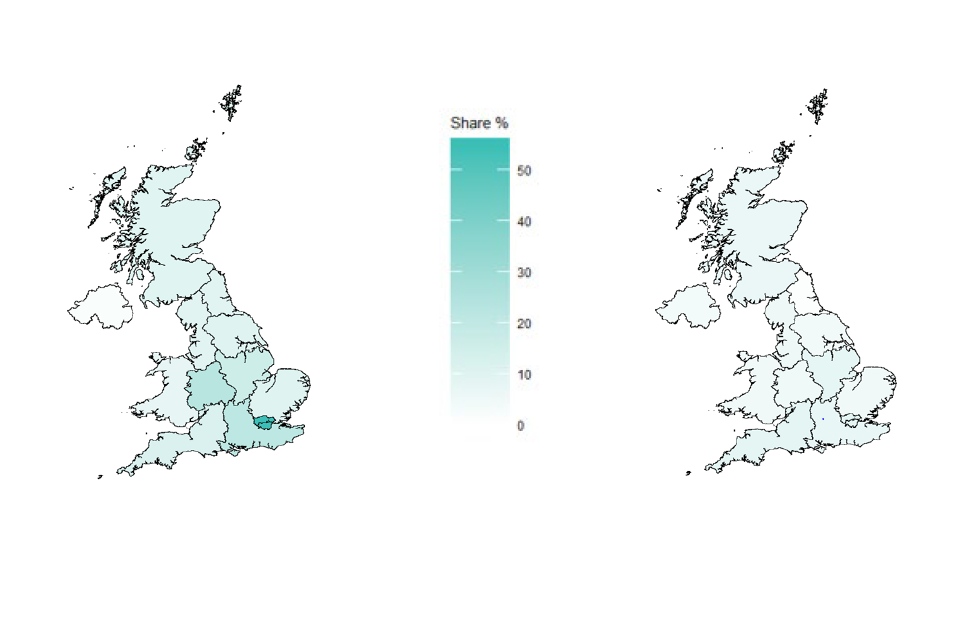
Source: APS, 2020. By country of origin.
As stakeholders and our own evidence has highlighted, recruitment and retention of workers has become increasingly difficult for the sector. The demand for adult social care has increased due to the UK’s ageing population and an increased prevalence of disability among working-age adults. Figure 3.3 shows that in England in 2019/20 there were 1.9 million requests for access to adult social care services received by local authorities from new clients, around 120,000 more than in 2015/16. As the UK population continues to age, the demand for adult social care is likely to increase.
Figure 3.3: New client requests to access adult social care services in England, 2015/16-2019/20
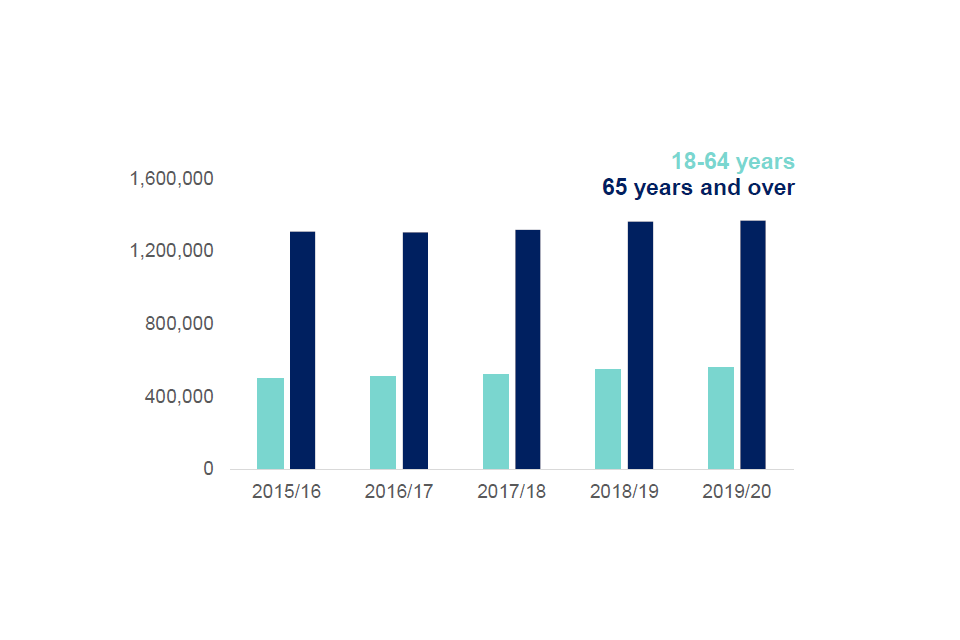
Source: NHS Digital, 2015-2020.
Notes: Time series starts at 2015 because of change in methodology for new client requests to access figures.
The supply of workers has not been able to meet this increase in demand for adult social care services. This is highlighted by Figure 3.4, which shows the increasing vacancy rate for care workers, senior care workers and nurses over the last decade in England, with a similar picture in the other devolved nations. As the economy begins to recover, the vacancy rates in England have begun to rise again. Skills for Care have estimated a care worker vacancy rate of 11.2% in October 2021. The sector also experiences high levels of turnover, as highlighted by Figure 3.5, intensifying the labour supply problems of the sector. The gap between the supply and demand for care workers may well worsen in the short-term as a result of burnout from the increased workloads that occurred during the pandemic and the vaccine mandate, both of which may lead to further difficulties in retention. The sector’s labour shortages have serious consequences for potential care recipients with the number of people receiving long-term care falling since 2015/16, despite the increase in the number of requests for adult social care services. If these trends continue, more people will likely miss out on vital care.
Figure 3.4: Vacancy rates for selected social care occupations, 2013 – 2021
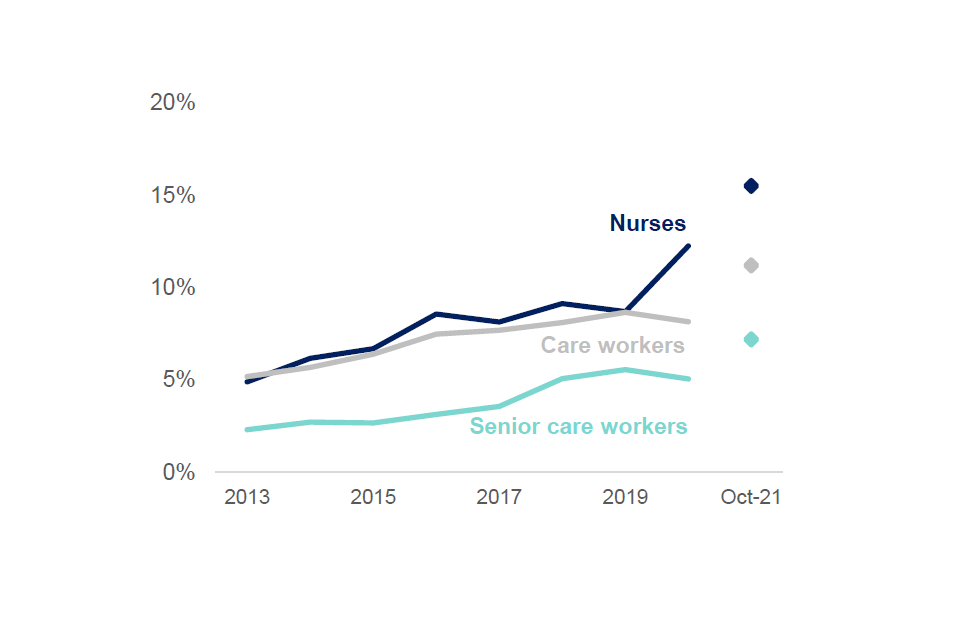
Source: SfC, 2021.
Notes: Rates are for local authority sector and independent sector only. The monthly data is currently unweighted and may only reflect the characteristics of those who updated the SfC database.
Figure 3.5: Turnover rates for selected social care occupations, 2013 – 2021
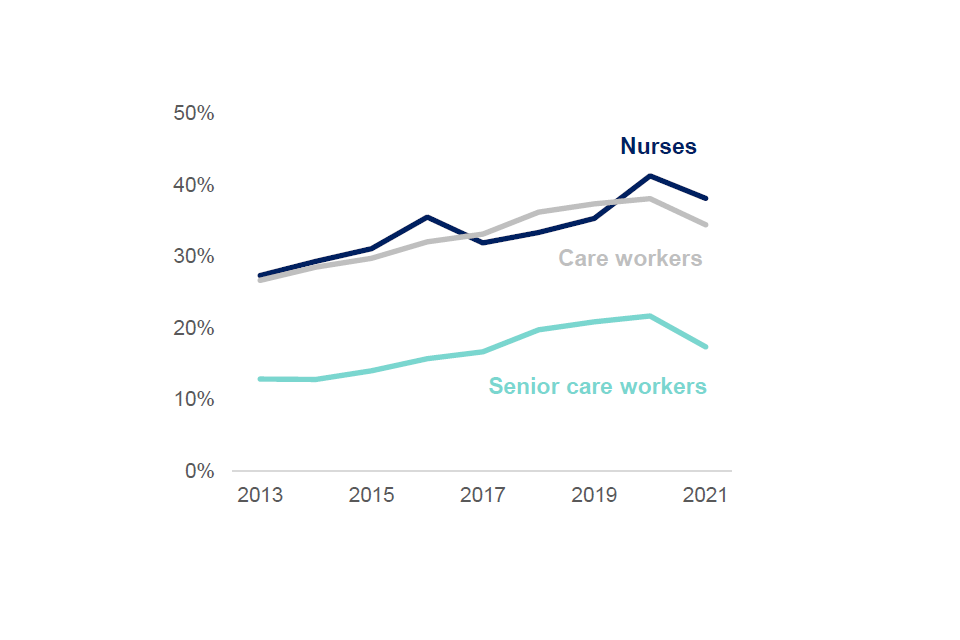
Source: SfC, 2021.
Notes: Rates are for local authority sector and independent sector only. SfC do not provide monthly tracking for turnover.
An examination of the data and our stakeholder engagement suggest that these recruitment and retention problems are mainly due to pay, poor terms and conditions, and lack of progression in the sector. Figure 3.6 shows how the pay differentials between care workers and other low-paid occupations (as defined by the Low Pay Commission) have narrowed. Since 2011 nominal median care worker pay has risen by 27% whilst sales and retail assistants’ median pay has increased by 41%. Care worker pay has converged with the National Living Wage (NLW), which has in turn driven up pay in other sectors. As care worker pay becomes less competitive relative to other competing occupations, recruitment and retention problems are likely to be exacerbated.
Figure 3.6: Nominal care worker pay compared to competing occupations, 2011 – 2021
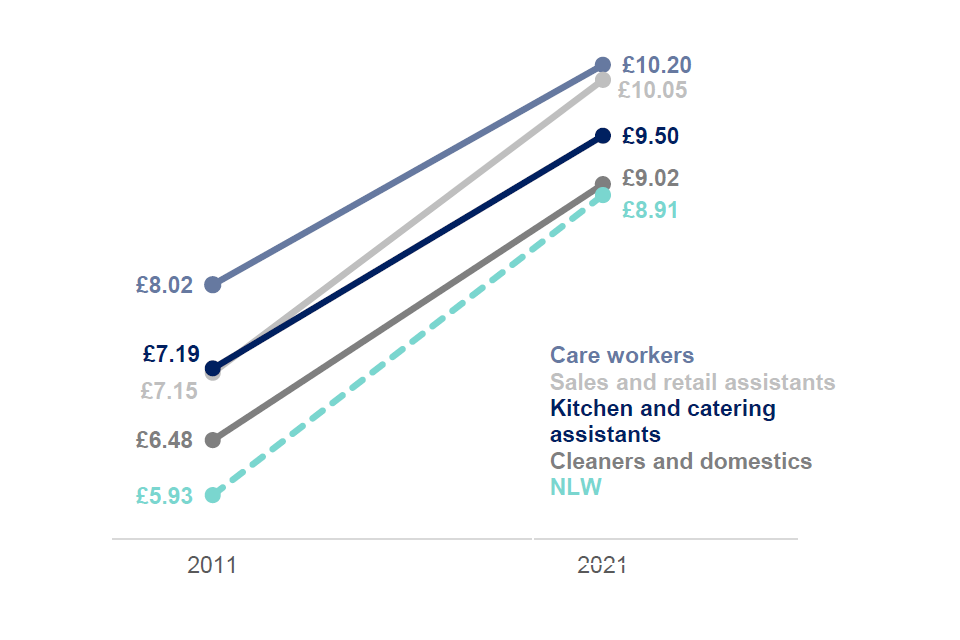
Source: ASHE, 2011-2021.
Notes: This is nominal median pay for full time employees who have been in their role for a year or longer. National living wage (NLW) was introduced during 2016 replacing the national minimum wage (NMW) for over 25’s.
Source: ASHE, 2021.
Notes: The competing occupations observations have been reweighted to account for differences in age and gender. Competing occupations are those that made up greater than 1% of entrants into the care worker occupation or exits from the care worker occupation between 2016 and 2020.
There is also little evidence of pay progression over time for care workers as shown in Figure 3.7. On average, those working between 5-10 years as a care worker can expect a 25p increase in their hourly wage from when they started compared to 95p for those in competing occupations over the same period.
Figure 3.7: Indexed returns to experience for care workers and competing occupations
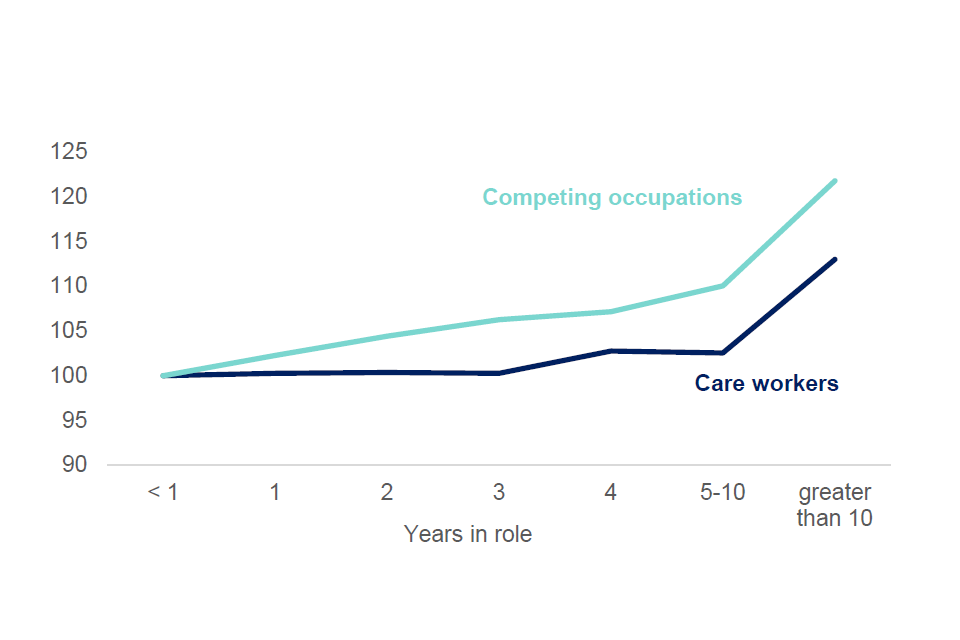
Source: ASHE, 2021.
Notes: The competing occupations observations have been reweighted to account for differences in age and gender. Competing occupations are those that made up greater than 1% of entrants into the care worker occupation or exits from the care worker occupation between 2016 and 2020.
In addition, care worker terms and conditions are often less attractive than competing occupations. Figure 3.8 highlights that care workers are more likely to work on-call and evening or night shifts compared to competing occupations. They are also more likely to have zero-hours contracts, alongside kitchen and catering assistants. These relatively unattractive terms and conditions are also likely to contribute to the recruitment and retention problems.
Figure 3.8: Selected terms and conditions of care work and competing occupations, 2020
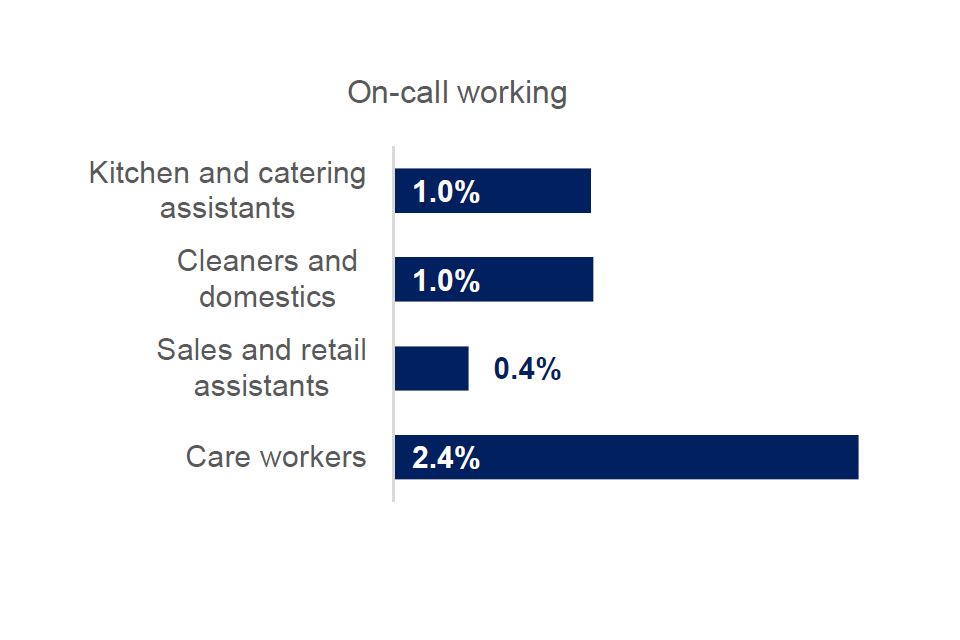
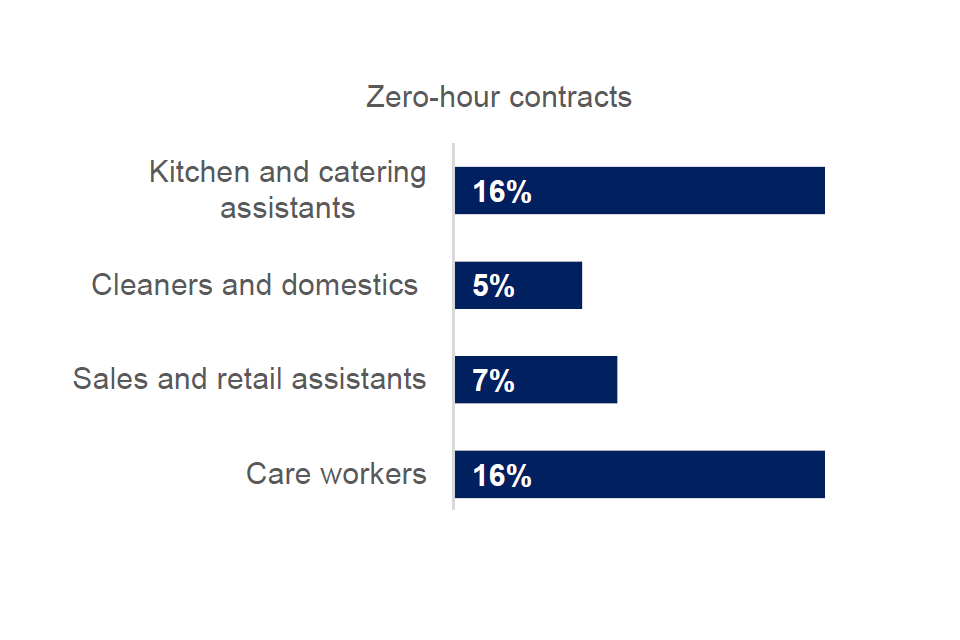
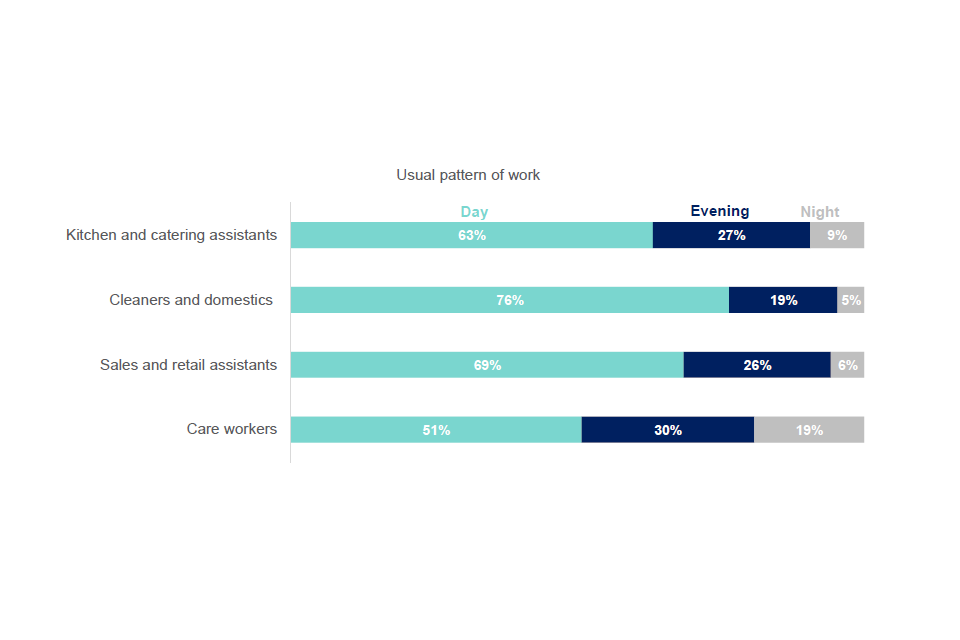
Source: APS, 2020.
As the MAC has highlighted in previous reports, the underlying cause of these workforce difficulties is due to the underfunding of the adult social care sector. In England, whilst funding has increased in recent years, in 2019/20 per adult person gross current expenditure on adult social care by local authorities in real terms remained below 2010/11 levels as highlighted by Figure 3.9. This is despite the increasing costs of care provision. Real terms per person funding was fairly constant in Scotland and Wales and rose in Northern Ireland over the same period.
Figure 3.9: Real terms per adult person gross current expenditure on adult social care by local authorities in England, 2010/11-2019/20
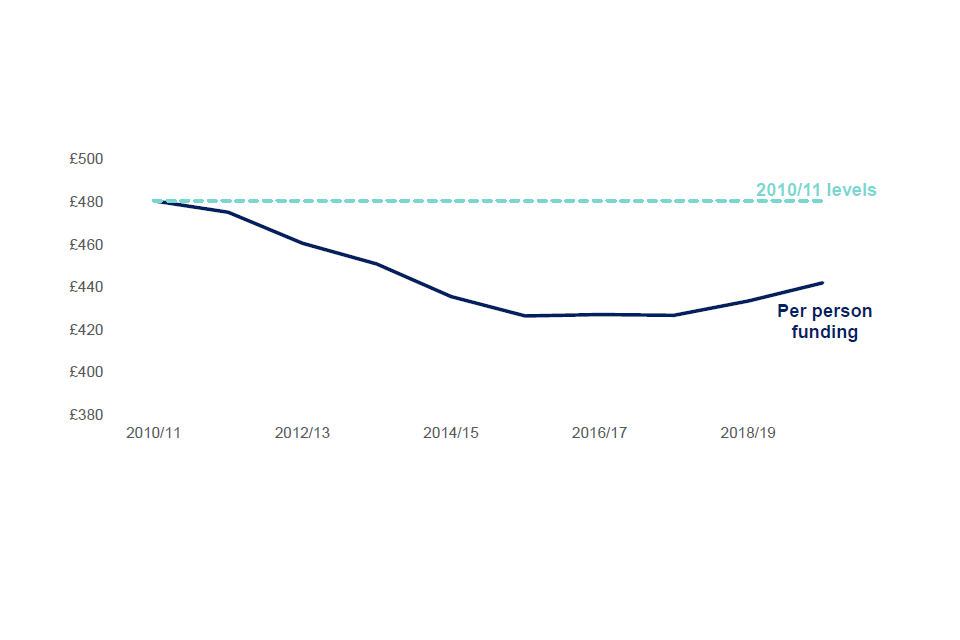
Source: NHS Digital, 2020; ONS, 2020.
Notes: Figures adjusted for inflation using September 2020 HM Treasury GDP deflators. Adult population defined as 18 and over.
The MAC maintains that properly funding the care sector to allow improvements in pay and conditions is ultimately the key to addressing these workforce difficulties. However, the MAC also recognises that the required funding to address these problems is not likely to occur in the very short term. The majority of the new Health and Social Care-related increase in national insurance in April 2022 is initially earmarked for the NHS.
Recommendation
Whilst we do not believe that immigration policy can solve all, or most, of the workforce problems in social care, such policy can potentially help to alleviate the difficulties, at least in the short term. All the evidence we have considered so far points to a significant worsening in the ability of firms to recruit and retain care workers. The ending of freedom of movement has had both a direct and indirect effect on the social care sector. The direct effect is that care workers can no longer be recruited from the EEA as they are not covered by the new skilled worker (SW) route, though senior care workers can be recruited through the SW route. The indirect effect is the increased competition for workers from other sectors that have similarly seen reduced access to EEA workers. We are also mindful of the substantial public benefit that the care sector provides, over and above the economic benefit. We therefore recommend that the Government make Care Workers and Home Carers (SOC Code 6145) immediately eligible for the Health and Care Worker Visa and place the occupation on the Shortage Occupation List (SOL). This will allow employers to sponsor care workers subject to a minimum salary of £20,480 per year – equivalent to £10.10 per hour for a full-time worker.
The MAC recognises that this is not a solution that will work for all employers in the sector. Many employers will not be registered as sponsors and the cost of the immigration route may be too high for some small and medium enterprises (SMEs). The government could additionally consider ways of making the immigration system more accessible for adult social care SMEs. This could include using the Workforce Recruitment and Retention Fund to reduce the financial cost of recruitment through the immigration system. We also recognise that many care worker jobs pay significantly below the rate of £10.10 per hour. We note however that this rate is equivalent to the 48th percentile for this occupation according to the most recent ASHE data and that the Scottish Government has introduced a minimum pay rate of £10.02 per hour from December 2021, and so some employers are likely to benefit. There is already evidence that some adult social care employers are increasingly using the immigration system, as highlighted in Chapter One, with the number of applications for senior care workers rising over the course of the year to around 400-500 per month in recent months. This interim recommendation will be reviewed in our full report in April 2022.
The MAC also recognises that this recommendation will not be relevant for other groups of workers in social care. A particular concern are live-in carers who are employed by individuals privately or by individuals in receipt of direct payments. We have heard from a number of stakeholders about the reliance that many had on short-term EEA workers to fill these roles and the difficulty in recruiting domestic workers for whom the live-in nature of the job may not fit with their family circumstances. There is however currently limited evidence on these roles, and we are actively working to understand this labour market more thoroughly and to consider whether a bespoke immigration route would be appropriate. Given the more limited evidence and more complex policy issues involved, we do not think it appropriate to make any interim recommendations on live-in care.
Other adult social care occupations in direct care provision such as senior care workers, nurses and care home managers are already eligible to use the Health and Care Worker Visa, and so we do not think it is necessary to provide any interim recommendations for these occupations. The final report will provide a full analysis of all the evidence for these occupations and consider how the immigration system works, or does not work, for them.
4: Costs of the immigration system
Introduction
There are direct and indirect costs of using the Points-Based System for both employers and migrants. This chapter reviews the costs of the immigration system focusing on the Skilled Worker (SW) route, the primary work visa route. We provide estimates for the direct and indirect costs of usage and examine three case studies for illustrative occupations. We also review sponsorship costs for employers, as well as indicative comparisons to international equivalents.
Background Information
Direct fees
Figure 4.1 outlines the stages of a skilled worker visa application. The route is demand driven, so begins with a UK-based firm recruiting a migrant. The employer must have a sponsorship licence which requires proof of meeting various suitability criteria, the implementation and understanding of systems with which sponsored employees can be monitored, and the provision of regular updates of changes made to the company. The licence process puts the responsibility of preventing abuse of immigration routes on the sponsor, to protect both migrant workers and the UK labour market.
Figure 4.1: The stages of a skilled worker visa application
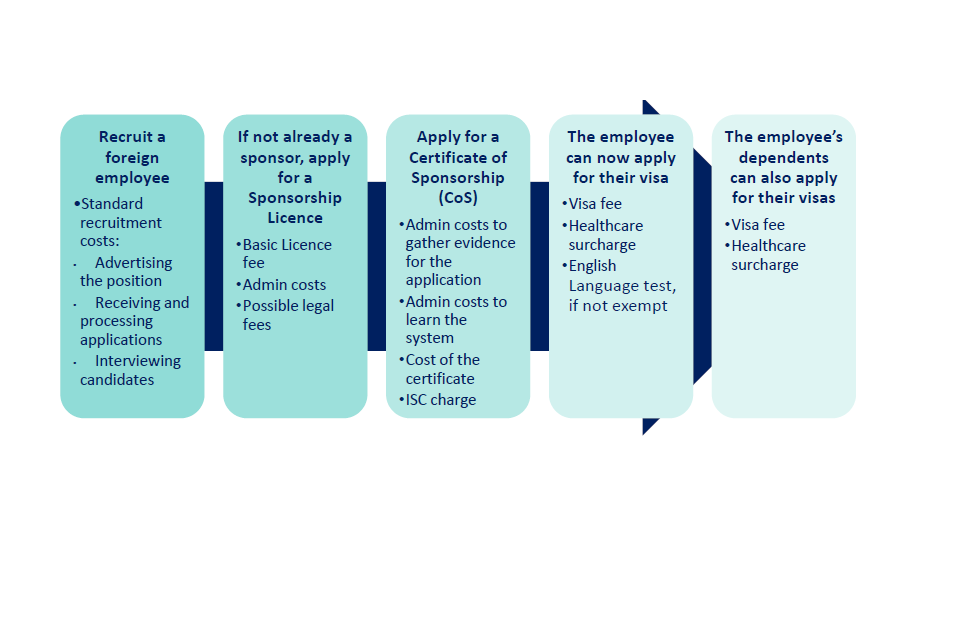
Source: Home Office immigration and nationality fees: 11 October 2021.
Recruit a foreign employee
- Standard recruitment costs:
- Advertising the position
- Receiving and processing applications
- Interviewing candidates
If not already a sponsor, apply for a Sponsorship Licence
- Basic Licence fee
- Admin costs
- Possible legal fees
Apply for a Certificate of Sponsorship (CoS)
- Admin costs to gather evidence for the application
- Admin costs to learn the system
- Cost of the certificate
- ISC charge
The employee can now apply for their visa
- Visa fee
- Healthcare surcharge
- English Language test, if not exempt
The employee’s dependents can also apply for their visas
- Visa fee
- Healthcare surcharge
Costs of the SW route vary, depending on the type of migrant but often include: a visa charge, the healthcare surcharge, the Immigration Skills Charge (ISC), as well as the costs of a Certificate of Sponsorship, and a licence. These official fees are outlined in Table 4.2 below. Most government fees (the direct costs of the sponsorship system) are per employee though the licence cost is fixed per employer. Some costs are adjusted depending on the size of the firm, such as the ISC and the licence cost. While some fees are designed for cost recovery, others such as the ISC and healthcare surcharge can be viewed as additional taxes.
Table 4.2: Breakdown of Costs
| Fee | Cost | One-time payment? | Fixed or per worker |
|---|---|---|---|
| Worker Sponsor Licence (Small/Medium & Large) | £536/£1476 | Must be renewed every 4 years | Fixed |
| Certificate of Sponsorship | £199 | Yes | Per worker |
| Immigration Skills Charge (Small/Medium & Large) | £364/£1000 per year | Yes, all paid at CoS application | Per worker |
| Visas less than 3 years: Skilled workers | £610 | Yes | Per worker |
| Visas less than 3 years: Shortage Occupation | £464 | Yes | Per worker |
| Visas less than 3 years: Health and care | £232 | Yes | Per worker |
| Visas more than 3 years: Skilled workers | £1,220 | Yes | Per worker |
| Visas more than 3 years: Shortage Occupation | £928 | Yes | Per worker |
| Visas more than 3 years: Health and care | £464 | Yes | Per worker |
| Healthcare fees | £624 per year | Yes, all paid at visa application | Per worker |
| English Language Test* | ≈£180 | Yes | Per worker |
Source: Home Office immigration and nationality fees: 11 October 2021 - GOV.UK (www.gov.uk), IELTS , Language Cert, PSI, Trinity
*The English Language test varies in price depending on where it’s taken, however on average will cost someone from a non-majority English speaking country £180, rounded.
Additionally, there are also several allowances and exemptions, as detailed in Table 4.3 below. The Council of Europe’s Social Charter (CESC) fee concessions are being removed in February 2022.
Table 4.3: Exemptions and allowances
| If… | Then… |
|---|---|
| The employee is a citizen of one of 26 countries who have legally ratified the conditions of the CESC of 1961* | The employee’s visa, but not their dependents’, is reduced by £55; and The employer does not pay £199 for a certificate of sponsorship |
| The employee is a particular type of scientist, a member of the clergy, a sports coach or player, or in higher education teaching | The employer does not have to pay the ISC of £364/£1000 |
| The employee has a degree taught in English, or has passed an English exam started before turning 18, or is from an approved country | The employee does not require an English Language Test |
| The employee is applying for visas from inside the UK: unit cost of each is £127 (outside) or £317 (inside) | The visas cost £704/£1408 instead of £610/£1220 |
Source: Home Office immigration and nationality fees: 11 October 2021 - GOV.UK (www.gov.uk), Visa fees transparency data - GOV.UK (www.gov.uk)
*To be removed on 26 February 2022.
Indirect costs
Fees are just one part of the total cost of usage. There are also indirect costs, derived from the time required to complete each stage of the process: this is something mentioned by employers in recent research (forthcoming). The system is complex, often leading firms to seek external support. Costs, without VAT, for assistance with a licence application can range from an estimated £2,000-£7,000[footnote 1]. There are likely to be additional fees per worker, or for on-going assistance. However, there are few published estimates.
Exact estimates of administration costs vary. The Home Office previously estimated that the administrative burdens of using the immigration system can cost employers £1018 per worker, this was based upon estimates from Global Future and EY (PDF, 1 MB) which ranged from £189 to £1,750. There is a large range of uncertainty around estimates, so to provide an indicative estimate we have assumed the administrative cost is roughly £1000 for the rest of this chapter. We may expect costs to fall if administration is completed in-house, as staff become more experienced with the system. An All Party Parliamentary Group (APPG) on migration inquiry (PDF, 8.5 MB) reported that almost half of firms who were not sponsors cited excessive related costs as a reason, whilst 47% were concerned about the complexity of the legal requirements. However, the APPG sample size is very limited (<100 responses) and concentrated in certain sectors, therefore these figures are at best indicative. The evidence suggests that there are substantial costs associated with the immigration system that fall outside of the direct costs of applications.
Streamlining of the sponsorship process
In 2020 the government replaced the Tier 2 General route with the SW route. The SW route introduced alterations to the sponsorship system. The Resident Labour Market Test (RLMT) and the cap on numbers were both removed, and the online system was streamlined. These changes allowed the sponsorship application process to be reduced by up to 8 weeks (PDF, 216 KB). The focus, so far, seems to have been on reducing application time rather than cost per se, though it should be noted that if the simplification of the system allows firms to rely less on external support, or input less resource towards the sponsorship application, this would reduce the cost. This process is ongoing, and the government is exploring further simplification of the route.
As the SW route was only introduced in January 2021, and due to the impact of the pandemic, it is difficult to gather clear evidence identifying whether the streamlining changes have increased demand for licences. The APPG survey (PDF, 8.5 MB) results suggested that 70% of employers are having increased difficulty using the new system, and over a third of respondents that do not hold a sponsor licence cited lack of capacity for related administration as a deterrent for applying for one. As mentioned above, these figures are only indicative, and many of these employers did not previously use the immigration system, as prior to the ending of freedom of movement, they could hire EU citizens without a visa. A more complete analysis would be required to untangle the effects of the post-Brexit immigration system and the effects of the specific sponsorship reforms.
Sponsoring costs
The APPG inquiry (PDF, 8.5 MB) suggests from employer feedback that the costs of sponsorship can be, in some cases, prohibitive with around half of the non-licence holders who offered evidence reporting costs as a deciding factor. As previously mentioned, this study is limited due to sample size, and further research would help to improve the evidence base.
The APPG analysis (PDF, 8.5 MB) also indicated that firms with higher revenue, who tend to be larger and hire more employees, generally considered costs to be less of a concern, and they understood the guidelines better. Immigration costs are smaller as a percentage of total costs for larger firms, so can be more easily absorbed. Fixed costs are generally divided among more sponsored employees, as over a 5-year period, micro, small and medium firms on average issued 2 Certificates of Sponsorship (CoS), whilst large firms issued 5. Large firms are over-represented, assigning 59% of all CoS in the private sector, despite only employing 48% of the UK’s workers.
The current sponsorship system creates a large cost burden when firms hire their first foreign employee, due to the administration required. Therefore, smaller firms, which may only access the foreign labour market for one or two employees, can face large costs. Figure 4.4 displays how smaller firms disproportionately access the foreign labour market for just 1 or 2 workers during the duration of their 5-year sponsorship licences.
Figure 4.4: Number of sponsors by number of used certificates of sponsorship over a 5-year period, split by firm size
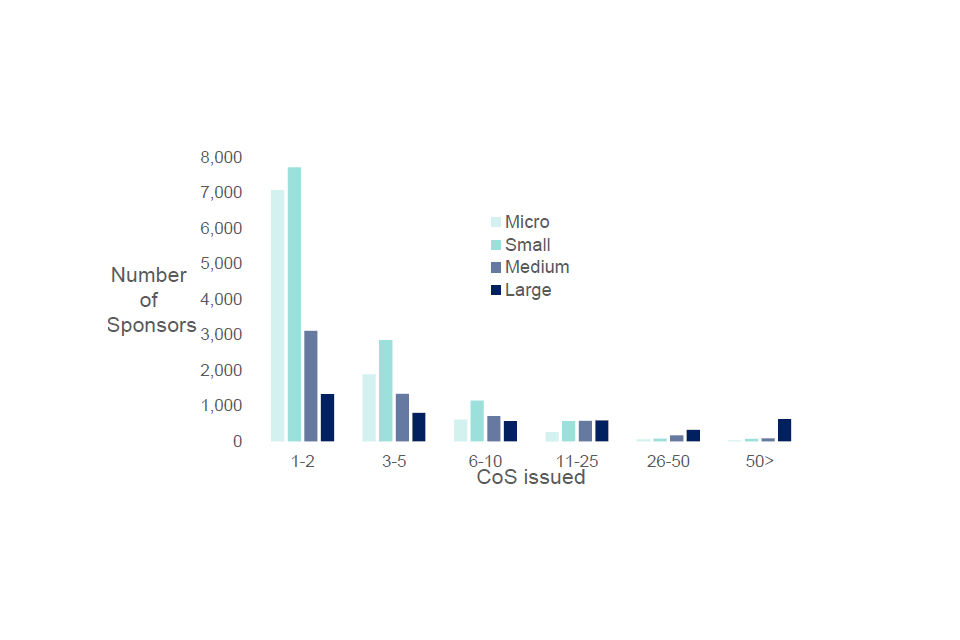
Source: Home Office Management information, Certificate of Sponsorship (CoS) data 01 Jan 2015 to 31 Dec 2019.
Note: Used CoS, only includes CoS used for the T2G route.
Cost is not the only factor which influences smaller firms’ access to migrant workers. They may lack the capacity or specialised knowledge to use the system. Larger firms are likely to have specialised HR departments with access to more detailed knowledge, or even employ individuals specifically for these tasks. Whereas smaller firms may employ staff who are employed for other purpose, who lack the specialised knowledge of the immigration system. Further evidence on composition of staff could be useful to build the evidence base.
The MAC has carried out a small-scale qualitative study with 28 employers in 3 sectors (manufacturing, IT, and construction), the report from which is forthcoming. Given the timing of the research, which took place during the spring and summer of 2021, few employers had recruited migrants from RQF3-5 occupations between the January 2021 changes to the immigration system and the time of fieldwork. We spoke to employers representing various company sizes, locations in the UK, and numbers of migrants recruited (including those who did not recruit migrants). We found that although employers were aware of the high cost and effort involved in hiring a migrant, and this formed part of their considerations, for many employers whether or not a prospective employee was a migrant did not appear to influence hiring decisions very far, especially for RQF6+ jobs. In many cases where employers recruited migrants, they were already in the UK (whether on a student/work visa or under free movement). Only in some cases where skills were particularly hard to find in the UK, or where language/cultural knowledge was an advantage, did employers specifically look to recruit someone from overseas, and most often employers said that this had previously been from the EU.
Even if employers are concerned about high fees, the alternatives to sponsoring a migrant worker may also involve costs. For example, it could mean leaving a vacancy unfilled whilst continuing to search for a worker who does not need to be sponsored or paying additional fees to recruit through a recruitment consultant, which is likely to cost around 15% of salary according to those we interviewed. Recruitment consultants tend to only recruit from the domestic market, hence if the choice is between a domestic worker with a 15% premium (who still must be found) or a foreign worker already found online (or who has approached the employer themselves) at a lower premium, the latter may well be favoured, even factoring in immigration fees. Immigration fees are therefore not the only recruitment cost employers have to consider. Although employers are not blind to the cost of immigration fees, the alternatives therefore also come with costs attached.
Although employers had limited experience of recruiting at RQF3-5 level (and consequently we obtained less evidence on these occupations) the costs of migration appeared to play a bigger part in employers’ hiring decisions for these occupations.
Stakeholder evidence suggests that there are entry barriers to becoming a sponsor for smaller firms with lower revenue and limited capacity. Moreover, sponsors who hire fewer workers then must spend more per worker. However, employers may still find this to be worthwhile if the alternative is leaving a position unfilled or filling it with someone who is not the best candidate for the job. This is more likely to be the case in RQF6+ occupations.
Illustrative occupations
Immigration costs are not proportionate to wages and make up a larger share of total labour costs for firms employing lower wage workers. Table 4.5 details the breakdown of costs for three different occupations: senior care workers, chefs, and university lecturers, chosen to represent different points in the wage distribution. For comparison we have assumed that the workers are employed by a large firm and are the fifth migrant employee.
Table 4.5 shows that immigration costs as a percentage of total cost are lowest for university lecturers, as we would expect given their higher wage. The nominal cost for the university lecturer is also lower due to their exemption from the ISC, although the relative cost would still be lower even without this exemption.
Senior care workers and their employers’ benefit from a range of measures to reduce the burdens of immigration costs, paying less for visas and not being subject to the healthcare surcharge. Nonetheless, the costs of immigration still represent a higher share of total labour costs relative to a highly paid worker.
Table 4.5: Breakdown of costs for example foreign employees on 3-year contracts
| Care worker w/ partner | Chef w/ partner | Uni Lecturer w/ partner | |
|---|---|---|---|
| Sponsorship Licence | £295 | £295 | £295 |
| CoS | £199 | £199 | £199 |
| Immigration Skills Charge | £3,000 | £3,000 | £0 |
| Admin* | £1,000 | £1,000 | £1,000 |
| Legal** | £1,000 | £1,000 | £1,000 |
| Visas | £464 | £1,220 | £1,220 |
| Healthcare Surcharge | £0 | £3,744 | £3,744 |
| ELR | £180 | £180 | £180 |
| Salary*** | £61,440 (£20,480/year) | £93,000 (£31,000/year) | £122,400 (£40,800/year) |
| NI | £4,518 | £8,873 | £12,930 |
| Pension** | £1,282 | £2,228 | £26,194 |
| Total costs | £73,377 | £114,739 | £169,162 |
| Government fees | £4,138 | £8,638 | £5,638 |
| Other Immigration Costs | £2,000 | £2,000 | £2,000 |
| % Immigration | 8.4% | 9.3% | 4.5% |
*Based on a Home Office Impact Assessment rough estimate
**Rough estimate of £5,000 for the legal fees of assistance with a licence application, though the figure can range £2,000-£7,000+VAT. The £5,000 estimate is divided between 5 employees in each case which results in an average cost of £1,000.
***Care worker earning minimum for SW route, chef and lecturer earning median for sponsored workers in their respective occupations
**Pension assumed to be compulsory minimum for care worker and chef, and Universities Superannuation Scheme rate for lecturers
Many factors can change these percentages. The average number of dependants is 0.78, however if we look at an example in which each worker is assumed to bring in 3 dependants (a family of 4), lecturers still represent a lower immigration cost, as a proportion of income, than social care workers. This is despite social care workers being exempt from four sets of health care surcharges and paying less than half for each visa. In fact, sensitivity analysis shows that when changing either the number of dependants, size of firm, number of migrants already employed or country of origin, lecturers always represented the lowest relative cost in comparison to social care workers and chefs. The new immigration system seeks to create a high wage economy, and higher salary workers paying proportionally less than lower salary workers could positively influence the type of migrants coming to work in the UK. However, this disproportionality could still be maintained while lowering costs across the board.
International comparisons
We provide some international comparison by looking at costs of the immigration routes with similarities to the SW route. Immigration systems differ largely between nations, so direct comparison is difficult. The main work visa for professionals in the USA is the H-1B visa, which can be granted for up to 6 years, in 3-year increments. In France, the Talent Passport EU Blue Card can be granted for 4 years and is renewable. In Germany, a residency permit will be granted if the worker meets the requirements of a work visa. The main long-term work visa in Australia is the 482 visa, which can also be granted for up to 4 years. Canada offers a general work permit, so long as the employer has met the system compliance requirement. Table 4.6 below shows a comparison of these countries against the UK.
Table 4.6: International costs of skilled worker immigration
| Country | Total cost of single applicant for 3 years (£) | Percentage of the total cost for a single applicant for 3 years paid directly by the worker |
|---|---|---|
| UK* | 5,681 | 44% |
| Australia | 4,580 (AUD 8,537) | 32% |
| Canada | 272 (CAD 470) | 51% |
| France** | 1,027-2,151 (EUR 1,198 - 2,510) | 11% - 21% |
| Germany | 150 (EUR 175) | 100% |
| USA | 1,923 (USD 2,650) | 7% |
Source: APPG on migration inquiry (PDF, 8.5 MB), Recruiting a foreign employee: cost for the employer - Welcome to France
*The UK’s cost here, for comparison, includes only per worker government fees, and assumes the sponsor is a large firm
**Includes a fee of 55% of gross monthly salary, up to 55% of 2.5 times the minimum. The smaller figure uses the minimum monthly salary.
The UK immigration system appears comparatively expensive. Factors affecting immigration cost vary by country. In the UK, key factors are the duration of sponsorship (since some of the fees are per year), and the size of the firm. The US alters some fees depending on the share of employees at a firm who are sponsored and there is an additional fee for firms with more than 50 employees where over half are on the H1-B visa. The French system enforces a tax on the employer relative to salary paid, so that firms paying higher salaries are expected to pay more for using foreign labour.
Conclusion
On the whole, the UK immigration system is relatively expensive and time consuming. Smaller firms in particular may struggle to sponsor employees, due to the high initial direct and indirect fixed costs. Depending on the nature of the occupational labour market, these costs may ultimately be borne by the worker. On the other hand, there may also be benefits to a system with high costs. The UK no longer has a cap on the number of visas issued under the SW route, and a higher level of immigration costs will induce less use i.e. firms will hire fewer migrants. If the government has an objective of reducing demand for overseas skilled workers, high immigration costs are arguably a more efficient method of reducing demand than a cap since they effectively act as a tax, paid by those who derive most value from hiring migrants. By contrast, a cap has more of a chance element that does not reflect willingness to pay, and also does not raise any revenue. Due to the introductions of the healthcare surcharge and ISC, direct costs of immigration roughly quadrupled between 2014 and 2018. Since 2018 there have not been substantive cost changes, up to or after the cap removal. Alongside high costs, the system has additional barriers for entrants, such as specific criteria for type of work, salary, and the English language requirements. These in combination with high costs allow the UK to exert some control over the level of immigration through the SW route without resorting to a cap. High costs may additionally benefit domestic workers in competition for the same jobs by making them comparatively cheaper to hire, particularly in lower paying occupations. This is in addition to the salary thresholds already in place to prevent undercutting. However, it is not clear whether or not the government does in fact have an objective of reducing the number of skilled workers coming from overseas.
The system could surely be simplified. For example, currently a lecturer from Malta pays £3,436 less than a chef from Estonia in immigration fees simply as a result of different exemptions. It is a positive step that the UK will no longer offer a reduction in cost according to nationality, from February 2022. It would surely be beneficial to conduct a more thorough review of all the various exemptions, to ensure that they are still appropriate.
Overall, it is unclear how the size and type of fee influences migrants’ decisions to choose the UK as a destination, or for employers within the UK to enter/leave the market for foreign labour. There is an evidence gap of the impact on the migration system of adding or removing an exemption and the extent to which changes in fees affect overall levels of migrant flows. Further evidence is also required on who ultimately pays for the immigration costs and whether employers are able to pass on costs to the migrant. If employees are having to pay a large proportion of the fees, directly or indirectly, we could assume this would affect the supply of foreign skilled workers, who may choose other nations where immigration costs are lower.
Further evidence would be useful to better understand exactly how fees influence firms’ decisions to employ foreign workers. This is particularly important in the context of the ending of freedom of movement, which will result in a greater number of firms and workers interacting with the immigration system. The costs for micro, small, and medium firms which previously relied on hiring EU workers are relatively more substantial and this may affect their ability to access the new immigration system.
5: Indeed data exploration
Introduction
This section outlines how data provided by Indeed, a job search website, could be used to support MAC projects. In particular, this section looks at the interaction between recruiters and job seekers across sectors, the impacts of the pandemic on remote working and the implications or insights that could be gained from the data in relation to migration policy.
Indeed is the most used jobs website globally for both employers and job seekers, and collects a vast amount of data, some of which it has shared with the MAC. The MAC also has access to data from Burning Glass, which compiles job postings data from a number of websites. This is useful when looking at labour demand, and has been used to identify occupations struggling to recruit that could potentially benefit from being on the SOL. However, data are limited in relation to labour supply. Access to the Indeed data will allow the MAC to compare the two sources and gain further insight into the relationship between recruiters and job seekers.
The data from Indeed does not cover the whole labour market but provides insight into job-seeker behaviour for a large proportion of it. This is something the MAC would otherwise only have very limited data on.
Employers may face recruitment difficulties for a range of reasons, most of which would mean one of the following has occurred:
- a. There has been an increase in demand without an equivalent increase in the labour supply; or
- b. There has been a decrease in the labour supply without an equivalent decrease in demand; or
- c. There has been both an increase in demand and a decrease in the labour supply.
This emphasises how an understanding of recruitment issues requires information on both the demand and supply of available labour – simply knowing that a sector or occupation has vacancies does not mean that there are not enough job seekers willing to work in that sector. The Indeed data improves our evidence base on both the demand and supply side of the jobs market.
Changes to labour market supply and demand
The average number of clicks per posting (i.e., the number of times the individual posting is opened) relative to the overall average on Indeed may provide some insight into where there is an imbalance between the supply of labour and the demand for it. This could be beneficial to the MAC in providing additional evidence when evaluating an occupation’s inclusion on the SOL, at least at a sectoral level.
However Indeed does not cover the whole labour market, with some job seekers using different sites and some jobs being recruited offline. Individual sectors may then see variation in the apparent popularity of jobs across sites for many reasons, including personal preferences and occupational cultures. For example, healthcare professionals could prefer to use the NHS jobs site or individual communities may prefer a site because members have successfully found employment through it. There are also sectors that often use different recruitment practices, making less use of online methods. In these instances, the data may only be capturing the behaviour of a small proportion of the market.
The data provided shows the average number of clicks per job posting. However, a limitation of the data is that each posting could be for multiple vacancies and individuals can click on multiple adverts, or the same advert multiple times. This is not accounted for in the data.
Given the data limitations and scope it is not possible to draw conclusions based on the Indeed data alone. However, used in collaboration with other data sources, Indeed has the potential to be helpful in providing real-time insights into labour market conditions.
Clicks per posting and the SOL
The clicks per posting across sectors provided by Indeed can be compared to the SOL occupations, though imperfectly. While the data are not as granular as the SOL occupations, sectors can be broken down into three main groups based on the 2020 review (PDF, 8.3 MB).
- a. Sectors where all occupations were recommended for the SOL.
- b. Sectors where some, but not all, occupations were recommended for the SOL.
- c. Sectors where no occupations were recommended for the SOL.
Where some, but not all, occupations were recommended this could be for a wide range of reasons. These include but are not limited to: ineligibility at the skill level threshold for some occupations; lack of benefit from inclusion due to high wages across an occupation; discrete recruitment challenges in certain occupations within a sector; and insufficient provision of evidence for recruiting difficulties from stakeholders.
Figure 5.1 shows that on average, where a sector is entirely included on the SOL it sees a much lower proportion of clicks per posting than if some, or none, of the occupations within the sector are included compared to the average. This suggests that there may be less interest in these sectors from job seekers, compared to the desired recruitment levels within those sectors.
It also shows that a lower number of clicks per posting is likely if some of the occupations within the sector are included, compared to if none of them are. This suggests that the Indeed data displays similar trends to the occupations identified in the last SOL review.
Figure 5.1 also shows an increase in clicks per posting from occupations with some inclusion on the SOL at the last review, and a decrease in clicks per posting in sectors with no inclusion on the SOL since pandemic restrictions began to ease in March 2021. This may indicate that there may be value in the MAC reviewing the SOL again once the short-term impacts from the pandemic begin to fade. We currently expect the Government to commission the MAC to review the SOL in 2022.
Figure 5.1: Average clicks per posting seen across sectors by inclusion on the SOL, 2016 to 2021
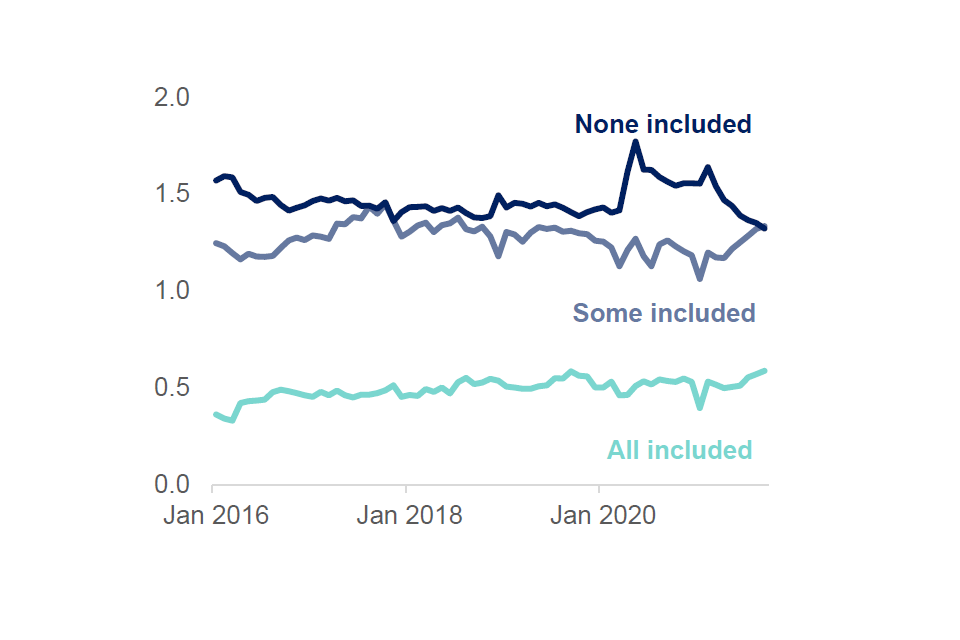
Table 5.2: Examples of sectors by proportion of occupations recommended to be on the SOL in 2020
| All occupations recommended for SOL inclusion | Some occupations recommended for SOL inclusion | No occupations recommended for SOL inclusion |
|---|---|---|
| Software Development | Industrial Engineering | Hospitality & Tourism |
| Nursing | Personal Care & Home Health | Dental |
| Physicians & Surgeons | Construction | Retail |
| Electrical Engineering | Scientific Research & Development | Legal |
| Civil Egineering | Arts & Entertainment | Cleaning & Sanitation |
| Architecture | Food Preparation & Services | Driving |
| Mechanical Engineering | Education & Instruction | Administrative Assistance |
| Chemical Engineering | Veterinary | Accounting |
Source: Indeed, Average Clicks per Posting Seen by Sector, Relative to the Average, January 2016 - September 2021
Note: In Figure 5.1 each data point represents a monthly period (e.g. Aug 2020). 2021 only includes data points up to September 2021. Sectors are grouped based on the proportion of occupations within them contained on the SOL. Sectors do not perfectly match to the SOC codes used to identify occupations so judgements have been made in some instances. The average is taken for each sector across the group, giving them equal weighting regardless of the proportion of job adverts at the time.
While, at a sectoral level, the data provided by Indeed could be used to support the suggestion of recruitment difficulties, it would be unable to provide substantive proof of this by itself. There are many reasons why sectors could display signs of lower interest from the labour market. It would also be unable to capture disparities within discrete occupations, like secondary STEM teachers, which employers may find difficult to recruit, despite seeing sufficient interest in vacancies across most of the sector or occupational group.
Impacts of the pandemic on remote working
Indeed have also provided the MAC with data on the proportion of job adverts offering remote working by sector. Figure 5.3 shows the average proportion of job adverts offering remote working. It shows that in the two years prior to the pandemic, remote working was being offered in fewer than 5% of job adverts in most sectors. Until September 2019, only IT Operations and Helpdesk had remote working as an option in more than 10% of job adverts. However, small increases had been seen in most sectors.
From April 2020, the proportion of jobs offering remote working began to increase rapidly as a result of the restrictions in place on business. This continued throughout 2020 and peaked in February 2021, with some decline occurring between March and June 2021 as restrictions were eased.
The increase in the proportion of adverts offering remote working also flattens or reduces over 2020 in line with the relaxing of restrictions. Sectors advertising lower amounts of home working seem to have been most impacted by the restriction changes on average.
As restrictions were eased from March to July 2021, the proportion of adverts offering remote working decreased on average. However, restrictions were fully lifted in July 2021 and since then the rate of decline has slowed considerably. As the average proportion of remote working being offered is still much higher than the pre-pandemic levels, it suggests some of the impacts are likely to be longer-term, particularly in sectors where the proportion of adverts offering remote working is the highest.
Figure 5.3: Average proportion of job adverts offering remote working, 2018 to 2021
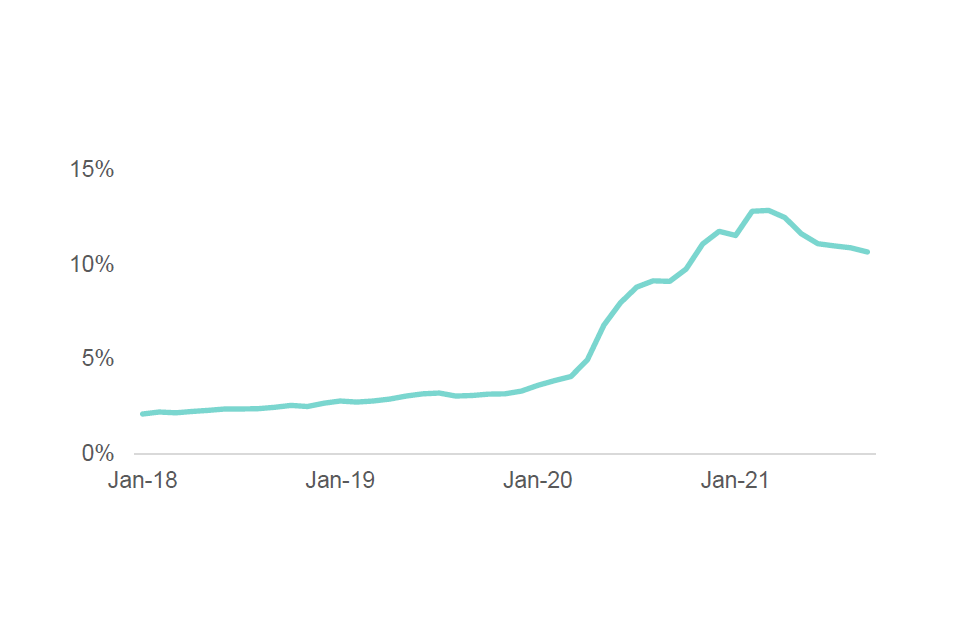
Source: Indeed, Proportion of Job Adverts Offering Remote Working by Sector, January 2018 - September 2021
Note: Each data point represents a monthly period (e.g. Aug 2020). 2021 only includes data points up to September 2021. The average is taken from all sectors, giving them equal weighting regardless of the proportion of job adverts at the time.
Table 5.4 shows that on average sectors have not seen large movements in their relative positions; those with the highest and lowest offerings of remote working in September 2021 on average also had the highest and lowest offerings pre-pandemic.
From December 2019 to September 2021 almost every sector has seen some increase in the proportion of job adverts offering remote working. However, of the 19 sectors with less than 2% of job adverts offering remote working in 2019, 11 of those still had less than 2% in September 2021 and only two of those increased to more than 5%. None exceeded 10%.
This suggests that sectors which have historically offered lower levels of remote working have continued to do so, whilst those more able to accommodate remote working, have increased it. This is most clearly demonstrated in the software development sector where proportions of adverts offering remote working increased from 11% to 37%. Additional examples of sectors with the highest and lowest proportions of adverts offering remote working can be seen in Table 5.4.
Table 5.4: Sectors offering the highest and lowest proportions of remote working in September 2021
| Bottom 10 Sectors | Dec-19 | Sep-21 | Top 10 Sectors | Dec-19 | Sep-21 |
|---|---|---|---|---|---|
| Dental | 0% | 1% | Software Development | 11% | 37% |
| Food Preparation & Service | 1% | 1% | IT Operations & Helpdesk | 17% | 27% |
| Beauty & Wellness | 1% | 1% | Information Design & Documentation | 7% | 26% |
| Veterinary | 1% | 1% | Marketing | 5% | 25% |
| Cleaning & Sanitation | 1% | 1% | Insurance | 3% | 23% |
| Pharmacy | 0% | 1% | Media & Communications | 5% | 23% |
| Childcare | 1% | 1% | Social Science | 4% | 22% |
| Personal Care & Home Health | 1% | 1% | Arts & Entertainment | 6% | 21% |
| Driving | 0% | 2% | Project Management | 6% | 21% |
| Production & Manufacturing | 1% | 2% | Mathematics | 6% | 20% |
Source: Indeed, Proportion of Job Adverts Offering Remote Working by Sector, January 2018 - September 2021
Note: The bottom and top 10 from each sector are based on the September 2021 value.
In December 2019 only two of the 53 sectors had more than 10% of job adverts offering remote working. However, by September 2021, that number had increased to 23, with 11 of those offering more than 20%. This suggests there has been a substantial increase in remote working across some sectors.
Of the sectors with higher proportions of job adverts offering remote working, almost all are employing workers at RQF3 and above. This allows them access to the UK’s Skilled Worker route. Therefore, there is the possibility that there will be a reduction in migration to the UK if employers are happy to outsource labour.
While the sectors provided by Indeed do not perfectly match SOC codes, they can be largely aligned. Table 5.5 shows the 10 sectors with the highest number of visa applicants granted in 2018 and 2019. It is in these sectors where substantial switches to remote working could have the biggest impact on immigration.
Four of these sectors are also in Table 5.4 as they had the highest proportion of job adverts offering remote working: software development, IT operations & helpdesk, social science and media and communications. Changes in the proportion of job adverts offering remote working in these sectors can be seen in Figure 5.6.
These sectors accounted for around two-fifths of the visa applicants on the Tier 2 General route (the SW route’s predecessor) issued and used in the two years preceding the pandemic, equating to between 12,000 and 16,000 migrant workers each year.
The average remote working offer across those sectors increased by 18 percentage points from December 2019 to September 2021. If employers were willing to extend that offer internationally, it could mean a reduction of 2,000 to 3,000 migrant workers arriving in the UK each year from these sectors. However, this figure is highly indicative as it is not known whether job seekers in these sectors want to work remotely, or whether employers are willing to recruit remote workers from further afield.
Table 5.5: Sectors granted the most Tier 2 (General) visas in 2018 and 2019
2018
| Sector | % |
|---|---|
| Social Science | 14% |
| Software Development | 13% |
| Management | 11% |
| IT Operations & Helpdesk | 11% |
| Accounting | 8% |
| Education & Instruction | 7% |
| Banking & Finance | 6% |
| Sales | 5% |
| Media & Communications | 3% |
| Industrial Engineering | 3% |
2019
| Sector | % |
|---|---|
| Social Science | 14% |
| Software Development | 13% |
| Management | 11% |
| IT Operations & Helpdesk | 11% |
| Accounting | 8% |
| Education & Instruction | 7% |
| Banking & Finance | 6% |
| Sales | 5% |
| Media & Communications | 3% |
| Industrial Engineering | 3% |
Source: Home Office Management information, Certificate of Sponsorship (CoS) data, 2018 and 2019.
Note: Used CoS. CoS is assigned to a migrant by their sponsoring employer and the migrant can then use the certificate number to make a visa application. Only General T2 applications are included. Some SOC codes map to jobs in multiple sectors. Where this is the case, a judgement has been made on which sector data is included.
Figure 5.6: Proportion of job adverts offering remote working, 2018 to 2021
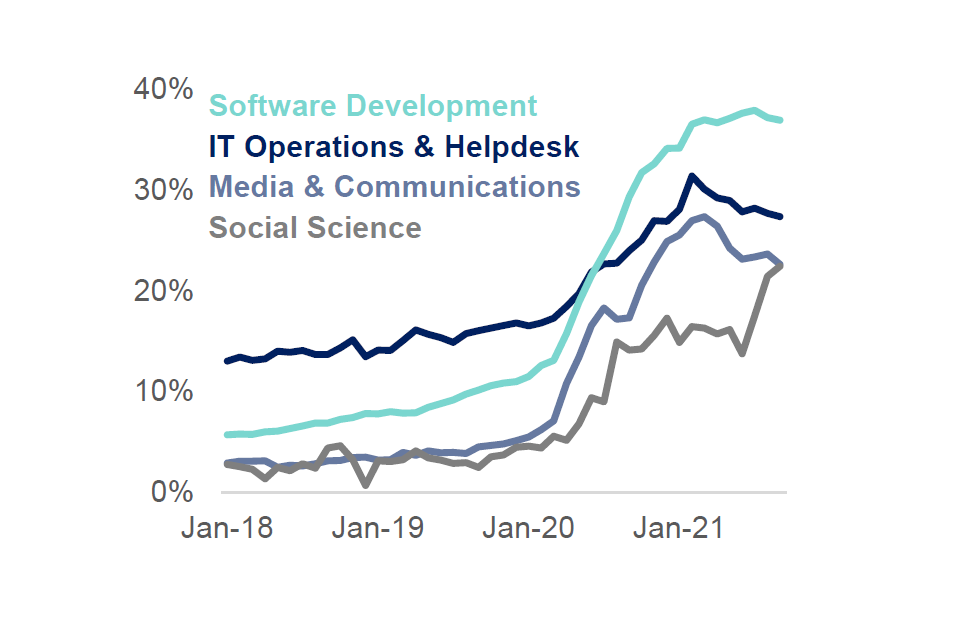
Source: Indeed, Proportion of Job Adverts Offering Remote Working by Sector, January 2018 - September 2021.
Note: Each data point represents a monthly period (e.g. Aug 2020). 2021 only includes data points up to September 2021.
There are a small number of sectors eligible to use the SW route that would be likely to struggle to increase the proportion of remote working jobs, such as dental and veterinary. However, in most instances, the sectors least able or willing to increase remote working options are also those with the least access to the SW route. This would include sectors like food preparation and service, and cleaning and sanitation. Additional examples can be seen in Table 5.4.
Summary
Real time labour market data can be helpful for improving our evidence base, and the MAC will continue to explore these possibilities. The data have many potential uses, including:
- providing additional information on sectors facing recruitment issues and where inclusion on the SOL could be beneficial; and
- in understanding where possible migration changes could be seen due to changes in employment practices or salaries.
The data will allow the MAC to gain further insights into both recruitment practices and the job-seeker behaviour surrounding that. Additional evidence will also be used alongside the data, including primary research and stakeholder insights to better understand the reasons behind observed changes.
Indeed have also provided the MAC with a range of other data, including changes to salaries which could provide further evidence of sectors seeing a gap between labour supply and demand, particularly where salaries are increasing. The MAC will continue to work with Indeed, exploring potential data uses and utilising the data provided where appropriate.
6: Forward look
This chapter outlines some of the work the MAC is, and expects to be, carrying out during 2022.
The MAC is delivering work against the following key priorities:
- Responding to the current commission on adult social care and preparing for future Government commissions (i.e. future reviews of the Shortage Occupation List (SOL)), including reviewing the methodology by which we measure occupation shortage within the SOL;
- Improving the data available to the MAC and making better use of existing data held across government for research on migration; and
- Undertaking independent analysis to continue to build the evidence on migration in the UK, including evaluation of changes to the migration system.
Further details on the analytical work referred to in this chapter are available elsewhere in the report, and the results of our analysis will also be made available in due course.
Shortage methodology review
The Home Office regularly commissions the MAC to review the SOL, most recently in 2020. The exact timings of the next review remain uncertain. This may be a partial review of some sectors or qualification levels, or an overall review.
As we have mentioned in previous reviews, we are always open to revising our methodology so that we can provide the best decisions in assessing labour market shortages.
At present, for a role to be added to the SOL, the role needs to meet three overarching criteria: is the role skilled to the required level; is the role in shortage; is immigration a sensible solution to the issue?
Skilled
An occupation’s skill level is based on the length of time it would take to train a new entrant to become fully competent in the performance of the tasks associated with a job. In its report SOC 2010 volume 1: structure and descriptions of unit groups, the Office for National Statistics (ONS) describes its skill level measure as follows:
“Skill level is defined with respect to the duration of training and/or work experience recognised in the field of employment concerned as being normally required in order to perform the activities related to a job in a competent and efficient manner… Skill levels are approximated by the length of time deemed necessary for a person to become fully competent in the performance of the tasks associated with a job. This, in turn, is a function of the time taken to gain necessary formal qualifications or the required amount of work-based training. Apart from formal training and qualifications, some tasks require varying types of experience, possibly in other tasks, for competence to be acquired.”
We are currently using SOC 2010 data but will continue to review the move to SOC 2020 data and ensure we use the best available evidence.
Shortage
In late 2020, the Skills and Productivity Board (SPB) were asked by the Secretary of State for Education to explore which areas of the economy face the most significant skills mismatches. Their approach is to identify labour shortages using indicators and then work out what the key skills are in those shortage occupations and in aggregate. Their methodology draws heavily from the MAC’s previous shortage indicators.
We are working closely with colleagues at the SPB to determine if we can use their work to identify whether a role is in shortage. We expect them to publish their work in 2022, which currently aligns well with our own plans.
Sensible
The sensible criterion, whether immigration is a sensible solution to skills shortage, will be where this review focuses most. Our objective is to consider the types of evidence that provide the most convincing cases for migration to be the appropriate solution to skill shortages, and to develop guidance for stakeholders and employers to help them better prepare responses to future calls for evidence. We will publish our detailed guidance ahead of our next SOL review.
We are aiming to have this work completed before the next Home Office commission.
Evaluation of the Future Border and Immigration System (FBIS)
The MAC previously provided details on plans for evaluation. Initially we plan to focus on two elements of the Skilled Worker route, namely the impacts of Salary Thresholds and the SOL. Baselines and counterfactuals will need to be designed carefully and wider impacts such as COVID-19 impacts will need to be acknowledged and if possible, accounted for.
Since the last Annual Report, progress has been made on the evaluation framework. Firstly, logic mapping has been conducted to link the Salary Threshold and SOL policy levers to the rationale for having these in place and potential long-term impacts. This is used to design research questions which we aim to address within the evaluation. Next, indicators have been designed for how these questions can be addressed, this includes a combination of data analysis tools and potential primary research to gain a deeper understanding into impacts and drivers of impacts. During this time, data sources have been explored for the purposes of the evaluation and developed our understanding of COVID-19 and EU Exit impacts on migrant flows.
Next steps include obtaining high-quality, reliable data for the purposes of the evaluation and ensuring our primary research projects are well-defined and fit for the purposes of the evaluation. We are keen to encourage collaboration across Government Departments through data-matching (for example HMRC-Home Office Visa matched data). Matched data will be critical for providing deeper insights from datasets and informing on impacts of the immigration system for the evaluation.
Although COVID-19 impacts have been touched on, these impacts continue to persist and impact migrants as well as the UK labour market and so more time is required to at least partially differentiate between these impacts, the impact of the ending of Freedom of Movement and the new immigration system.
Devolved Nations
The new Devolved Nations (DN) team within the MAC secretariat has been established to provide greater understanding of the distinct challenges facing the labour markets and economies of each devolved nation and how they interact with migration.
The team has three national leads based in Belfast, Cardiff, and Glasgow. Each lead will provide greater capacity to engage with stakeholders in their DN and make visible to the Committee the distinct challenges these stakeholders face within their national contexts.
As well as providing a DN perspective on all commissions and wider projects in the secretariat, in the coming year the team will:
- proactively engage with the Devolved Administrations and other key stakeholders in each DN.
- establish a regular method of data collection from key stakeholders in each DN to better understand key issues and concerns.
- conduct a review of relevant regional datasets to support the wider work of the secretariat.
The team will synthesise these insights with other qualitative and quantitative data sources to provide the Committee with up-to-date regional economic analysis, thematic briefings on key policy debates and their relevance to the MAC.
HMRC/visa data matching
The MAC have been supporting the Home Office and HMRC in a data matching exercise. This exercise matches Home Office Visa data with the Migrant Worker Scan and HMRC data on employees via the Pay As You Earn system and other sources of income reported on the Self-Assessment return, such as the self-employed. This will provide valuable insight into migrants in the UK over time and build a picture of their contribution to the economy and effectiveness of the visa system. An initial pilot study has been conducted to assess the feasibility of matching the visa data to HMRC earnings information, using a sample of cases. The pilot produced promising match rates, which indicate that a full match of the data would be worthwhile and significantly add to the evidence base. As expected, match rates were generally higher for those entering on work related visas such as Tier 2.
The analysis has the potential to be helpful in improving government’s understanding of long-term immigration impacts, which will help to ultimately deliver better evidence-based policy. The MAC is keen to progress the full match and make use of the data as soon as possible. We will continue to support HMRC and the Home Office on this in 2022.
Progression of migrant’s salary analysis
Following on from the migrant salary progression analysis we included in the MAC 2020 Annual Report, we are looking to refresh and expand the analysis. This will include reviewing the methodology and data used, alongside expanding on the analysis previously undertaken to explore impacts of changing jobs or industry. We aim to publish a standalone document during 2022.
-
Various published estimates: Batley Law, Carter Camerons (PDF, 87.8 KB), Danielle Cohen, Gentili Stark. ↩