Research report: Mapping and Understanding the UK Civil Society Sector
Published 28 May 2026

© Crown copyright 2026
This publication is licensed under the terms of the Open Government Licence v3.0 except where otherwise stated. To view this licence, visit nationalarchives.gov.uk/doc/open-government-licence/version/3 or write to the Information Policy Team, The National Archives, Kew, London TW9 4DU, or email: psi@nationalarchives.gov.uk.
Where we have identified any third party copyright information you will need to obtain permission from the copyright holders concerned.
This publication is available at https://www.gov.uk/government/publications/mapping-and-understanding-the-uk-civil-society-sector/research-report-mapping-and-understanding-the-uk-civil-society-sector
Executive Summary
The UK Data Spine is the first comprehensive register of the UK civil society sector, bringing together records from ten regulatory bodies into a single deduplicated dataset of over 770,000 organisations.
Civil Society Demography
- Scale and diversity: The Data Spine contains 770,923 organisation records, of which approximately 369,000 are currently active — including approximately 194,000 charities, 41,000 CICs, 12,000 co-operatives and mutuals, and 122,000 other non profit companies. Beyond these four main categories, the ‘Other’ category can be disaggregated into at least ten meaningful subtypes including property management companies, education institutions, sports clubs, and religious organisations.
- Geographic variation: The density of civil society organisations varies substantially across the UK. When measured per 100,000 population, some Local Authorities have several times the national average concentration of charities or CICs, with distinct geographic patterns for each organisation type. In England, analysis by Index of Multiple Deprivation (IMD) decile shows considerable variation in density by CSO type. Charities and Nonprofit Companies are present in higher densities in less deprived areas, in contrast to CICs which are present in higher densities in more deprived areas. Co-operatives and mutuals are present in similar densities across the deprivation distribution.
- Organisation age: The age profile of civil society organisations differs markedly between countries and organisation types. Over 55% of active charities in England have operated for more than 20 years, compared with 48.1% in Scotland.
- CIC employment: Of the 41,369 active CICs, Companies House account records are available for 25,824 (62.4%). Of those, 9,042 (35.0%) report at least one employee. Among this employing population, the median number of employees is 3 and has remained stable since 2020. Employment status cannot be determined for the remaining 15,545 CICs with no account record on file.
Civil Society Finances
- Financial trajectories: Charity incomes have grown in nominal terms across most ICNPTSO sectors, but real (inflation-adjusted) income growth has been modest or negative for many sectors since 2008.
- Organisation size: A third of active UK charities are micro-organisations with annual income below £10,000, and a further two fifths are small (£10,000 to £100,000). Only 5.5% have income above £1 million. The size distribution for CICs is similar: two fifths are micro-organisations and a further two fifths are small. Major charities (income above £10 million) account for 67.5% of total charity income despite representing only 5.5% of organisations.
- Loss-making organisations: Between 30% and 45% of charities and CICs report expenditure exceeding income in any given year, with notable spikes during the aftermath of the 2008 financial crisis and the COVID-19 pandemic.
Civil Society Procurement
- Organisation size and procurement: Public procurement is dominated by large and major organisations. Among charities, those with incomes between £1m and £100m account for nearly two-thirds of contracts and an even larger share of funding. The pattern is similar for CICs, where large and major CICs account for over 60% of contracts. Micro and small organisations of all types are almost entirely absent from procurement markets.
- Department-level variation: UK Government departments vary considerably in where their civil society procurement is directed. Some departments allocate over 90% to charities, while others direct the majority to other nonprofit companies.
Introduction
This report presents findings from the UK Third and Civil Society Sector Database (the ‘Data Spine’), a research infrastructure that brings together data from ten UK regulatory sources to provide a comprehensive picture of the civil society sector.
The Data Spine was developed by Braw Data Ltd as part of an ESRC and DCMS-funded research project, in collaboration with the Third Sector Research Centre at the University of Birmingham and partner institutions at the Universities of Southampton, Oxford, Stirling, and the West of Scotland.
The Data Spine represents a step-change in how the civil society sector can be analysed. For the first time, comprehensive and consistent financial data are available not only for charities but also for CICs, co-operatives, and other nonprofit companies — organisational forms that have historically lacked comparable financial reporting. The Data Spine enables users to:
- identify and track every formally registered civil society organisation in the UK
- analyse the financial trajectories of charities and nonprofit companies over time
- examine patterns in public procurement contracts awarded to civil society organisations
The Data Spine contains records for over 770,000 civil society organisations drawn from across the UK. These include charities registered with the Charity Commission for England and Wales (CCEW), the Office of the Scottish Charity Regulator (OSCR), and the Charity Commission for Northern Ireland (CCNI), as well as Community Interest Companies (CICs), co-operatives and mutuals, and other nonprofit companies registered at Companies House.
This report demonstrates these capabilities through three research themes — civil society demography, finances, and procurement — before describing the construction and contents of the Data Spine.
Defining civil society organisations
Civil society organisations (CSOs) are formally registered entities that operate independently of government and exist to serve a public or community benefit rather than to generate profit for owners or shareholders. The Data Spine covers four main types:
-
Charities are organisations registered with one of the three UK charity regulators (CCEW, OSCR, or CCNI). They must exist for exclusively charitable purposes and operate for the public benefit.
-
Community Interest Companies (CICs) are a type of limited company introduced in 2005, designed for social enterprises that use their profits and assets for community benefit. CICs are subject to an ‘asset lock’ ensuring that assets are retained for the community, and must file an annual community interest report with the CIC Regulator.
-
Co-operatives and Mutuals are organisations owned and democratically controlled by their members, who may be employees, customers, or residents. They are registered with the Financial Conduct Authority.
-
Other nonprofit companies are companies registered at Companies House that are limited by guarantee (rather than by shares) and do not distribute profits. This category encompasses a wide range of organisations including property management companies, sports clubs, education institutions, religious organisations, and professional associations.
Civil Society Demography
Types of organisations
The Data Spine classifies organisations into four main types: Charity, CIC, Co-operative/Mutual, and Other. Across the UK, charities account for 52.6% of all active civil society organisations, followed by other nonprofit companies (33.1%), CICs (11.2%), and co-operatives and mutuals (3.1%). Table 1 shows the composition of the active sector by organisation type and country. Counts and column percentages are shown for each country.
Panel A shows the four main types. Panel B disaggregates the ‘Other’ category into meaningful subtypes using Companies House SIC (Standard Industrial Classification) codes and organisation name patterns. The classification applies SIC division codes (the first two digits of the primary SIC code) alongside keyword matching on organisation names, using a priority ordering to resolve ambiguities.
Property management companies account for 15.2% of all active organisations in England and 6.4% in Wales, but under 2% in Scotland (0.3%) and Northern Ireland (1.8%), reflecting the prevalence of residential leasehold structures in England and Wales. Property management companies are the largest subtype, followed by the residual ‘Other Nonprofit’ category.
Table 1: Active civil society organisations by type and country
Counts and column percentages. Panel A shows the four main organisation types. Panel B shows disaggregated subtypes of the ‘Other’ category.
| Type | England | Scotland | Wales | N. Ireland | UK |
|---|---|---|---|---|---|
| Panel A: Organisation type | |||||
| CIC | 36,941 (11.8%) | 2,076 (6.8%) | 1,702 (11.9%) | 606 (5.5%) | 41,325 (11.2%) |
| Charity | 155,539 (49.5%) | 23,725 (78.3%) | 7,895 (55.4%) | 7,233 (65.9%) | 194,392 (52.6%) |
| Co-operative / Mutual | 9,571 (3%) | 867 (2.9%) | 740 (5.2%) | 453 (4.1%) | 11,631 (3.1%) |
| Other | 111,862 (35.6%) | 3,651 (12%) | 3,914 (27.5%) | 2,681 (24.4%) | 122,108 (33.1%) |
| Panel B: Subtypes of ‘Other’ | |||||
| Arts Organisation | 2,666 (2.4%) | 261 (7.1%) | 193 (4.9%) | 171 (6.4%) | 3,291 (2.7%) |
| Dormant Company | 2,312 (2.1%) | 70 (1.9%) | 66 (1.7%) | 53 (2%) | 2,501 (2%) |
| Education Institution | 8,381 (7.5%) | 336 (9.2%) | 274 (7%) | 391 (14.6%) | 9,382 (7.7%) |
| Health Organisation | 1,733 (1.5%) | 82 (2.2%) | 78 (2%) | 138 (5.1%) | 2,031 (1.7%) |
| Housing Association | 59 (0.1%) | 4 (0.1%) | 0 (0.0%) | 2 (0.1%) | 65 (0.1%) |
| Membership Organisation | 3,421 (3.1%) | 258 (7.1%) | 151 (3.9%) | 167 (6.2%) | 3,997 (3.3%) |
| Other Nonprofit Company | 33,218 (29.7%) | 1,771 (48.5%) | 1,398 (35.7%) | 858 (32%) | 37,245 (30.5%) |
| Professional / Trade Body | 2,432 (2.2%) | 150 (4.1%) | 73 (1.9%) | 46 (1.7%) | 2,701 (2.2%) |
| Property Management Company | 47,866 (42.8%) | 105 (2.9%) | 915 (23.4%) | 195 (7.3%) | 49,081 (40.2%) |
| Religious Organisation | 1,822 (1.6%) | 70 (1.9%) | 38 (1%) | 185 (6.9%) | 2,115 (1.7%) |
| Social Services Organisation | 2,128 (1.9%) | 76 (2.1%) | 73 (1.9%) | 166 (6.2%) | 2,443 (2%) |
| Sports Club | 5,824 (5.2%) | 468 (12.8%) | 655 (16.7%) | 309 (11.5%) | 7,256 (5.9%) |
Source: UK Civil Society Spine, Companies House SIC codes.
Organisation age
Table 2 shows the age distribution of active civil society organisations by type and country. Organisation age is calculated as 2024 minus the registration year. Ages are grouped into four bands: 0 to 5 years, 5 to 10 years, 10 to 20 years, and 20 or more years. Organisations are ordered as Charity, CIC, Co-operative/Mutual, and Other.
The age profile varies substantially between countries. Over 55% of active charities in England have operated for more than 20 years, compared with 48.1% in Scotland. Northern Ireland is excluded from this comparison as the CCNI register was established more recently and the age distribution is not directly comparable. CICs are a relatively young organisational form, with the majority registered within the last ten years.
Table 2: Active organisation age by type and country
Counts and percentages within each organisation type and country.
| Age Band | England | Scotland | Wales | N. Ireland | UK |
|---|---|---|---|---|---|
| CIC | |||||
| 0-5 years | 18,371 (65.2%) | 905 (57.2%) | 853 (65.8%) | 295 (56.9%) | 20,424 (64.7%) |
| 5-10 years | 5,990 (21.3%) | 470 (29.7%) | 291 (22.4%) | 155 (29.9%) | 6,906 (21.9%) |
| 10-20 years | 3,624 (12.9%) | 195 (12.3%) | 146 (11.3%) | 65 (12.5%) | 4,030 (12.8%) |
| 20+ years | 202 (0.7%) | 12 (0.8%) | 7 (0.5%) | 3 (0.6%) | 224 (0.7%) |
| Charity | |||||
| 0-5 years | 19,532 (12.9%) | 3,540 (15.5%) | 1,149 (15%) | 1,628 (22.9%) | 25,849 (13.7%) |
| 5-10 years | 19,165 (12.7%) | 3,619 (15.8%) | 1,092 (14.2%) | 4,359 (61.4%) | 28,235 (15%) |
| 10-20 years | 28,148 (18.6%) | 4,721 (20.6%) | 1,180 (15.4%) | 744 (10.5%) | 34,793 (18.4%) |
| 20+ years | 84,197 (55.7%) | 10,995 (48.1%) | 4,243 (55.4%) | 366 (5.2%) | 99,801 (52.9%) |
| Co-operative / Mutual | |||||
| 0-5 years | 1,106 (12%) | 113 (13.4%) | 87 (12.5%) | 22 (4.9%) | 1,328 (11.9%) |
| 5-10 years | 986 (10.7%) | 76 (9%) | 87 (12.5%) | 33 (7.3%) | 1,182 (10.6%) |
| 10-20 years | 1,298 (14.1%) | 99 (11.7%) | 63 (9%) | 19 (4.2%) | 1,479 (13.2%) |
| 20+ years | 5,794 (63.1%) | 555 (65.8%) | 461 (66%) | 378 (83.6%) | 7,188 (64.3%) |
| Other | |||||
| 0-5 years | 29,591 (29.2%) | 1,147 (36.4%) | 1,168 (33.4%) | 541 (21.5%) | 32,447 (29.3%) |
| 5-10 years | 20,367 (20.1%) | 607 (19.3%) | 781 (22.3%) | 470 (18.7%) | 22,225 (20.1%) |
| 10-20 years | 28,559 (28.2%) | 733 (23.2%) | 892 (25.5%) | 610 (24.2%) | 30,794 (27.8%) |
| 20+ years | 22,894 (22.6%) | 666 (21.1%) | 654 (18.7%) | 895 (35.6%) | 25,109 (22.7%) |
Source: UK Civil Society Spine.
Geographic distribution
Figures 1a to 1d map the number of civil society organisations of each type per 100,000 population in every Local Authority across the UK. This per-capita measure controls for differences in population size between Local Authorities, giving a clearer picture of where civil society activity is concentrated relative to the resident population. The colour scale is trimmed at the 1st and 99th percentiles to prevent outlier Local Authorities from compressing the palette.
Figure 1a: Community Interest Companies per 100,000 population
By Local Authority, active organisations in 2024. Colour scale trimmed at 1st/99th percentiles. London boroughs shown in inset.

The heatmap shows the number of community interest companies per 100,000 population in every Local Authority across the UK.
Source: UK Civil Society Spine.
Figure 1b: Charities per 100,000 population
By Local Authority, active organisations in 2024. Colour scale trimmed at 1st/99th percentiles. London boroughs shown in inset.

The heatmap shows the number of charities per 100,000 population in every Local Authority across the UK.
Source: UK Civil Society Spine.
Figure 1c: Co-operatives and Mutuals per 100,000 population
By Local Authority, active organisations in 2024. Colour scale trimmed at 1st/99th percentiles. London boroughs shown in inset.

The heatmap shows the number of co-operatives and mutuals per 100,000 population in every Local Authority across the UK.
Source: UK Civil Society Spine.
Figure 1d: Other nonprofit companies per 100,000 population
By Local Authority, active organisations in 2024. Colour scale trimmed at 1st/99th percentiles. London boroughs shown in inset.

The heatmap shows the number of 'Other' organisation types per 100,000 population in every Local Authority across the UK.
Source: UK Civil Society Spine.
Top and bottom Local Authorities
Tables 3 and 4 show the Local Authorities with the highest and lowest density of each civil society organisation type per 100,000 resident population. For example, the City of London has 814 CICs per 100,000 residents — the highest CIC density of any Local Authority — though this partly reflects the very small resident population in the City. This per-capita measure is consistent with the maps above and controls for differences in Local Authority population size.
Note: Some Local Authorities may have high or low densities due to the registered office effect, where a company formation agent or solicitors’ firm in a particular area serves as the registered address for organisations operating elsewhere. New Forest, for example, has a disproportionately high density of ‘Other’ organisations because a large number of property management companies are registered at addresses there despite managing properties in other parts of the country. Other Local Authorities where the registered office effect is likely to be significant include City of London and Westminster (e.g., head offices of overseas charities are often based here).
Table 3: Local Authorities with the highest density of each organisation type
Active organisations in 2024, per 100,000 resident population.
| Local Authority | Country | Organisations | Population | Per 100K |
|---|---|---|---|---|
| CIC | ||||
| City of London | England | 123 | 15,111 | 814 |
| Camden | England | 661 | 216,943 | 305 |
| Westminster | England | 610 | 209,996 | 290 |
| Islington | England | 528 | 223,024 | 237 |
| Hackney | England | 493 | 266,758 | 185 |
| South Hams | England | 151 | 92,148 | 164 |
| Isles of Scilly | England | 3 | 2,366 | 127 |
| Lambeth | England | 394 | 316,920 | 124 |
| Southwark | England | 377 | 314,786 | 120 |
| Cornwall | England | 688 | 583,289 | 118 |
| Charity | ||||
| City of London | England | 1,432 | 15,111 | 9,477 |
| Westminster | England | 3,023 | 209,996 | 1,440 |
| Na h-Eileanan Siar | Scotland | 337 | 26,020 | 1,295 |
| Shetland Islands | Scotland | 271 | 23,190 | 1,169 |
| Orkney Islands | Scotland | 254 | 22,020 | 1,153 |
| Camden | England | 2,058 | 216,943 | 949 |
| Argyll and Bute | Scotland | 821 | 87,690 | 936 |
| Highland | Scotland | 1,841 | 237,290 | 776 |
| Isles of Scilly | England | 17 | 2,366 | 719 |
| Cotswold | England | 630 | 91,661 | 687 |
| Co-operative / Mutual | ||||
| City of London | England | 36 | 15,111 | 238 |
| Na h-Eileanan Siar | Scotland | 25 | 26,020 | 96 |
| Isles of Scilly | England | 2 | 2,366 | 85 |
| Orkney Islands | Scotland | 14 | 22,020 | 64 |
| Shetland Islands | Scotland | 11 | 23,190 | 47 |
| Powys | Wales | 64 | 135,059 | 47 |
| Westmorland and Furness | England | 109 | 230,185 | 47 |
| Belfast | Northern Ireland | 153 | 352,390 | 43 |
| Camden | England | 93 | 216,943 | 43 |
| Ceredigion | Wales | 30 | 72,599 | 41 |
| Other | ||||
| City of London | England | 1,032 | 15,111 | 6,829 |
| Westminster | England | 2,498 | 209,996 | 1,190 |
| Camden | England | 2,491 | 216,943 | 1,148 |
| Broxbourne | England | 991 | 101,900 | 973 |
| New Forest | England | 1,644 | 176,116 | 933 |
| Islington | England | 1,754 | 223,024 | 786 |
| Harlow | England | 563 | 98,235 | 573 |
| Hackney | England | 1,483 | 266,758 | 556 |
| Mole Valley | England | 450 | 88,709 | 507 |
| West Devon | England | 298 | 58,923 | 506 |
Source: UK Civil Society Spine.
Table 4: Local Authorities with the lowest density of each organisation type
Active organisations in 2024, per 100,000 resident population.
| Local Authority | Country | Organisations | Population | Per 100K |
|---|---|---|---|---|
| CIC | ||||
| Armagh City, Banbridge and Craigavon | Northern Ireland | 26 | 222,511 | 12 |
| North Lanarkshire | Scotland | 43 | 344,540 | 12 |
| East Dunbartonshire | Scotland | 15 | 109,970 | 14 |
| South Lanarkshire | Scotland | 46 | 334,030 | 14 |
| Mid Ulster | Northern Ireland | 22 | 152,718 | 14 |
| Eastleigh | England | 21 | 142,933 | 15 |
| Angus | Scotland | 17 | 114,810 | 15 |
| East Renfrewshire | Scotland | 15 | 99,830 | 15 |
| Falkirk | Scotland | 25 | 160,020 | 16 |
| Woking | England | 17 | 105,679 | 16 |
| Charity | ||||
| Knowsley | England | 146 | 162,565 | 90 |
| Tamworth | England | 80 | 81,117 | 99 |
| Wigan | England | 350 | 344,922 | 101 |
| Halton | England | 140 | 131,543 | 106 |
| Ashfield | England | 140 | 129,572 | 108 |
| South Tyneside | England | 165 | 151,393 | 109 |
| Cannock Chase | England | 122 | 104,088 | 117 |
| Blackpool | England | 171 | 144,191 | 119 |
| Tameside | England | 286 | 239,643 | 119 |
| Barnsley | England | 301 | 251,770 | 120 |
| Co-operative / Mutual | ||||
| East Renfrewshire | Scotland | 3 | 99,830 | 3 |
| Kingston upon Hull, City of | England | 10 | 275,401 | 4 |
| Bracknell Forest | England | 5 | 130,806 | 4 |
| Crawley | England | 5 | 124,008 | 4 |
| Wigan | England | 15 | 344,922 | 4 |
| East Dunbartonshire | Scotland | 5 | 109,970 | 5 |
| Luton | England | 11 | 239,090 | 5 |
| Ashfield | England | 6 | 129,572 | 5 |
| Slough | England | 8 | 167,359 | 5 |
| Gedling | England | 6 | 120,179 | 5 |
| Other | ||||
| North Lanarkshire | Scotland | 98 | 344,540 | 28 |
| Inverclyde | Scotland | 24 | 78,880 | 30 |
| West Dunbartonshire | Scotland | 29 | 89,120 | 33 |
| Clackmannanshire | Scotland | 17 | 52,110 | 33 |
| South Lanarkshire | Scotland | 112 | 334,030 | 34 |
| Falkirk | Scotland | 56 | 160,020 | 35 |
| Midlothian | Scotland | 35 | 99,880 | 35 |
| North Ayrshire | Scotland | 48 | 134,010 | 36 |
| Angus | Scotland | 42 | 114,810 | 37 |
| East Renfrewshire | Scotland | 38 | 99,830 | 38 |
Source: UK Civil Society Spine.
CSO density and deprivation
Figure 2 shows the relationship between CSO density and the Index of Multiple Deprivation (IMD) for English Local Authorities. Each point represents one Local Authority; the x-axis shows the IMD percentile (0 = most deprived, 100 = least deprived) and the y-axis shows the number of active organisations per 100,000 resident population in 2024. The y-axis is capped at the 99th percentile within each panel to prevent outlier Local Authorities from compressing the scale.
There is considerable variation in density by CSO type. Charities and Nonprofit Companies are present in higher densities in less deprived areas, in contrast to CICs which are present in higher densities in more deprived areas. Co-operatives and mutuals are present in similar densities across the deprivation distribution.
Figure 2: CSO density by IMD percentile, English Local Authorities

The line graphs shows the relationship between CSO density and the Index of Multiple Deprivation (IMD) for English Local Authorities.
Active organisations in 2024 per 100,000 population, by Index of
Multiple Deprivation (IMD 2025) percentile. English Local Authorities
only (n = 297). Y-axis capped at 99th percentile within each panel to
suppress outliers.
Source: UK Civil Society Spine; MHCLG English Indices
of Deprivation 2025.
CIC employment
Of the 41,369 active CICs in the Data Spine, Companies House account records are available for 25,824 (62.4%). Of those with records, 9,042 (35.0%) report at least one employee on average during the period; the remaining 16,782 report zero or no employee count, reflecting volunteer-run or owner-operated CICs. For the 15,545 active CICs with no account record on file, employment status cannot be determined.
Figure 3 shows the distribution of average employee numbers among the employing population, by financial year from 2016 to 2025. The median has remained stable at 3 employees since around 2018, and the interquartile range has narrowed from approximately 2 to 8 in 2016 to 1 to 5 by 2020, where it has remained broadly stable.
Employment data are available for some other CSO types in the raw Companies House accounts data but there are significant gaps in coverage, both by organisation (who chooses to file digitally or not) and by financial year (whether organisations file digitally consistently over time). The Data Spine addressed these gaps for CICs by collecting and parsing accounts filed as PDFs but this was not possible for other CSOs due to resource constraints.
Figure 3: CIC employment distribution by year
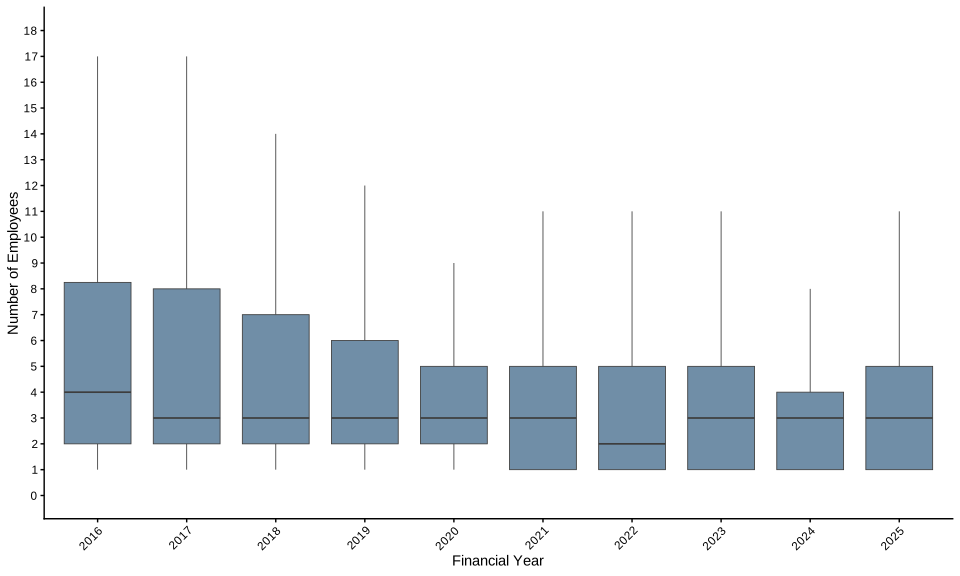
The boxplot shows the distribution of average employee numbers among the CIC employing population, by financial year from 2016 to 2025.
Distribution of average number of employees among active CICs
reporting at least one employee, 2016–2025. Outliers suppressed; y-axis
capped at 95th percentile.
Source: UK Civil Society Spine, Companies
House accounts data.
Civil Society Finances
Organisation size
The Data Spine links charity registration data with longitudinal financial records covering nearly 4 million charity-year observations. Financial data are drawn from the Charity Commission for England and Wales (2000 to 2025), the Office of the Scottish Charity Regulator (2006 to 2025), and the Charity Commission for Northern Ireland (2015 to 2026). All values are inflation-adjusted to 2023 prices using the ONS Consumer Price Index (CPI).
Charities are categorised using the International Classification of Non-Profit and Third Sector Organisations (ICNPTSO), which groups them into sectors such as Culture, Education, Health, Social Services, and Development. Each charity is assigned to a single ICNPTSO sector based on its primary field of activity, as classified by the UK Charity Activity Tags (UKCAT) project. Charities are not counted in multiple sectors. A more granular multi-tag taxonomy is also available in the UKCAT dataset for researchers requiring finer-grained classification.
Table 5 shows the distribution of active charities across NCVO income bands by country, based on each charity’s most recent year of reported income. A third of all active UK charities (33.9%) are micro-organisations with annual income below £10,000. A further two fifths (39.7%) are small, with income between £10,000 and £100,000. Only 5.5% have income above £1 million.
The size distribution is broadly similar across countries, though Scotland and Wales have a slightly higher proportion of micro-charities and a slightly lower proportion of large and major charities compared with England and Northern Ireland.
Table 5: Active charity size distribution by country
Based on most recent year of income, NCVO income bands (column percentages).
| Income Band | England | N. Ireland | Scotland | Wales | UK |
|---|---|---|---|---|---|
| Micro (<£10K) | 33.2% | 37.6% | 36.7% | 36.9% | 33.9% |
| Small (£10K-£100K) | 40.1% | 35.1% | 37.6% | 41.4% | 39.7% |
| Medium (£100K-£1M) | 21.0% | 23.5% | 20.5% | 17.6% | 20.9% |
| Large (£1M-£10M) | 4.7% | 3.3% | 4.0% | 3.6% | 4.5% |
| Major (£10M+) | 1.1% | 0.5% | 1.2% | 0.5% | 1.0% |
Source: UK Civil Society Spine, Charity Commission accounts data.
Table 5b shows the share of total charity income accounted for by each size band. While micro and small charities account for the majority of organisations, the income distribution is heavily concentrated among larger charities. Major charities (income above £10 million) account for 67.5% of total charity income despite representing only 1.0% of organisations.
Table 5b: Share of total charity income by size band and country
Percentage of total sector income accounted for by each size band.
| Income Band | England | N. Ireland | Scotland | Wales | UK |
|---|---|---|---|---|---|
| Micro (<£10K) | 0.1% | 0.2% | 0.1% | 0.2% | 0.1% |
| Small (£10K-£100K) | 2.2% | 3.5% | 1.8% | 2.6% | 2.2% |
| Medium (£100K-£1M) | 9.9% | 16.1% | 7.4% | 9.6% | 9.7% |
| Large (£1M-£10M) | 21.6% | 21.2% | 15.2% | 18.0% | 20.5% |
| Major (£10M+) | 66.2% | 59.0% | 75.5% | 69.6% | 67.5% |
Source: UK Civil Society Spine, Charity Commission accounts data.
Table 6 shows the size distribution of active CICs by country, based on each organisation’s most recent year of reported revenue from Companies House accounts. Two fifths of active CICs (39.9%) are micro-organisations with annual revenue below £10,000, and a similar proportion (41.4%) are small, with revenue between £10,000 and £100,000. Only 2.1% of CICs have revenue above £1 million.
Table 6: Active CIC size distribution by country
Based on most recent year of revenue (column percentages).
| Revenue Band | England | N. Ireland | Scotland | Wales | UK |
|---|---|---|---|---|---|
| Micro (<£10K) | 40.1% | 37.0% | 36.1% | 42.0% | 39.9% |
| Small (£10K-£100K) | 41.2% | 39.4% | 43.1% | 43.9% | 41.4% |
| Medium (£100K-£1M) | 16.5% | 21.3% | 19.5% | 13.0% | 16.6% |
| Large (£1M-£10M) | 1.8% | 2.3% | 1.2% | 1.0% | 1.8% |
| Major (£10M+) | 0.3% | 0.0% | 0.1% | 0.2% | 0.3% |
Source: UK Civil Society Spine, Companies House accounts data.
Revenue data are available for 14,709 of 41,325 active CICs (35.6%). CICs without revenue data have either not yet filed accounts with Companies House or have filed accounts in a format that does not include a turnover figure.
Table 6b shows the share of total CIC revenue accounted for by each size band. As with charities, the revenue distribution is substantially more concentrated than the organisational count would suggest. Major CICs (revenue above £10 million) account for 51.0% of total CIC revenue, and large CICs a further 21.0%, despite together representing only 0.3% and 1.8% of CICs respectively.
Table 6b: Share of total CIC revenue by size band and country
Percentage of total sector revenue accounted for by each size band.
| Revenue Band | England | N. Ireland | Scotland | Wales | UK |
|---|---|---|---|---|---|
| Micro (<£10K) | 0.4% | 0.1% | 0.8% | 1.4% | 0.4% |
| Small (£10K-£100K) | 6.7% | 16.4% | 14.9% | 18.6% | 7.1% |
| Medium (£100K-£1M) | 19.3% | 43.5% | 47.4% | 33.4% | 20.5% |
| Large (£1M-£10M) | 20.8% | 40.0% | 24.2% | 19.7% | 21.0% |
| Major (£10M+) | 52.9% | 0.0% | 12.6% | 26.8% | 51.0% |
Source: UK Civil Society Spine, Companies House accounts data.
Charity income growth
Figure 4 presents the median annual relative growth rate (ARG) for each ICNPTSO sector. The ARG is calculated as the ratio of each charity’s income in year t to its income in year t-1. A value of 1.0 indicates no change; values above 1 indicate growth and values below 1 indicate decline. Using ratios rather than absolute differences allows comparison across charities of different sizes and across sectors with very different income levels.
This measure reveals the impact of the 2008 financial crisis and COVID-19 on different parts of the sector.
Figure 4: Median annual relative income growth by ICNPTSO sector
Values above 1 indicate year-to-year growth in median income. Nominal and real (2023 prices).
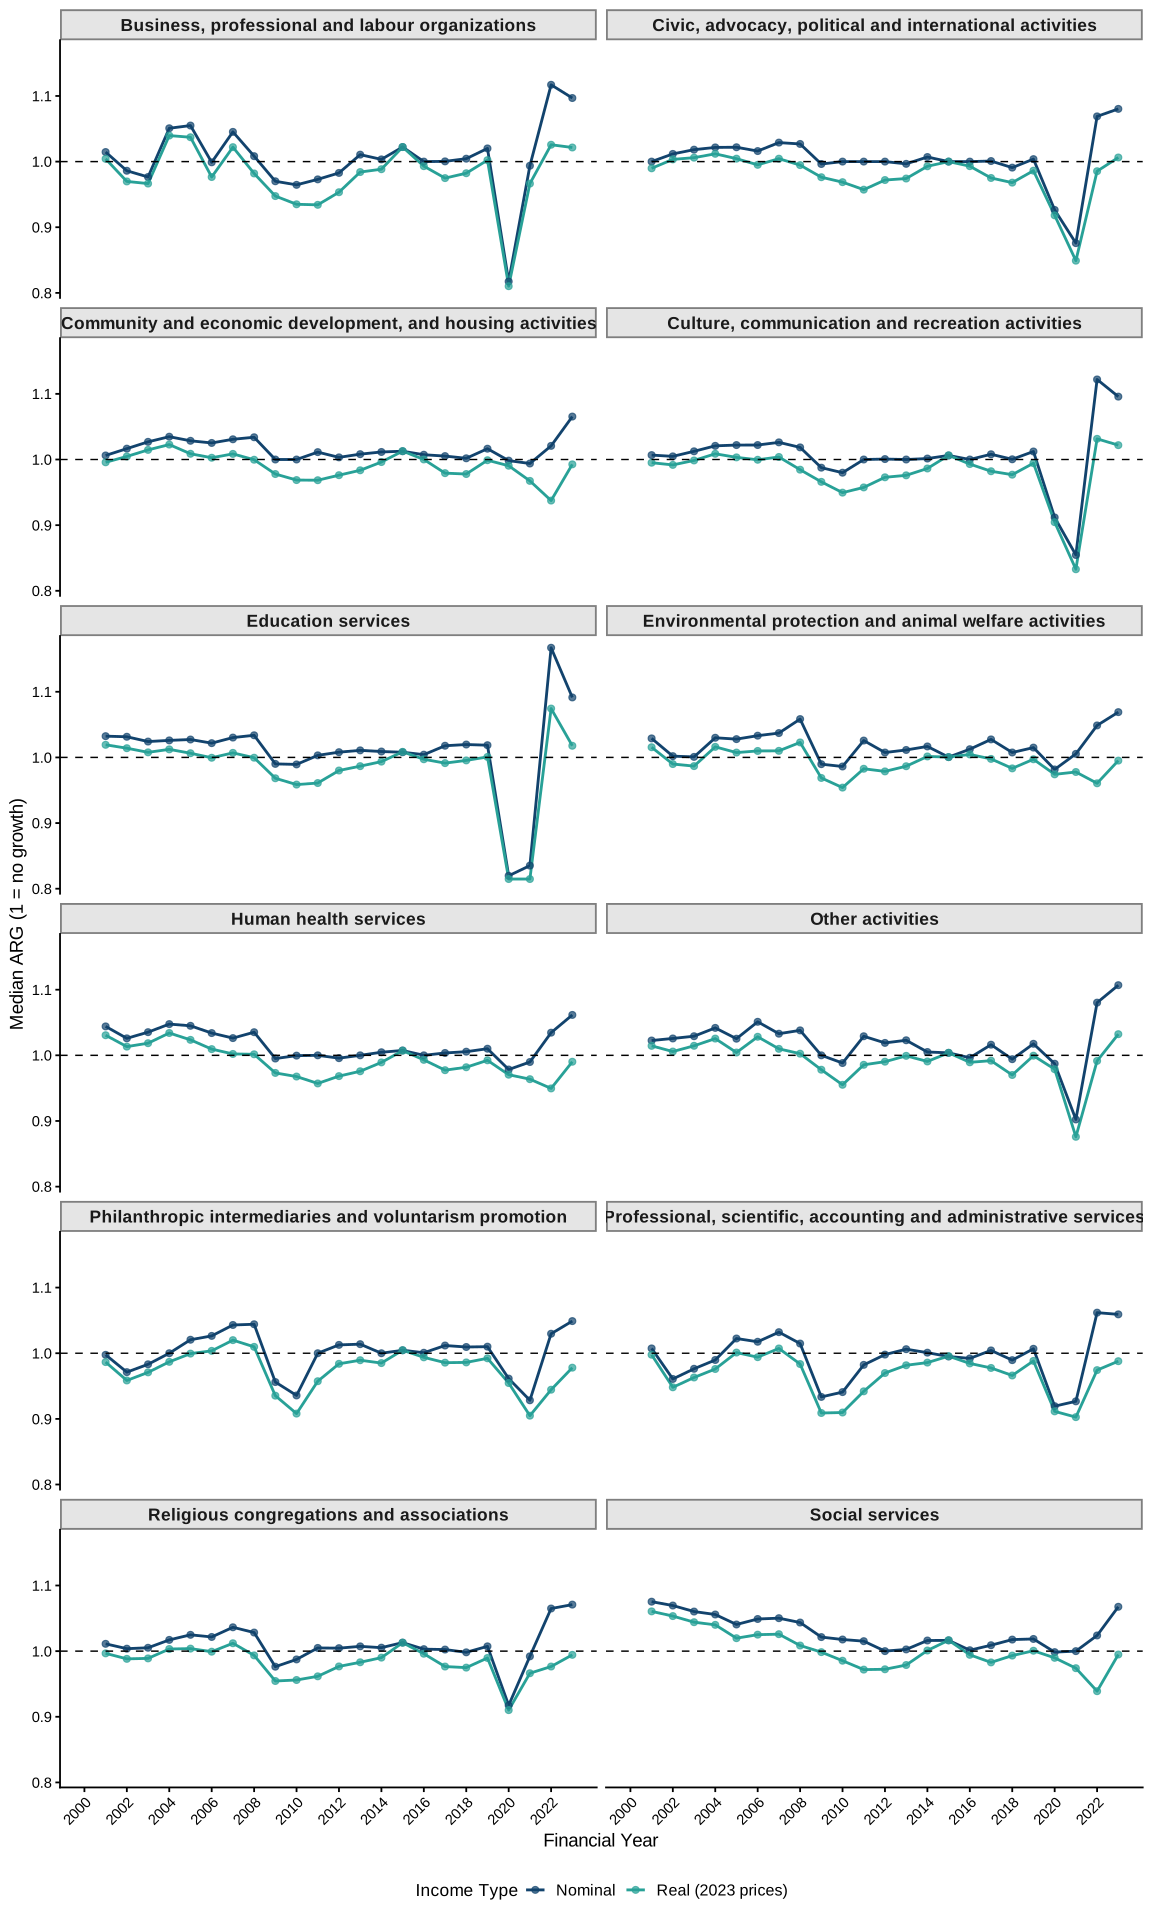
The line graphs show the median annual relative growth rate (ARG) for each ICNPTSO sector.
Source: UK Civil Society Spine.
Loss-making organisations
Figure 5 shows the proportion of charities and CICs reporting losses in each year from 2009 to 2023. A charity is classified as loss-making if its total expenditure exceeds its total income in a given year. For CICs, loss-making is defined as reporting a negative profit or loss for the period in their Companies House accounts.
The charity series is based on approximately 190,000 to 210,000 charity-year observations per year. The CIC series is based on a smaller but growing sample, rising from 252 CIC-year observations in 2009 to approximately 2,000 per year from 2016 onwards (20,371 observations in total over the period).
Both organisation types show loss-making rates between 30% and 45% in any given year. Both series show a decline around 2020-2021 followed by a sharp increase in 2023.
Figure 5: Percentage of loss-making organisations by type
2009-2023. Charities: expenditure exceeding income. CICs: negative profit/loss for the period.
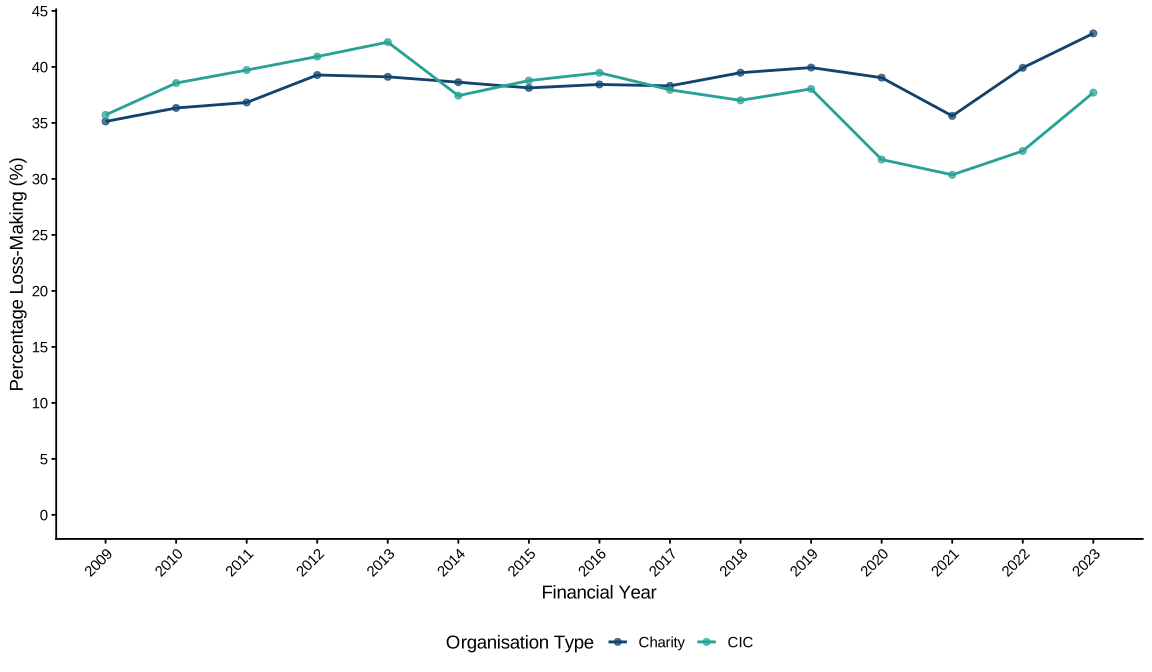
The line graph shows the proportion of charities and CICs reporting losses in each year from 2009 to 2023.
Source: UK Civil Society Spine, Charity Commission accounts data, Companies House accounts data.
Civil Society Procurement
Note: The procurement data in this report are a subset of the data held by Tussell, covering many Contracts Finder and ministerial and non-ministerial spending records but excluding EU tenders, Scottish tenders, and most local authority contracts. Readers should therefore not expect these figures to match those in the DCMS report on public procurement through VCSEs, which draws on the full Tussell dataset. The two datasets are complementary: the Tussell data provide more comprehensive procurement coverage and are better suited to statements about the macro procurement environment for civil society organisations, while the Data Spine linkage provides more precise identification of civil society organisations and enables analysis of the organisational causes and consequences of participating in procurement markets.
The Data Spine includes records of over 948,000 public procurement transactions between government bodies and civil society organisations. These records are drawn from central government, the NHS, local authorities, and other public sector bodies.
UK Government departments
Table 7 shows the proportion of each UK Government department’s procurement spend that goes to each civil society organisation type, along with the total value of civil society spend. Departments vary considerably in where their procurement is directed. The Department for Culture, Media and Sport and the Department for International Development direct over 90% of their civil society spend to charities, while the Department for Education and the Department for Business and Trade allocate over 70% to other nonprofit companies. The Department for Education’s civil society spend is substantially larger than any other department’s, reflecting the classification of schools, academies, and universities as nonprofit companies limited by guarantee; this figure therefore captures routine education funding rather than discretionary procurement from the voluntary sector. The Department for Work and Pensions stands out for relatively high CIC (6.8%) and co-operative/mutual (7.3%) shares compared with other departments.
Table 7: UK Government department procurement spend by CSO type
Proportion of each department’s total spend to civil society (%), plus total civil society spend (£M). Departments with at least £10 million total spend.
| Department | CIC | Charity | Co-operative / Mutual | Other CSO | Total CS Spend (£M) |
|---|---|---|---|---|---|
| Bank of England | 0.0% | 22.5% | 59.7% | 17.9% | £29 |
| Cabinet Office | 41.2% | 43.1% | 0.0% | 15.7% | £909 |
| Care Quality Commission | 0.0% | 98.7% | 0.0% | 1.3% | £24 |
| Crown Commercial Service | 0.1% | 14.3% | 0.8% | 84.8% | £298 |
| Department for Business & Trade | 0.3% | 25.6% | 0.5% | 73.6% | £3,209 |
| Department for Culture, Media & Sport | 2.3% | 95.1% | 0.1% | 2.5% | £6,172 |
| Department for Education | 3.1% | 24.5% | 0.6% | 71.8% | £96,458 |
| Department for Energy Security & Net Zero | 1.5% | 12.0% | 26.4% | 60.0% | £62 |
| Department for Environment, Food & Rural Affairs | 1.5% | 71.7% | 0.6% | 26.2% | £443 |
| Department for International Development | 0.1% | 92.9% | 0.0% | 7.0% | £4,956 |
| Department for International Trade | 0.1% | 5.4% | 0.0% | 94.4% | £119 |
| Department for Science, Innovation & Technology | 2.5% | 61.6% | 0.0% | 35.9% | £44 |
| Department for Transport | 4.7% | 18.7% | 1.4% | 75.2% | £5,414 |
| Department for Work & Pensions | 6.8% | 54.2% | 7.3% | 31.8% | £1,631 |
| Department of Health & Social Care | 2.6% | 82.0% | 0.0% | 15.4% | £11,453 |
| Driver & Vehicle Licensing Agency | 0.0% | 22.8% | 0.0% | 77.2% | £16 |
| Food Standards Agency | 0.4% | 11.9% | 17.8% | 69.9% | £24 |
| Foreign Office | 0.0% | 93.8% | 0.2% | 5.9% | £1,728 |
| Foreign, Commonwealth & Development Office | 0.0% | 77.8% | 0.0% | 22.2% | £550 |
| Forestry Commission England | 9.0% | 71.2% | 0.6% | 19.2% | £11 |
| HM Land Registry | 7.5% | 0.3% | 0.0% | 92.1% | £26 |
| HM Revenue & Customs | 0.0% | 8.7% | 0.2% | 91.0% | £199 |
| HM Treasury | 0.1% | 6.1% | 0.3% | 93.6% | £167 |
| Health Education England | 23.1% | 39.5% | 0.2% | 37.1% | £196 |
| Highways England | 0.0% | 94.8% | 0.0% | 5.2% | £39 |
| Home Office | 1.0% | 43.9% | 0.1% | 55.0% | £382 |
| Homes England | 0.0% | 95.4% | 3.2% | 1.4% | £42 |
| Medicines & Healthcare Products Regulatory Agency | 0.0% | 99.6% | 0.0% | 0.4% | £51 |
| Ministry of Defence | 0.7% | 66.3% | 14.0% | 19.0% | £1,163 |
| Ministry of Housing, Communities & Local Government | 12.5% | 68.2% | 1.6% | 17.7% | £2,240 |
| Ministry of Justice | 3.6% | 74.1% | 0.4% | 21.9% | £1,122 |
| Money & Pensions Service | 0.0% | 100.0% | 0.0% | 0.0% | £11 |
| NHS Blood & Transplant | 0.2% | 12.2% | 84.5% | 3.0% | £26 |
| Public Health England | 17.5% | 52.4% | 0.5% | 29.6% | £11 |
| Scotland Office | 1.8% | 88.0% | 0.9% | 9.3% | £31,295 |
| Skills Funding Agency | 14.0% | 45.5% | 0.0% | 40.5% | £44 |
| Transport for London | 25.8% | 54.7% | 17.3% | 2.2% | £102 |
| UK Health Security Agency | 0.0% | 1.8% | 0.0% | 98.2% | £192 |
| UK Research & Innovation | 19.1% | 39.7% | 5.9% | 35.3% | £26 |
| UK Shared Business Services | 6.5% | 36.0% | 2.4% | 55.1% | £66 |
Source: UK Civil Society Spine, Contracts Finder and procurement data.
Organisation size and procurement
Public procurement is dominated by large and major organisations. Among charities, those with annual incomes between £1m and £100m account for nearly two-thirds of all charity contracts (35.1% large, 28.0% major) and an even larger share of funding (27.6% and 41.8% respectively). Super-major charities (£100m+) win just 8.8% of contracts but capture 15.7% of total charity funding — confirming that the largest organisations tend to win higher-value contracts. Micro and small charities are almost entirely absent from procurement markets (4.2% and 3.4% respectively), whilst medium charities account for 20.4% of contracts.
Among CICs, the pattern is similar but shifted: large CICs (£1m–£10m) account for 33.1% of contracts and major CICs (£10m–£100m) account for 30.4%, together capturing nearly half of CIC funding (14.3% and 34.1% respectively). Medium-sized CICs (£100k–£1m) play a larger role than their charity counterparts, accounting for 15.0% of contracts and 29.9% of funding.
Figure 6: Organisation size and procurement
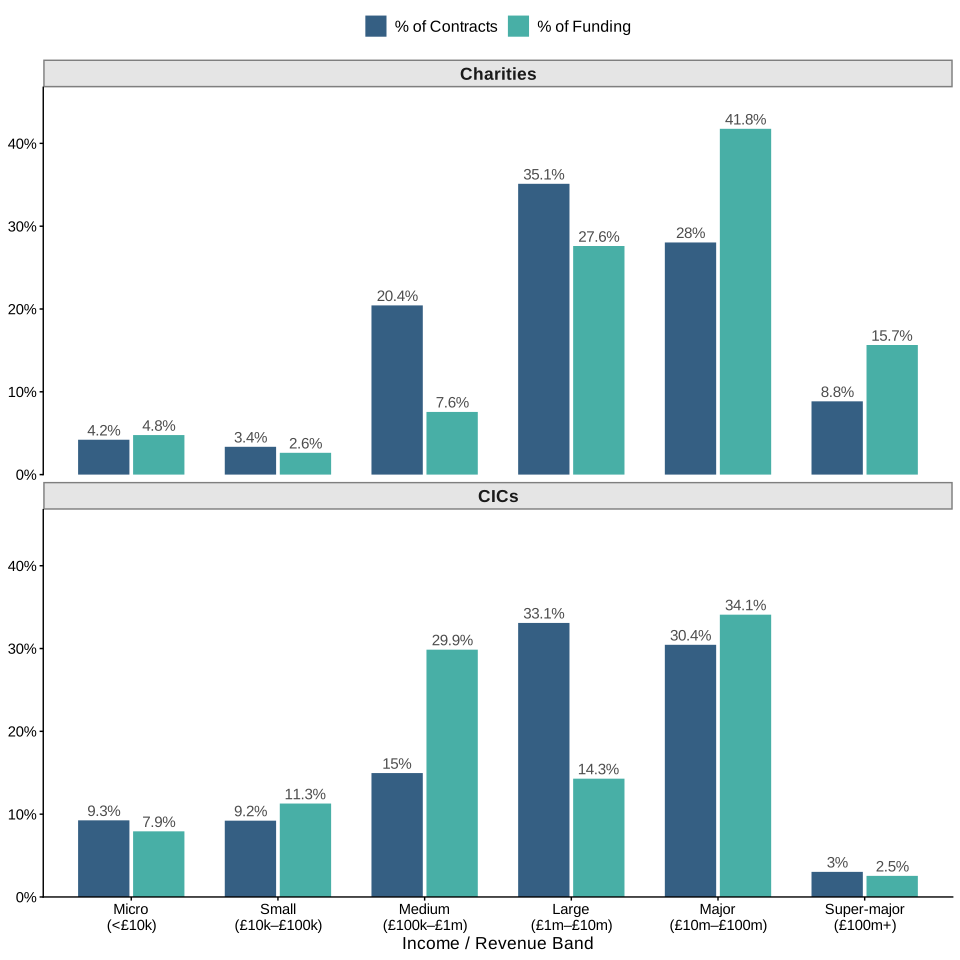
The bar chart shows the size of charities and CIC compared to their share of contracts and funding.
Share of contracts and funding by income/revenue band for charities
and CICs. Charity income data available for 11,086 of 12,429 charity
contracts (89.2%). CIC revenue data available for 15,015 of 21,370 CIC
contracts (70.3%).
Source: UK Civil Society Spine, Contracts Finder and
procurement data.
Use Cases and Future Work
The Data Spine supports a range of research and policy applications:
-
Sampling frame for national surveys — the deduplicated register provides the first comprehensive sampling frame that crosses legal form and organisation type within a single dataset. Researchers can draw stratified samples by organisational type, jurisdiction, geography (region, local authority), industrial classification (ICNPTSO or SIC code), and organisational age. Registration and removal dates allow the population to be defined at any point in time, supporting both cross-sectional and longitudinal designs. Linked financial data enables size-stratified sampling, which is critical given the extreme right-skew of the income distribution where a simple random sample would overwhelmingly draw micro-organisations. The procurement linkage allows researchers to sample specifically from government suppliers or construct matched comparison groups. The spine’s auxiliary variables also support survey weighting: design weights for unequal selection probabilities, non-response adjustments using characteristics available for both respondents and non-respondents, and calibration to known population margins by type, region, or income band. The spine excludes unregistered groups and informal associations, and coverage varies by jurisdiction, but it represents the most comprehensive openly available listing of UK civil society organisations. See more detailed guidance on developing the sampling frame here.
-
Local ecosystem analysis — by linking organisation data to Local Authority characteristics (population, rural-urban classification, indices of deprivation), the Spine enables analysis of how civil society provision varies across different types of communities. There are a number of excellent local-area measures and frameworks (e.g., the Community Needs Index, Empowering Places) that would be enhanced by incorporating the CSO Spine. In addition, local authorities themselves are important sources of funding for CSOs: these contract and spending registers could be linked to the Spine to generate even more detailed understandings of the integration of CSOs in public procurement markets.
-
Organisational lifecycles — the combination of registration dates, removal dates, and financial records enables tracking of organisational lifecycles, from incorporation through growth, decline, and dissolution. The Spine enhances these types of analyses by linking multiple records for the same organisation, distinguishing between the entity was first created and when it first received charitable status for example. Similarly, the Spine allows exact identification of when an organisation ceased operating as a charity and when it dissolved as a legal entity. The Spine also allows tracking of financial trajectories over time, subsector and place.
-
Civil Society Demography — leveraging all of the above, it is now possible to develop a comprehensive statistical bulletin — akin to the ONS’ Business Demography publication — measuring the civil society landscape. Mirroring its business sector contemporaries, the Civil Society Statistical Bulletin would show survival rates for different organisational forms and industry subsectors, and identify and track high-growth organisations over time. Such a statistical bulletin would support timeous and evidence-based policy.
Construction of the Civil Society Data Spine
The Data Spine is constructed by bringing together administrative data from ten UK regulatory bodies. Each organisation receives a unique identifier (UID) that enables records to be linked across data sources.
Data sources
The ten source registers are:
- Charity Commission for England and Wales (CCEW) — maintains open data on registered charitable organisations including names, addresses, registration dates, and removal dates
- Office of the Scottish Charity Regulator (OSCR) — the Scottish equivalent regulatory body maintaining records of registered charities in Scotland
- Charity Commission for Northern Ireland (CCNI) — maintains the charity register for Northern Ireland
- Companies House — the UK registry of registered companies, filtered for third-sector relevant categories including charities, community interest companies, and societies
- Co-operatives UK — provides open data on registered co-operative organisations operating in the UK
- Mutuals Public Register (FCA) — the Financial Conduct Authority’s registry of mutual organisations
- Care Quality Commission (CQC) — transparency data on care service providers in England
- Care Inspectorate Scotland (CIS) — data on care services in Scotland
- Scottish Housing Regulator (SHR) — statistical information on social housing providers in Scotland
- Social Housing England (SHPE) — registry of registered social housing providers in England
Deduplication and matching
Organisations frequently appear in more than one register. For example, a charity may be registered with both the Charity Commission and Companies House. The Data Spine uses a matching algorithm to identify these duplicates, assigning a single UID to each unique organisation.
The matching process produced 125,624 cross-register links stored in the
matches file (TSCS_spine.matches.csv). Match types include company ID
matching (linking charity register numbers to Companies House numbers),
fuzzy text matching on organisation names and addresses, OSCR-specific
matching, and sector-specific matching strategies.
Further details of the construction methodology are available in the Spine Builder documentation and the project’s GitHub repository.
Contents of the Civil Society Data Spine
The Data Spine comprises six linked datasets, all accessible through the data resources page. The core data are distributed across four files:
-
TSCS_spine.spine.csv(770,923 records) — the deduplicated organisation register -
TSCS_spine.matches.csv(125,624 records) — cross-register links between duplicate records -
TSCS_spine.SIC_codes.csv(668,280 records) — Standard Industrial Classification codes from Companies House -
TSCS_spine.supplementary.csv(872,101 records) — additional address and registration records from source registers
Organisation Register
A deduplicated register of all formally registered UK civil society organisations, including:
- unique identifier
- organisation name
- registered address and postcode
- registration and removal dates
- source register(s)
- whether the organisation is a Community Interest Company
The current release contains records for 770,923 organisations.
Charity Financial Records
Longitudinal financial records for registered charities, including total income, total expenditure, and detailed breakdowns (donations, trading, charitable activities, investments, legacies). Coverage:
| Jurisdiction | Years available | Observations |
|---|---|---|
| England and Wales (CCEW) | 2000 to 2025 | ~3.6 million |
| Scotland (OSCR) | 2006 to 2025 | ~390,000 |
| Northern Ireland (CCNI) | 2015 to 2026 | ~38,000 |
Nonprofit Financial Records
Financial data for Community Interest Companies and other nonprofit companies from Companies House XBRL filings and PDF accounts. Includes balance sheet items, profit and loss accounts, employee numbers, and CIC community interest reports. The dataset contains approximately 1.88 million organisation-year observations covering 212,000 organisations. Coverage:
| Organisation type | Years available | Organisations | Observations |
|---|---|---|---|
| Community Interest Companies | 1989 to 2025 | ~41,000 | ~189,000 |
| Other nonprofit companies | 1981 to 2025 | ~147,000 | ~1.42 million |
| Charitable companies | 2005 to 2025 | ~24,000 | ~256,000 |
| Co-operatives and Mutuals | 2006 to 2025 | ~900 | ~10,000 |
Procurement Records
Records of public procurement contracts and grants awarded to civil society organisations, drawn from central government, the NHS, local authorities, and other public sector bodies. The dataset contains 948,051 transactions involving 11,295 civil society organisations.
CIC 36 Forms
Descriptions of beneficiaries, activities, community benefit statements, and use of surplus extracted from the incorporation documents of Community Interest Companies. The dataset contains 146,019 records covering 62,088 CICs registered between 2005 and 2025.
CIC Board of Directors
Board member records for Community Interest Companies drawn from Companies House officer filings. The dataset contains 230,943 records covering 207,807 individuals across 58,462 CICs, including appointment and resignation dates, officer roles, and nationality.
The Data Spine is not a static resource. All code and data are openly available and the datasets are updated as new regulatory data become available. For further information, contact research\@brawdata.com.
Scottish Charity Regulator [CCNI]: Charity Commission for Northern Ireland [CIC]: Community Interest Company [CICs]: Community Interest Companies [ICNPTSO]: International Classification of Non-Profit and Third Sector Organisations [CPI]: Consumer Price Index [ONS]: Office for National Statistics [ESRC]: Economic and Social Research Council [DCMS]: Department for Culture, Media and Sport [UID]: Unique Identifier [FCA]: Financial Conduct Authority [CQC]: Care Quality Commission [NHS]: National Health Service [XBRL]: eXtensible Business Reporting Language [SIC]: Standard Industrial Classification [NCVO]: National Council for Voluntary Organisations [CSO]: Civil Society Organisation [ARG]: Annual Relative Growth Rate [UKCAT]: UK Charity Activity Tags