Maintained schools and academies inspections and outcomes as at 31 August 2017: main findings
Updated 3 April 2018

© Crown copyright 2018
This publication is licensed under the terms of the Open Government Licence v3.0 except where otherwise stated. To view this licence, visit nationalarchives.gov.uk/doc/open-government-licence/version/3 or write to the Information Policy Team, The National Archives, Kew, London TW9 4DU, or email: psi@nationalarchives.gov.uk.
Where we have identified any third party copyright information you will need to obtain permission from the copyright holders concerned.
This publication is available at https://www.gov.uk/government/statistics/maintained-schools-and-academies-inspections-and-outcomes-as-at-31-august-2017/maintained-schools-and-academies-inspections-and-outcomes-as-at-31-august-2017-main-findings
This release contains:
- most recent inspections and outcomes as at 31 August 2017
- provisional data for inspections completed between 1 April 2017 and 31 August 2017
- revised data for inspections completed between 1 September 2016 and 31 March 2017
The proportion of good or outstanding schools has increased for secondary schools, special schools and pupil referral units this year.
Overall the proportion of good or outstanding schools has remained unchanged since 31 August 2016 at 89%, but has increased for:
- pupil referral units - 88% good or outstanding, an increase from 86%
- secondary schools - 79%, a small increase from 78%
- special schools - 94%, a small increase from 93%
Figure 1: Overall effectiveness of maintained schools and academies at their most recent inspection, 31 August 2017

89% of all schools are good or outstanding: 99% of nursery schools, 90% of primary, 79% of secondary; 94% of special and 88% of pupil referral units
Schools that require improvement that do not improve to good or outstanding commonly have higher proportions of deprived pupils.
Fifty-five per cent of the schools which currently require improvement have high proportions of pupils from deprived areas. Of schools inspected this year that had previously been judged to require improvement, those with high proportions of pupils from deprived areas were less likely to improve than those with pupils from more affluent areas.
1. Inspections between 1 September 2016 and 31 August 2017
Between September 2016 and August 2017 we carried out 5,434 full or short inspections of state-funded schools, where the reports were published by 30 September 2017. These consisted of 2,613 short inspections that didn’t convert to full inspections, 1,064 short inspections which did convert, and a further 1,757 section 5 inspections. The section 5 inspections include section 8 inspections deemed section 5 inspections.
Seventy-five per cent of schools were judged good or outstanding this year. The proportion is higher for schools with younger pupils: 98% for nursery schools and 78% for primary schools, compared with 62% for secondary schools. A higher proportion of secondary schools were judged to be inadequate: 13% compared with 4% of primary schools and 1% of nursery schools.
Figure 2: Overall effectiveness of schools inspected between September 2016 and August 2017, by phase (includes most recent outcome for short inspections which did not convert) [footnote 1]
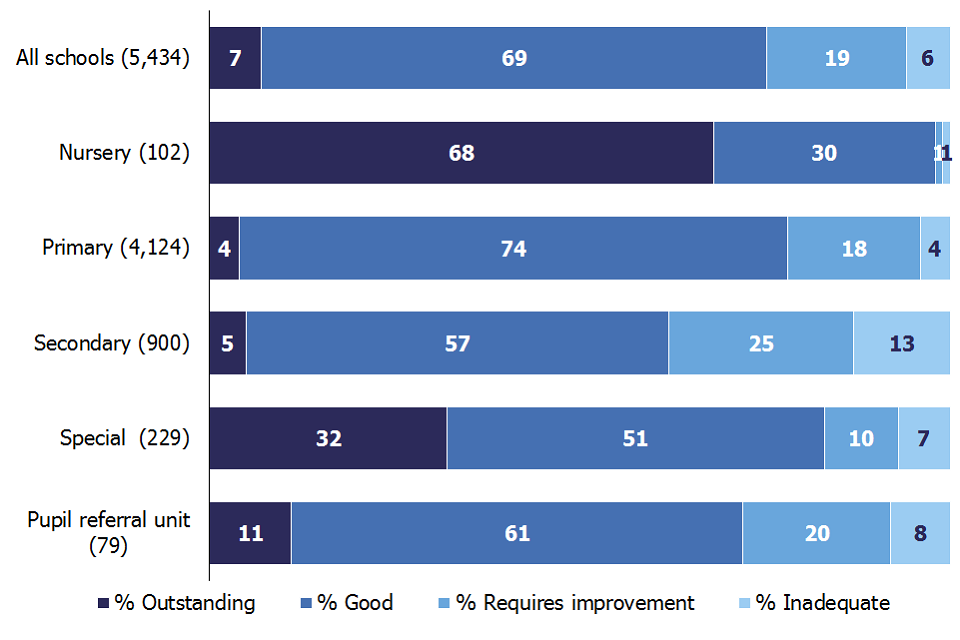
75% of all schools inspected this year are good or outstanding: 98% of nursery, 78% of primary, 62% of secondary, 83% of special and 72% of pupil referral units
Of all 5,434 inspections, 3,872 were inspections of schools that were good or outstanding at their previous inspection. Of these, 3,677 were short inspections, 29% of which converted to full inspections. Conversion rates were higher for secondary schools than primary schools: 38% compared with 28%.
Figure 3: Overall effectiveness of schools inspected between September 2016 and August 2017, by previous inspection outcome (includes most recent outcome for short inspections which did not convert)
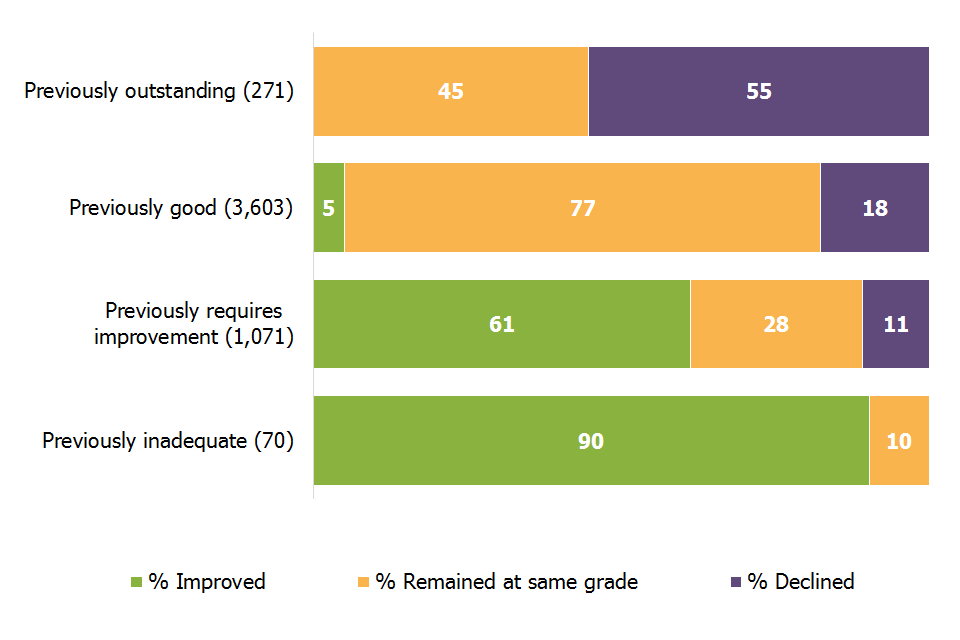
90% of previously inadequate schools improved
2. Schools at their most recent inspection
At the end of August 2017, 89% of schools were judged to be good or outstanding at their most recent inspection: the same proportion as at the end of the previous year. Grades remain higher for primary schools (90% good or outstanding) than for secondary schools (79% good or outstanding).
Figure 4: Overall effectiveness of maintained schools and academies at their most recent inspection, 31 August 2017[footnote 2]
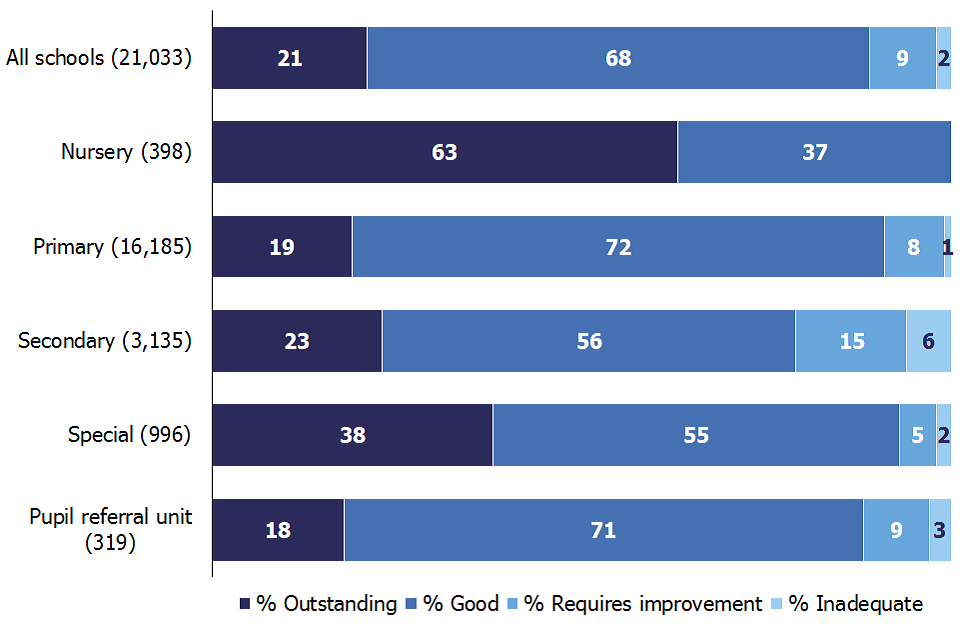
89% of all schools are good or outstanding: 99% of nursery, 90% of primary, 79% of secondary; 94% of special and 88% of pupil referral units
For some types of education there have been small changes to the proportion of schools judged good or outstanding at their most recent inspection, when compared with August 2016:
- pupil referral units - 88% good or outstanding, an increase from 86% in 2016
- secondary schools - 79%, a small increase from 78%
- special schools - 94%, a small increase from 93%
- nursery schools - 99% a small decrease from 100%[footnote 3]
The proportion of primary schools that are good or outstanding has remained at 90%.
Between September 2016 and August 2017, around 1,200 schools closed, and 94% of these schools have then re-opened as academies. As schools close and re-open they can lose their inspection history, and this can affect the national proportions of overall effectiveness grades. There are 916 open schools with no inspection grade. Fifteen per cent are new free schools, university technical colleges and studio schools. Seventy-eight per cent are sponsor-led academies which have not been inspected since they became an academy.
There are 578 schools that do not have an inspection grade, but that had a single predecessor school which had been inspected. Eighty-five per cent of these schools were judged inadequate or to require improvement when they were last inspected. We are currently consulting on changing our statistical methodology to include the most recent inspections of these predecessor schools in our official statistics, to create a more complete view of the sector. These changes will not affect the timing of the first inspections of the academies that replaced the previous schools.
3. Schools that require improvement
At the end of August 2017, 9% of schools were judged to require improvement at their most recent inspection. This is a marked improvement from August 2012, when 28% of schools were ‘satisfactory’. However the current position is very similar to the position at the end of August 2016, when 10% of schools were judged to require improvement.
There are now 1,883 schools which were judged to require improvement at their most recent inspection. Seven hundred and fifteen (38%) of these schools were also judged to require improvement or to be satisfactory at their previous inspection.
Many schools do improve from requires improvement to good, or even to outstanding each year. However a lower proportion of schools previously judged to require improvement improved at their inspection this year than in any other year. This trend is seen for both primary schools (33% did not improve this year) and secondary schools (58% did not improve). A higher proportion of schools also declined to inadequate this year (11% declined).
Figure 5: Outcomes of inspections of schools that previously required improvement, 2013 to 2017
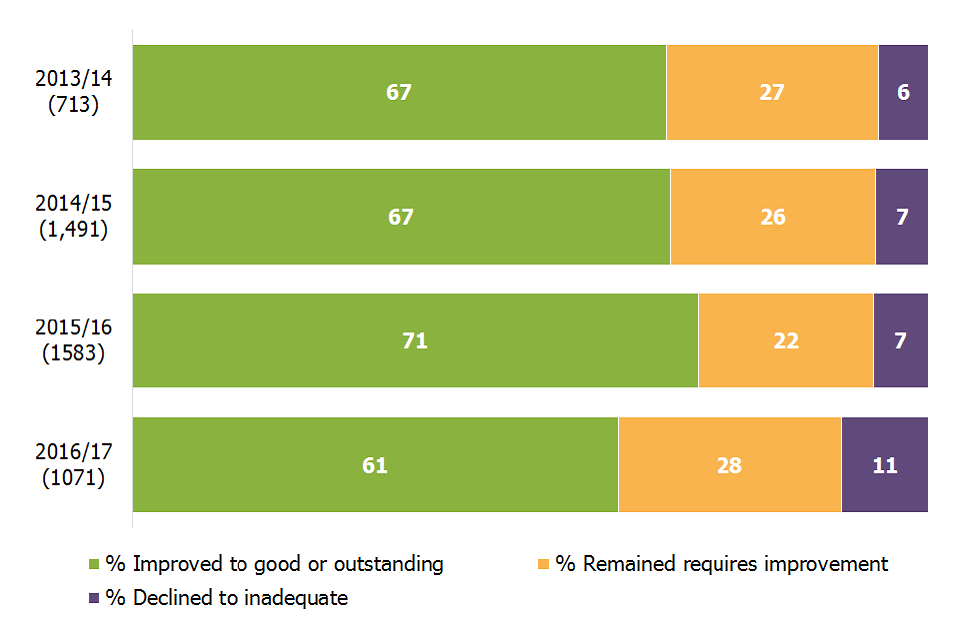
61% of schools judged to require improvement at their previous inspection improved to good or outstanding at inspections between September 2016 and August 2017, compared to 71% in the previous year
3.1 Deprivation
A common factor in the schools that do not improve to good or outstanding is that they have a higher proportion of deprived pupils. Fifty-five per cent of the schools that currently require improvement have high proportions of pupils from deprived areas[footnote 4]. Out of the schools that had previously required improvement and had an inspection this year, those schools with high proportions of pupils from deprived areas were less likely to improve than those with pupils from more affluent areas.
When inspectors judge the effectiveness of the leadership and management in a school they take account of the challenges faced by leaders of schools with high proportions of disadvantaged pupils. Out of the primary schools judged to require improvement for overall effectiveness at their most recent inspection, 23% of those with the most deprived intakes were judged good for leadership and management, compared with 8% with the least deprived intakes. However, inspectors will not judge the quality of education to be better than it is, regardless of the socio-economic circumstances of the school.
Figure 6: Leadership and management grades of primary schools judged to require improvement for overall effectiveness at their most recent inspection, by level of deprivation, 31 August 2017
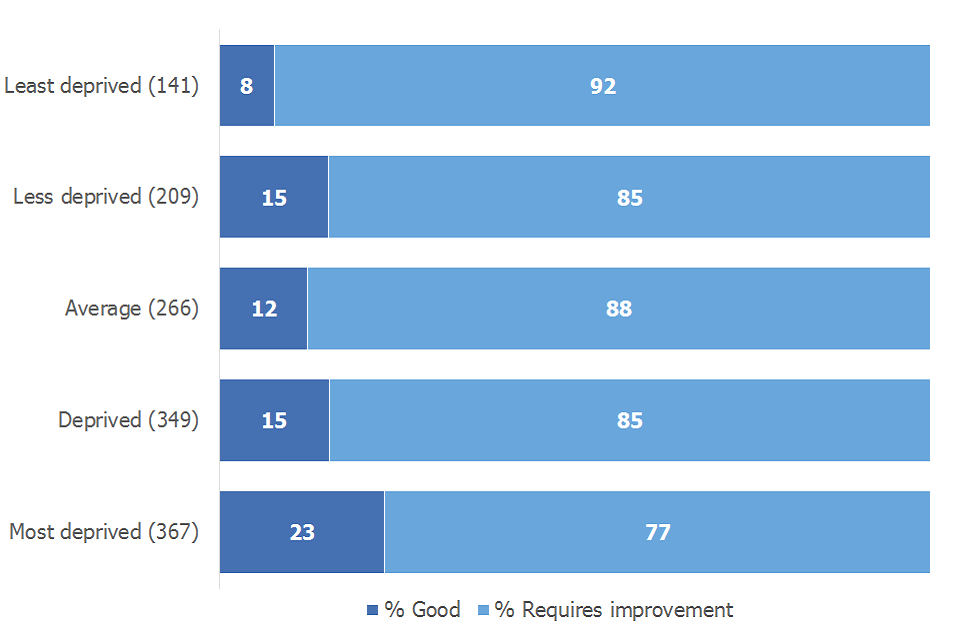
Schools judged to require imrovement for overall effectivess were all judged good or to require improvement for leadership and management. More were judged good in the most deprived areas than the least; 23% compared to 8%
3.2 Schools that have been less than good for a long time
Some of the schools that did not improve from requires improvement to good or outstanding this year have performed poorly for a long time. Out of the 243 inspections of secondary schools that required improvement, 140 did not improve. Out of these 140 over a third (52) have been judged satisfactory, to require improvement or to be inadequate in every inspection they have had since 2005[footnote 5]. Some of these schools have become academies since 2005, but still have not improved to good or outstanding. Thirty-seven of the 52 schools are currently academies, and 29 of these academies are in multi-academy trusts.
4. Good schools
Between September 2016 and August 2017 we carried out 3,538 short inspections of schools judged to be good at their previous inspection. Overall 83% of schools remained good or improved to outstanding. Some schools remained good through a short inspection that did not convert. In other cases, the inspection did convert but the extra evidence gathered then confirmed the previous good judgement.
Primary schools were more likely to retain their good grade or improve to outstanding than secondary schools. Eighty-four per cent of primary schools stayed good or improved to outstanding compared with 77% of secondary schools. See Figure 7.
Figure 7: Outcomes of short inspections of previously good schools, between September 2016 and August 2017
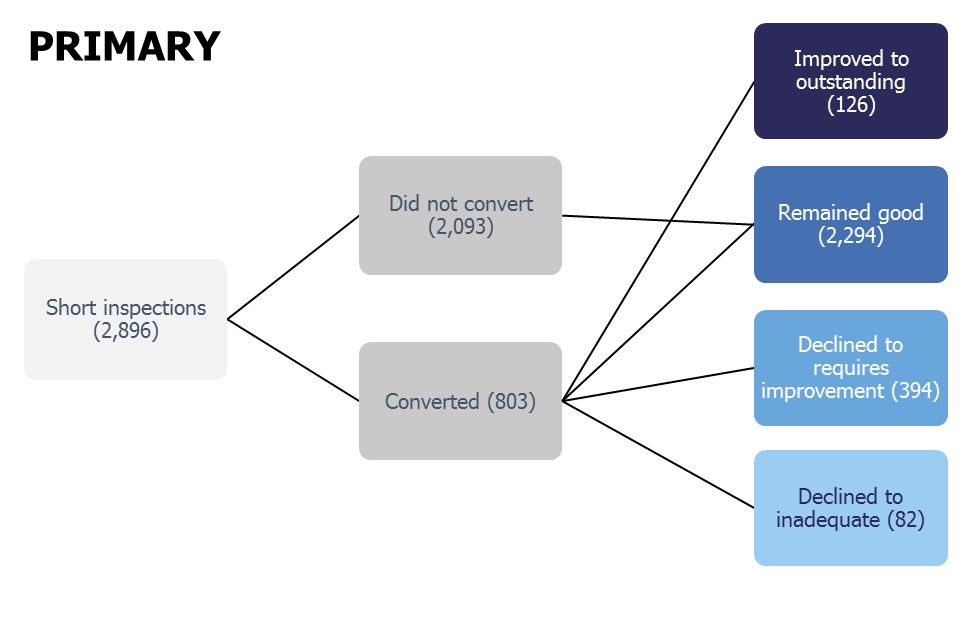
There were 2,896 short inspections of primary schools, of which 803 converted to full inspections. In all, 2,294 schools remained good, 126 improved to outstanding, 394 declined to requires improvement and 82 to inadequate
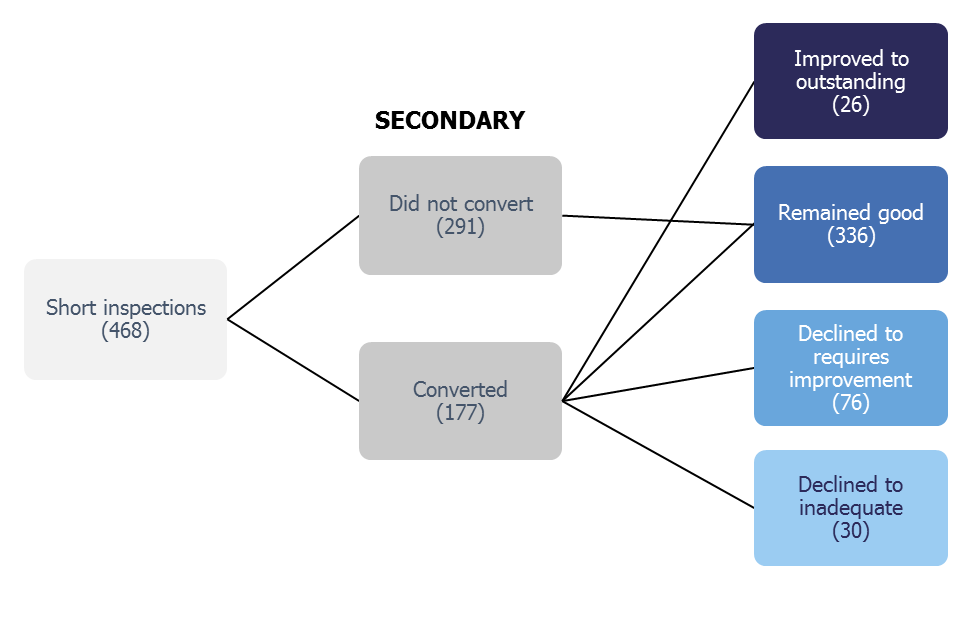
There were 468 short inspections of secondary schools, of which 177 converted to full inspections. In all, 336 schools remained good, 26 improved to outstanding, 76 declined to requires improvement and 30 to inadequate
5. Outstanding schools
Twenty-one per cent of schools were judged to be outstanding at their most recent inspection. A slightly higher proportion of secondary schools than primary schools are outstanding (23% compared with 19%).
As part of the 2011 Education Act, the government made outstanding primary and secondary schools exempt from routine inspections. Since then, Ofsted has been unable to carry out regular inspections of these schools. As a result, 8% of outstanding primary and secondary schools were last inspected as long ago as the 2006 to 2007 academic year. However, 59% of outstanding primary and secondary schools have been inspected within the last 6 academic years.
Figure 8: Outstanding primary and secondary schools by the academic year of their most recent full inspection
| Number of all outstanding schools | Percentage of all outstanding schools | ||||||
|---|---|---|---|---|---|---|---|
| Last inspected in | Primary and secondary | Primary | Secondary | Primary and secondary | Primary | Secondary | |
| All | 3791 | 3062 | 729 | 100 | 100 | 100 | |
| 2016 to 2017 | 203 | 161 | 42 | 5 | 5 | 6 | |
| 2015 to 2016 | 189 | 154 | 35 | 5 | 5 | 5 | |
| 2014 to 2015 | 406 | 329 | 77 | 11 | 11 | 11 | |
| 2013 to 2014 | 416 | 307 | 109 | 11 | 10 | 15 | |
| 2012 to 2013 | 531 | 402 | 129 | 14 | 13 | 18 | |
| 2011 to 2012 | 480 | 380 | 100 | 13 | 12 | 14 | |
| 2010 to 2011 | 207 | 173 | 34 | 5 | 6 | 5 | |
| 2009 to 2010 | 198 | 181 | 17 | 5 | 6 | 2 | |
| 2008 to 2009 | 474 | 396 | 78 | 13 | 13 | 11 | |
| 2007 to 2008 | 391 | 329 | 62 | 10 | 11 | 9 | |
| 2006 to 2007 | 296 | 250 | 46 | 8 | 8 | 6 |
Ofsted is still able to inspect outstanding primary and secondary schools if their performance gives cause for concern. We have inspected 141 of these schools this year. Where the inspection became a full inspection, only 2 schools kept their outstanding grade, 63 declined to good, 43 declined to requires improvement and 19 to inadequate. The remaining 14 schools did not have a full inspection and remained outstanding. Overall 89% of the schools declined from their previous outstanding grade. However this is not surprising because most of the exempt schools inspected were those whose performance appeared to be declining[footnote 6].
6. Inadequate schools
Two per cent of schools were judged to be inadequate at their most recent inspection. Forty-three per cent of these schools are academies and 57% are maintained by local authorities.
A larger proportion of inspected sponsor-led academies are inadequate than any other type of school: 9% compared with 4% of free schools, 1% of academy converters and 2% of LA maintained schools. The inspection grades for sponsor-led academies are based on inspections since the schools became academies, and do not include the grade of the predecessor LA school. However, many sponsor-led academies will have replaced a predecessor school that was inadequate or required improvement at its last inspection.
Figure 9: Percentage of inadequate schools by type of education
| Total number of schools | Number inspected | Percentage inspected | Number inadequate | Percentage inadequate (of those inspected) | |
|---|---|---|---|---|---|
| All types of education | 21,949 | 21,033 | 96 | 422 | 2 |
| Local authority maintained | 15,010 | 14,980 | 100 | 239 | 2 |
| All academies, of which - | 6,939 | 6,053 | 87 | 183 | 3 |
| Academy converter | 4,634 | 4,596 | 99 | 68 | 1 |
| Sponsor-led academy | 1,977 | 1,229 | 62 | 106 | 9 |
| Free school | 328 | 228 | 70 | 9 | 4 |
7. Revisions to previous release
Provisional data indicated that there were 1,612 section 5 inspections between 1 September 2016 and 31 March 2017, as published by 30 April 2017. Revised data shows that an additional 221 inspections took place where the report was published too late for inclusion in the provisional data, but was published by 30 September 2017. Four were inspections of nursery schools, 158 were primary schools, 44 were secondary schools, 11 were special schools and 4 were pupil referral units.
Fifty-three of these 221 additional inspections resulted in an inadequate judgement. Inspections leading to an inadequate judgement undergo additional moderation and are sometimes published later than reports for schools with other overall effectiveness grades. See the methodology and quality report for more details.
In some instances the addition of these inspection outcomes changes the pattern seen in inspections between 1 September 2016 and 31 March 2017.
The percentage of schools judged good or outstanding between 1 September 2016 and 31 March 2017 has remained at 49% in both the provisional data and final data.
The percentage of schools judged inadequate between 1 September 2016 and 31 March 2017 increased as follows:
- from 13% to 14% overall
- from 10% to 11% for primary schools
- from 21% to 22% for secondary schools
- from 6% to 14% for pupil referral units
Further details can be found in the revised table 2 of the charts and tables Excel document accompanying this release.
8. Consultation on changes to statistical methodology
Ofsted is currently consulting on proposed changes to the way we compile data on schools’ most recent inspections. The consultation closes on 19 January 2018 and users are encouraged to read and respond to the consultation.
9. Ofsted’s Annual Report
Findings from our forthcoming Annual Report will be published on 13 December 2017.
10. Notes
Data in this release is from inspections undertaken between 1 September 2016 and 31 August 2017 and most recent inspections of open schools at 31 August 2017, where the inspection report was published by 30 September 2017. If an inspection report is not published by 30 September 2017 then the previous inspection, where available, will be reported as a school’s most recent inspection.
Inspections are conducted under sections 5 and 8 of the Education Act 2005. Under exceptional circumstances Ofsted may withhold publication of an inspection report.
An explanation of the key uses of this data and further contextual information and the arrangements for quality assurance is provided in the accompanying methodology and quality report. This report also provides information about strengths and limitations of the statistics.
11. Glossary
11.1 Academies
Academies are publicly funded independent schools. Academies do not have to follow the national curriculum and can set their own term times. They still have to follow the same rules on admissions, special educational needs and exclusions as other state schools.
Academies get money directly from the government, not the local authority. They are run by an academy trust, which employs the staff. Some academies have sponsors such as businesses, universities, other schools, faith groups or voluntary groups. Sponsors are responsible for improving the performance of their schools.
Academies include converter and sponsor-led academies, free schools, university technical colleges and studio schools.
11.2 Academy converters
Academy converters are schools which have opted to become an academy, most of which were good or outstanding local authority maintained schools before they became an academy.
Academy converters retain their latest inspection grade, even if the most recent inspection was of the predecessor school.
11.3 Sponsor-led academies
Sponsor-led academies are academies which have sponsors such as businesses, universities, other schools, faith groups or voluntary groups. Sponsors are responsible for improving the performance of their schools.
Sponsor-led academies are viewed as new legal entities and do not retain their inspection history.
11.4 Free schools
Free schools are funded by the government but are not run by the local authority. They are set up on a not-for-profit basis by charities, universities, and community and faith groups, among others.
Free schools are ‘all-ability’ schools, so cannot use academic selection processes like a grammar school. They can set their own pay and conditions for staff and change the length of school terms and the school day. Free schools do not have to follow the national curriculum.
11.5 Local authority maintained schools
Maintained schools are funded by the government and run by the local authority. They must follow the national curriculum.
11.6 Short inspections
All good schools now receive short inspections, as do outstanding nursery, pupil referral units and special schools. Short inspections are a one day inspection visit and take place approximately every 3 years. A short inspection determines whether the school continues to provide the same good or outstanding standard of education for pupils. A short inspection does not result in individual graded judgements nor does it change the overall effectiveness grade of the school. If the inspection is converted to a full inspection then inspectors will make the full set of graded judgements required under section 5.
12. Further information
12.1 Contact for comments or feedback
If you have any comments or feedback on this publication, please contact Louise Butler on 03000 131 457 or Louise.Butler@ofsted.gov.uk.
12.2 Acknowledgements
Thanks to the following for their contribution to this statistical release: John Willman, James Jordan, Issa Mohamed and Chris Foley.
-
Short inspections which did not convert confirm the grade of the previous inspection. Those outcomes are included here and will always be good or outstanding. ↩
-
The proportion of schools which are good or outstanding is calculated using unrounded data, so sometimes differs slightly from the sum of the % good and % outstanding shown individually. ↩
-
Although there is a change in the rounded numbers the change is less than 1 percentage point, and is driven by changes in a small number of nursery schools. In August 2016, 399 schools were good or outstanding out of 400 schools that had been inspected. In August 2017 396 schools were good or outstanding out of 398 schools that had been inspected. ↩
-
Based on the Indices of Multiple Deprivation (IDACI) 2015. Each school is assigned a score based on the home post codes of the pupils that attend the school. The schools are then placed into 1 of 5 deprivation bands. Forty per cent of all schools are in the most deprived 2 bands, whereas 55% of schools that require improvement are in these 2 bands. ↩
-
Section 5 inspections were introduced in September 2005. Before this schools were inspected under section 10, which is not comparable. All 52 schools have had between 4 and 6 inspections under section 5. Some schools declined to inadequate at their inspection this year. ↩
-
Most inspections of exempt schools are carried out because the school’s performance is declining. However some are also due to complaints received by Ofsted about the school, or because the make-up of the school has substantially changed since it was judged to be outstanding (for instance it has taken on another key stage or amalgamated with another school). ↩