GB Longer Semi-Trailer trial: 2018 Annual Report summary
Published 2 March 2020

© Crown copyright 2020
This publication is licensed under the terms of the Open Government Licence v3.0 except where otherwise stated. To view this licence, visit nationalarchives.gov.uk/doc/open-government-licence/version/3 or write to the Information Policy Team, The National Archives, Kew, London TW9 4DU, or email: psi@nationalarchives.gov.uk.
Where we have identified any third party copyright information you will need to obtain permission from the copyright holders concerned.
This publication is available at https://www.gov.uk/government/publications/longer-semi-trailer-trial-evaluation-annual-report-2018/gb-longer-semi-trailer-trial-2018-annual-report-summary
Tractor unit and longer semi-trailer in TNT livery
Professor David Cebon, University of Cambridge, Director for Sustainable Road Freight in Logistics Report 2017, Freight Transport Association:
Making substantial inroads to the decarbonisation of road freight requires innovation in both vehicle performance and logistics…the single most effective change in the short term is use of higher capacity vehicles.
What is a Longer Semi-Trailer?
Longer Semi-Trailers, or LSTs, are a new type of heavy goods vehicle (HGV) trailer that have been on trial since 2012. The LSTs are up to 2.05 metres longer than the current standard semi-trailers on our roads (15.65 metres instead of 13.6 metres). These are not the mega trailers or road-trains permitted in some other countries.
While the trailers are longer than existing HGV trailers, they cannot be heavier. The total weight of the trailer, the goods and the tractor unit must still be within the UK domestic weight limit of 44 tonnes. They must also pass the turning circle test applied to the existing 13.6 metre trailers. To achieve this, LSTs usually have a steering rear axle.
This document summarises the latest findings from the trial of a new type of heavy goods vehicle trailer – the longer semi-trailer. The full results can be found in the 2018 Annual Report produced by the independent trial evaluators (Risk Solutions) for the Department for Transport (DfT).
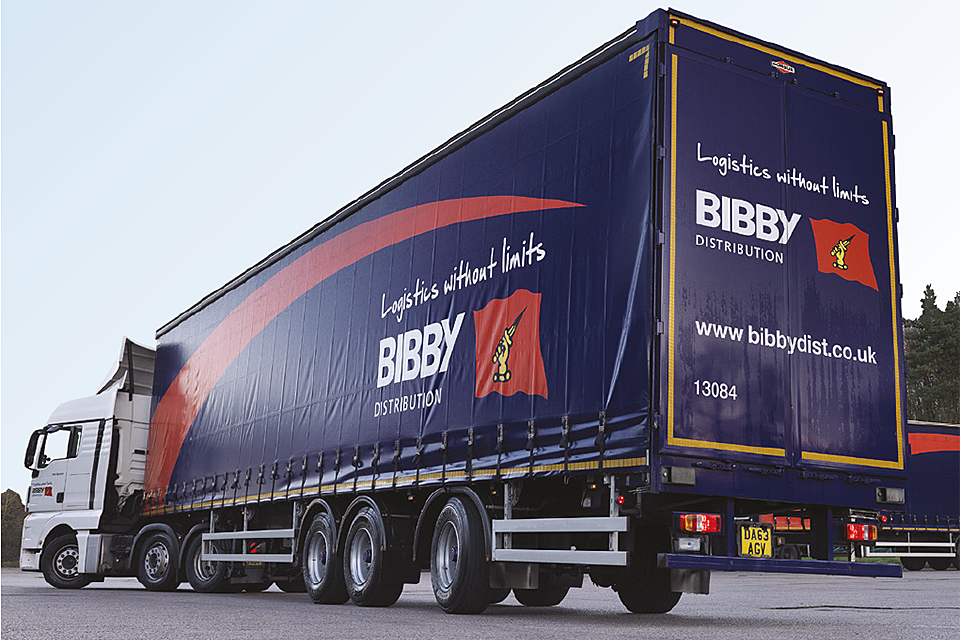
Tractor unit with longer semi-trailer in Bibby haulage livery
Why use LSTs?
By making the trailer 2 metres longer, you can carry two more rows of pallets or three more rows of goods cages on each journey compared with existing trailers.
Fully loaded LSTs can move goods using fewer journeys than current trailers, reducing overall emissions, congestion and collision risk.
This differs from other approaches to freight carbon reduction, such as increasing engine efficiency or electric vehicles, in being available without the need for further significant technological and infrastructure development.
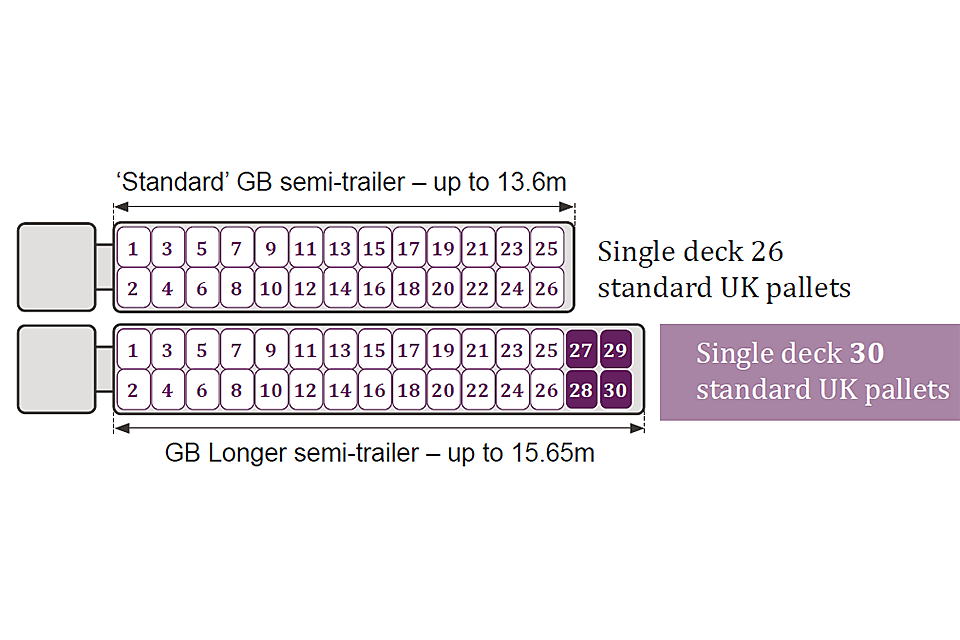
Image comparison of standard and longer semi-trailers
Why is there a trial? Why not just allow the trailers now?
- What do operators use LSTs for, and where?
- What are the savings realised in HGV journeys?
- What are the resulting reductions in emissions?
- What about safety - will LSTs cause more injuries?
- What about damage and the associated costs - will LSTs cause more damage to the roads?
- Might any special operational requirements be appropriate for LSTs?
- What proportion of the existing GB fleet of semi-trailers might be replaced by LSTs, were numbers not restricted?
DfT needs to take all these factors into account in deciding whether to allow LSTs for general use on GB roads when the trial ends. This document updates the similar summary published last year. It describes the trial and explains how far it has got towards answering each of these questions.
What does the trial involve?
DfT began the trial in January 2012, when it established an initial allocation of 1,800 trailers for operators wishing to take part, with an initial trial period of 10 years.
In April 2017, the government increased the number of LSTs by an additional 1,000 and decided to extend the trial by 5 years.
All participants must submit detailed data about the journeys their LSTs make and on all incidents (not just those resulting in injury) on the public road or in public areas (such as services).
Operators participate voluntarily, at their own cost and risk. As this is a trial, there is no guarantee that LSTs will be permitted on the road beyond the end of the trial period. The trial was set to run for a long period to ensure it generated enough data to answer the questions above and to allow participants to recover the costs of investing in LSTs.
Who can participate in the trial?
Any licensed GB haulier is eligible to apply to join the trial and DfT’s aim has been to include a mix of large and small operators.
Companies sign an ‘Operator Undertaking’ which sets out the terms of the trial, including the requirement to provide data to the evaluation. They also need a Vehicle Special Order (VSO) granted by the Vehicle Certification Authority (VCA).
VSOs can be revoked or suspended by VCA for any serious failure to comply with the operator undertaking. Operating an LST without a valid VSO is illegal.
Who is evaluating the information from the trial?
The trial evidence could not be evaluated by DfT or by the industry – there needed to be an independent party to both hold the commercially sensitive data and conduct a fair evaluation of the evidence. Risk Solutions has fulfilled this role for the trial since it began in 2012 and we now hold data on over 4.7 million LST journeys to the end of 2018.
Although commissioned by DfT, our role is to provide independent scrutiny of the evidence. We also, on occasion, provide comment on DfT’s public statements regarding the trial, to ensure they are accurate and are supported by the evidence.
We produce a report of the latest observations and results for each calendar year of the trial.
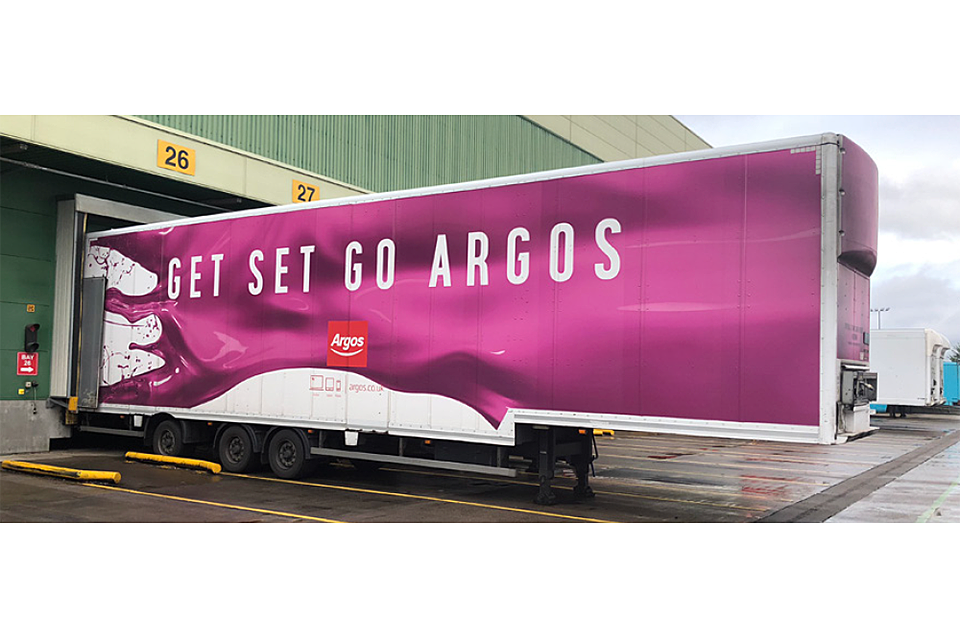
Longer semi-trailer in Argos at a loading dock
How is the data gathered?
Detailed information on trailers operated, journeys and incidents is submitted for every trailer in Excel templates every four months. This has been a comprehensive and longrunning data collection process, as it has been important for DfT to ensure that any new equipment introduced has demonstrable and evidence-based benefits.
Is self-reporting by the operators reliable?
Yes, with active engagement with operators, and expert support, self-reporting works extremely well and is producing good quality data.
Self-reporting is sensible here because of the duration of the trial, the number of operators involved and the complex mix of data types we need. This would make independent data collection prohibitively expensive. In any case, operators must be closely involved to ensure that the data is of the high quality we need to answer the seven questions listed earlier.
A robust approach to collecting self-reported data
We do everything practicable to maximise complete reporting. Our processes seek to create a sense of personal responsibility with each company contact collecting data and an informal community between the company data contacts.
We provide telephone and email support, share ideas and experiences in making data collection efficient, and facilitate contact between companies with similar operational challenges. We carry out rigorous data checking and reflect any issues back to operators for resolution. Continuing concerns can be escalated to DfT with the most severe sanction available being removal from the trial.
Our direct contact with operators tells us that, in the vast majority of cases, those collating the data are very conscientious, even where it costs them some significant time and effort. In exceptional cases, the chance of losing their VSO has been used by DfT to prompt improvement.
Operators submit details of LST journeys undertaken and a detailed log of incidents.
How many LSTs are there on the road now?
The trial started in 2012 to 2013 with just a few hundred trailers in the national fleet. At the time of writing, around 2,486 LST allocations had been granted, and at the end of 2018, 2,194 LSTs were on the road and submitting data. The chart here shows how the fleet has grown over time.
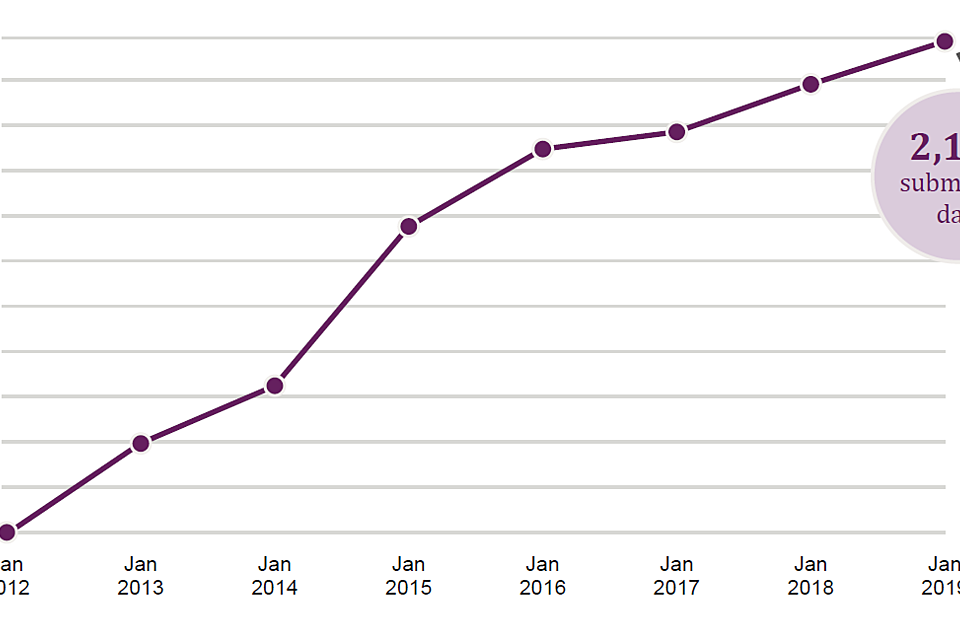
Graph showing operators submitting data, rising to 2,194 submissions.
LST trial results after 7 years
At the end of 2018, 7 years into the trial, we can confirm many useful results, in particular on how efficiently the LSTs are being used and whether they are being operated any more or less safely than the standard-length trailers they have replaced.
Since last year’s report we have completed some additional special analyses, looking at:
- geographical patterns of movement of LSTs by local authority
- interviews with a sub-group of operators (operator conversations) about all aspects of their experience of running LSTs
- the additional weight of various LST designs compared with similar 13.6m trailers
- a comparison of damage incidents rates for LST fleets and similar non-LST fleets
More details of how we carried out the calculations and research can be found in the full 2018 Annual Report.
What do operators use LSTs for?
Nature of journeys
Our trial data provides us with a lot of information about LST journeys: where they start and end, distances covered, what they are carrying and how full the trailers are.
By the end of 2018, LSTs had travelled 587 million km:
- goods carried are dominated by fast-moving consumer goods (low cost products, sold quickly) and other cage or pallet loads
- 66% of the distance travelled was between industrial locations (depots, distribution centres, supplier sites etc.); around 13% of loaded legs are to or from, retail sites – although a large proportion of these trips have a matching empty leg, so the actual total use for retail sites could be up to double this figure
- trailers ran empty around 19-20% of the total distance travelled, much lower than the figure of around 29-30% for all articulated trailers (source: Road Freight Statistics Table RFS0117 percentage empty running and loading factors by type and weight of vehicle.)
Many operators restrict LSTs to operations where they can run heavily loaded on both outbound and return legs to make the most of what is a significant investment. In many cases, this is between major distribution centres, which will mainly be on trunk roads, but also includes repetitive operations from distribution centres to larger retail stores, where the access permits LST use.
Nature of routes
The trial data tells us the start and end of each journey, but not the route travelled. Routing information is not available for all the LSTs. At the start of the trial, tracking semi-trailers separately from the tractor units that pull them was not standard practice. During 2015 through to 2017 we therefore developed a method of modelling routes, using the start and end postcodes provided by operators for 2017. We validated the model route selection using a large sample of GPS data for a mix of LST and non-LST operations by trial participants (DfT judged it would be unreasonable to ask operators to fit GPS equipment as a condition of the trial, as it would limit participation to larger companies. While GPS use is now more common, our research suggests fewer than 50% of the trailers are fitted with GPS tracking).
During 2018 we built on this work to determine geographical patterns of operation by Local Authority (LA). This was in response to a request by stakeholders at the launch of last year’s annual report. We carried out two analyses to estimate, the number of journeys in which an LST:
- stopped within the LA to ,for example, deliver or collect cargo, which we know directly from the data submissions
- passed through the LA without stopping, based on the modelled routes
We also estimated the number of journeys undertaken by LSTs within and between regions, again based on modelled routes.
The analyses include all those journeys in the year 2017 for which we had complete data, which is around 816,000 journeys, ~95% of the total of 861,000 LST legs.
The results for Stops by LA are summarised in the heat maps shown below. These show both the numbers of journeys, and an estimate of the number of journeys saved compared to delivering the same total deck space of goods using 13.6m trailers. The maps highlight the operations in and out of the major logistics estates in the country (Midlands around Rugby, North West near Warrington, the Glasgow/Edinburgh corridor etc.) and delivery out to major centres of population.
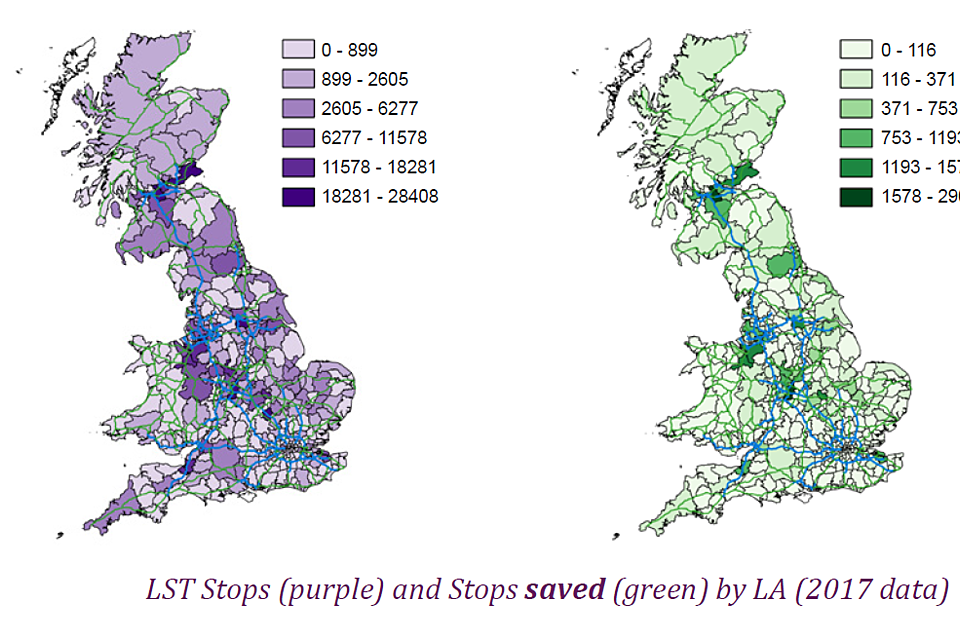
LST stops and stops saved.
The heatmaps for Pass-through journeys by LA are dominated by movements on the national road network and between the major centres of population.
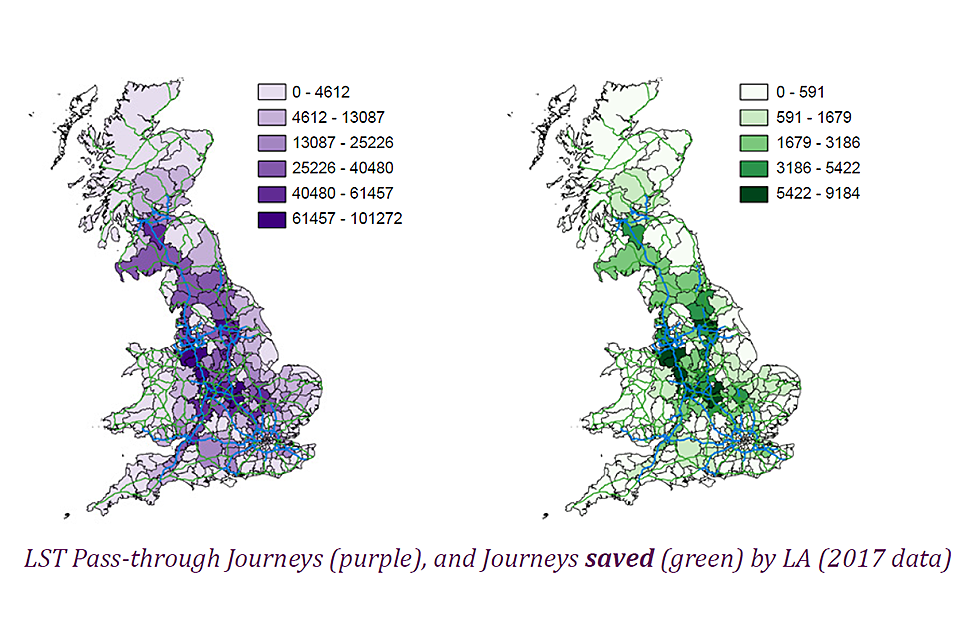
LST pass-through journeys and journeys saved.
The full 2018 Annual Report (Annex 4) contains a complete table of the results for every Local Authority in the UK.
Our analysis of Regional LST activity is summarised in the table below.
The UK uses the international Nomenclature of Territorial Units for Statistics (NUTS) codes for all national economic analysis.
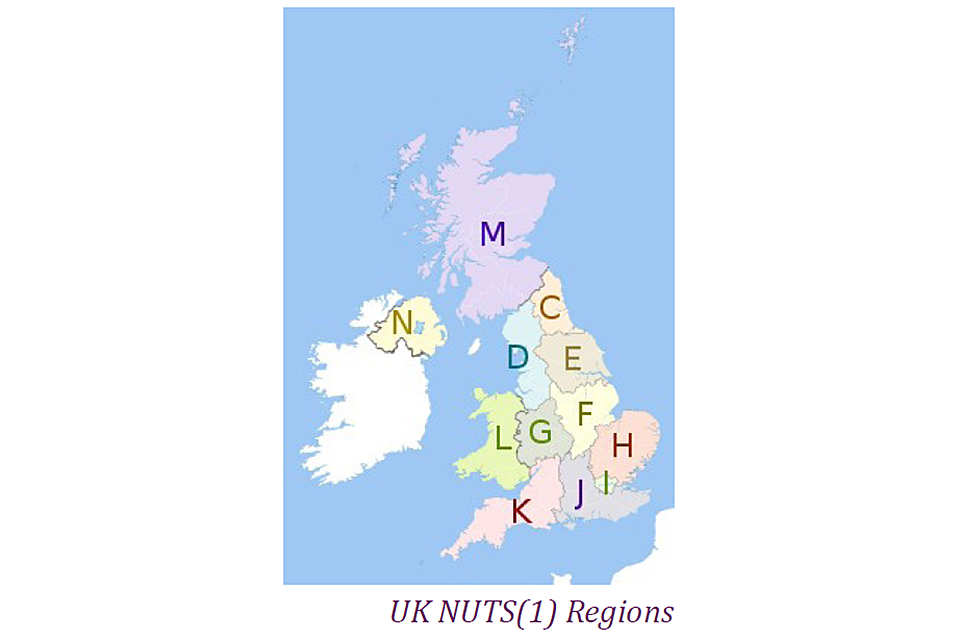
UK Nomenclature of Territorial Units for Statistics (NUTS) regions
The 2018 Annual Report contains detailed matrices for each region and between regions for journeys, journeys saved and tonnes lifted, for the 2017 dataset.
This can be simplified to show movements inside the region, to an adjacent region and farther afield, as show in the table.
It shows the substantial in-region LST activity, even allowing for the variation in region sizes.
Regional LST Activity (2017 data)
IN: inside the region, ADJ: adjacent region, FAR: farther afield
| % journeys/tonnes | Journey count | Journey count | Journey count | Journeys saved | Journeys saved | Journeys saved | Tonnes lifted | Tonnes lifted | Tonnes lifted |
|---|---|---|---|---|---|---|---|---|---|
| Region name: | IN | ADJ | FAR | IN | ADJ | FAR | IN | ADJ | FAR |
| UKC North East | 12% | 40% | 48% | 6% | 39% | 55% | 7% | 44% | 50% |
| UKD North West (1) | 54% | 42% | 4% | 49% | 46% | 4% | 47% | 48% | 5% |
| UKE Yorkshire and The Humber | 49% | 32% | 19% | 36% | 42% | 23% | 34% | 43% | 24% |
| UKF East Midlands (1) | 28% | 51% | 21% | 24% | 53% | 23% | 25% | 51% | 24% |
| UKG West Midlands (1) | 40% | 44% | 16% | 49% | 35% | 16% | 36% | 45% | 18% |
| UKH East of England | 40% | 32% | 27% | 48% | 21% | 31% | 31% | 31% | 37% |
| UKI London | 10% | 33% | 57% | 1% | 12% | 88% | 9% | 14% | 77% |
| UKJ South East (1) | 53% | 43% | 4% | 49% | 46% | 5% | 40% | 53% | 7% |
| UKK South West (1) | 46% | 33% | 20% | 37% | 41% | 21% | 35% | 40% | 24% |
| UKL Wales | 41% | 48% | 11% | 49% | 37% | 14% | 33% | 50% | 17% |
| UKM Scotland | 83% | 8% | 10% | 82% | 7% | 11% | 78% | 9% | 13% |
(1) Region of England
LST trial evaluation: headlines
| Trial take up | Trial target total: 2,800 LSTs |
|---|---|
| 2,486 (89%) | LSTs registered on Vehicle Special Orders (VSOs (1) (% of trial target of 2,800 trailers) |
| 2,194 (78%) | LSTs on the road and submitted trial data (% of trial target of 2,800 trailers) |
| 201 | Number of operators with trailers on the road (submitting data) |
(1) A VSO grants permission for a specific operator to operate specific special trailer(s) on GB roads for the duration of the VSO. All LSTs require a VSO from the Vehicle Certification Authority (VCA) before the trailers go on the road.
| Utilisation and km saved | Utilisation and km saved |
|---|---|
| 4.7 million | Journey legs travelled by LSTs during the trial |
| 587 million | km travelled by LSTs during the trial, estimated (2017) to be split: 85% Trunk / 13% Principal / 2% Minor Roads |
| 41.1 – 45.8 million | Vehicle km ‘saved’ by LST operations (end 2018). Lower – upper estimates (upper includes matched empty return legs) |
| Journeys saved | Estimates of equivalent ‘standard trailer’ journeys saved across whole trial period and all operators |
|---|---|
| 330 – 365,000 | Journeys by 13.6m trailers saved by using LSTs based on 125km average journey. Upper estimate (includes some return legs) |
| 1 in 13 (7.5%) | Average saving across all operators 1 in ‘n’ journeys (x% distance saved) |
| 1 in 8 (13%) | Highest saving achieved by individual operators |
| Emissions saved by LSTs on trial | Emissions saved by LSTs on trial | Estimates compared to the emissions from delivering an equivalent quantity of cargo on ‘standard trailers’ |
|---|---|---|
| To date | To 10 years | Savings of CO, PM (Exhaust) and VOC also calculated |
| 37,000 | 70,000 | CO2(e) (1) Tonnes of CO2(e) 2012-2018 (rounded) |
| 187 | 350 | NOx Tonnes of NOx 2012-2018 of which 6.2% saved within 200m of ‘Designated Areas’ |
(1) Carbon dioxide equivalent or ‘CO2(e)’ is a term for describing different greenhouse gases in a common unit. For any quantity and type of greenhouse gas, CO2(e) signifies the amount of CO2 with an equivalent global warming impact.
Injury incidents – national comparison
| Collisions | Casualties | Collisions / casualties where LST involved on public highways or public access areas (2012-2018) resulting in injury |
|---|---|---|
| 33 (4) | 43 (4) | All personal injury incidents involving an LST (Brackets show collisions / casualties judged to be ‘LST related’) |
| 59 | 72 | Three-year average safety incident rate (ALL collisions or casualties per billion vehicle km, 2016-2018) |
| 135 | 194 | Equivalent three-year rate for all GB articulated HGVs, (per billion vehicle km 2015-2017 – 2018 not yet published) |
| 0.44 | 0.37 | Collision / Casualty rate ratio (LST vs All GB Artic. HGVs) |
On a per kilometre basis, nationally, we estimate LSTs have been involved in around 55% fewer personal injury collisions and casualties than GB articulated HGV average.
Injury incidents – urban only/ minor road comparison
Collisions / casualties where LST on public highways or public access areas (2012-2018) resulting in injury
| Urban | Minor | URBAN = ONS Urban areas – excluding motorways MINOR = Operations OFF Motorway / Trunk / Principal roads |
|---|---|---|
| 3 | 3 | Personal injury incidents involving an LST (All – regardless of any ‘LST related’ judgement) |
| 39 (per billion km) | 255 (per billion km) | Safety incident rate (collisions per billion vehicle km) over whole trial for distance est. of 13.1% Urban and 2.0% Minor |
| 540 (per billion km) | 949 (per billion km) | Equivalent rate for all GB articulated HGVs over whole trial period, 2012-2017 (per billion vehicle km) |
| 0.07 | 0.27 | Collision rate ratio (LST vs All GB Artics) |
On a per kilometre basis, compared with the average for all GB articulated HGVs, LSTs on the trial have been involved in 93% fewer personal injury collisions per km when operating on roads in urban areas and 73% fewer when on minor roads.
Damage incidents – comparison within sample of operator fleets
| LST | Non-LST | Based on 91 operators able to provide credible 2018 data for both LSTs and Non-LSTs in the same operator fleet, occurring on roads, resulting in damage. |
| 0.91 (incidents) | 6.8 (incidents) | Mean number of incidents expected for an LST fleet and a non-LST fleet after 1 million vehicle km exposure, that is, after completing a million vehicle km as a fleet. |
The average number of incidents per million vehicle km for non-LSTs is greater than that for LSTs by a factor of about 7.4.
What are the savings realised in HGV journeys?
We estimate that the average percentage distance saving to the end of December 2018 is around 7.5%, which equates to 1 in every 13 journeys. The most efficient LST operations are saving up to 1 in every 8 journeys.
Beneath this average figure there are considerable differences in efficiency of operation across the range of operators taking part in the trial. We can identify 3 broad groupings in the data as shown in the table.
| LST savings performance summary by operator (2018) | Lowest savings group (0-5% saving) | Average savings group (>5-10% saving) | Highest savings group (>10-14% saving) |
|---|---|---|---|
| % of operators | 16% | 31% | 53% |
| % of trailers | 24% | 38% | 38% |
Notes: Based on the savings % for each operator including an estimate for empty return legs saved. % of trailers based on the number of trailers registered to the operators falling into each savings group.
More than half of the operators are running their trailers at or near their maximum efficiency (10-14%). This highest savings group is dominated by movement of raw materials, industrial products and biomass/fuel. These goods are often shipped goods in full loads only, commonly as a simple ‘Full-Out – Empty-Back’ loop.
Around a third of operators are in the average savings group, where a mixture of factors are driving the savings and variable trailer fill levels. An example is some retail sector deliveries to stores, where the cargo sizes can be driven by just in time delivery to the store of exactly what is demanded – there being little or no stock held at stores.
The lowest performing group – about 16% of operators – includes cargo such as mail and parcels, where the quantity of goods loaded is often not determined by a process designed to fill trailers to the maximum level, but by timetabled trailer departures; or, cargos such as waste packaging, which may be simply back-haul legs as a by-product of the main purpose of the trip.
Some of the lower performing operators are cases where the trailer has been purchased for use on a specific contract, which has then ended and new work has not been found. In other cases, the trailer has simply not been usable on as wide a range of work, or at the loading levels, the operator hoped. Outside of trial conditions and with a more active open market for LSTs, these operators may not have held on to their trailers.
What are the resulting reductions in emissions?
In 2017 we developed an emissions model which, integrated with the route modelling system mentioned above, allowed us to estimate savings in emissions taking account of route information, estimated vehicle weights and actual load weights.
The emissions model provides estimates for carbon dioxide, and five additional emissions relevant to air quality, both for the trial to date and projected forward to the nominal trial end point(s). The table here shows results for two key indicators – CO2e (Carbon dioxide equivalent or CO2(e) is a term for describing different greenhouse gases in a common unit. For any quantity and type of greenhouse gas, CO2(e) signifies the amount of CO2 with an equivalent global warming impact) and NOx. Full results for all emissions types can be found in the 2018 Annual Report.
LST Trial Emissions Savings Summary
| (All figures in tonnes, rounded) | Trial to date | 10 yr trial | Extended trial |
|---|---|---|---|
| Savings | 2012-18 | 2012-21 | 2012-2026 |
| Carbon dioxide (equivalent) CO2(e) | 37,333 | 69,786 | 128,190 |
| Oxides of Nitrogen (NOx) | 187 | 350 | 643 |
The key results for CO2(e) (as an emission that disperses widely) and NOx (as a localised emission) are:
The net emissions reduction from the trial to date is around 37,000 tonnes of CO2(e) (Carbon dioxide equivalent or CO2(e) is a term for describing different greenhouse gases in a common unit. For any quantity and type of greenhouse gas, CO2(e) signifies the amount of CO2 with an equivalent global warming impact) and 187 tonnes NOx, as well as other emissions.
The projected net reduction if the trial were to run to the original 10 YEAR end point is around 70,000 tonnes of CO2(e) and 350 tonnes NOx as well as other emissions.
The emissions model includes consideration of the weight of the trailer and its cargo. During 2018 we carried out an analysis of sample information on actual weights of different LST designs supplied by a selection of operators and manufacturers. The differences in marginal weights between the pre-trial estimates (used in the model runs reported above) and the more recent ‘as built’ values are not large, but if the emissions model was rerun, for example, to take account of the gradual replacement of EURO V engines with the more efficient EURO VI engines, the updated estimates of LST marginal weights could be incorporated, or used to carry out a sensitivity study.
What about safety – will LSTs cause more injuries?
The trial results are showing that LSTs can be operated safely, even when used on routes involving some minor roads.
Numbers of safety incidents – collisions and casualties
During the seven years from 2012 to the end of 2018 there have been 33 road traffic collisions in public locations that involved HGVs pulling an LST and have resulted in an injury. These have resulted in 10 serious and 33 slight injuries. For many of these, analysis of the events suggests that the type of trailer being pulled was not a factor.
In May 2019, there was a fatal accident involving a longer semi-trailer resulting in the death of the lorry driver. Investigation by the DVSA found that this incident was unrelated to the condition or extra length of the longer semi-trailer. There was a second fatality in August 2019 which resulted in the death of a cyclist. With the evidence the Department currently possesses, it is not believed that this was related to the longer length of the trailer. The department will continue to check if there are issues related to either incident which require further consideration in the context of the trial.
Collision and casualty rates (to end 2018)
A key question for the trial is whether the LSTs cause more injury collisions than the standard 13.6 metre semi-trailers. There are 2 parts to this question.
Q1. How many extra injury collisions would have occurred if the same goods had been moved using standard trailers, requiring more journeys?
There will have been a direct safety benefit of around 7.5% reduction in collisions, equivalent to around 6 to 7 collisions and 9 to 10 casualties, saved during the period of the trial due to the reduction in the number of journeys.
Q2. Do LSTs have a higher incident rate than the trailers they replace?
This question is about whether the LSTs are having more incidents per kilometre that they DO travel. It is independent of Q1.
At the end of 2018, we find that the trial LSTs are being operated in a way that results in a significantly lower rate of injury incidents per vehicle km (in public locations) than the average for GB articulated HGVs.
So LSTs are safe?
There is no reason why LSTs should be inherently safer than standard trailers, but on the trial, their incident rate per km is lower than for other trailers. There are a number of reasons why this might be the case:
- the conditions of participating in the trial require that operators provide special driver training for any staff using LSTs
- operators often report paying additional attention to route selection, route assessment, driver selection and driver familiarity with both the LST and the routes
- the focus brought by having to submit data on every LST journey probably reinforces their ‘special’ nature, even when, for some operators, they have now been in service for seven years
- the LSTs represent a significant investment that operators do not want to see damaged
Separately to the statistical analysis, we study each injury event in detail to look for any lessons that can be learnt regarding safe operation of LSTs. This has identified important principles in driver training and route planning and some more technical points about good maintenance.
DfT continue to monitor the performance of the various axle steering options in operation on the trial but do not intend to undertake a technical assessment of LST dynamics regarding the incident raised in the 2016 report while LSTs continue to be operated under current trial conditions.
Summary of LST-related injury incidents and outcomes after 443 million km travelled, compared with those for all GB articulated HGVs (>7.5T)
| Collisions in all public locations and resulting casualties | GB artic HGVs 1 in every… | LST involved 1 in every… | Judged LST related 1 in every… |
|---|---|---|---|
| All roads | 6.6 million km | 18 million km | 147 million km |
| Urban only | 1.9 million km | 26 million km | 77 million km |
| Minor roads only | 1.1 million km | 3.9 million km | 12 million km |
Notes:
- ‘all public locations’ covers all public roads and also private land where there is public access
- ‘urban’ here defined as all roads, excluding motorways, in ONS defined urban areas.
- ‘minor’ Roads are all roads that are classified below the level of A-Road
- GB Articulated HGVs: Based on DfT National data for all articulated HGVs > 7.5T 2012-2017 (TRA3105) = 83.7bn km of which 4.9bn urban non-motorway and 1.7bn minor roads. Injury incidents from STATS19 2012-17: Total collisions = 12,664 (2,648 urban and 1,575 minor roads)
- LST Involved: 33 collisions (3 urban and 3 minor roads). Any injury event in which an LST was involved, even if the trailer being an LST was not relevant – data from latest annual report table – Table 12. Non-injury, damage incidents are covered separately
- LST Related: 4 collisions. Events involving an LST where the fact that the trailer was an LST rather than a standard length was considered to be at least part of the cause. Note that the headline figures for trial injury rates use all collision and causality data
- these figures are mean values. The latest annual report includes analysis that concludes that the comparisons between LST incident rates shown here are all statistically robust at a 95% confidence level
What about damage and the associated costs – will LSTs cause more damage on the roads?
Damage to property or other vehicles
Since there is no national dataset for the damage events for non-LSTs, we needed to obtain data for non-LSTs within the fleets where the LSTs are operating, to inform a comparison. The revised data collection framework launched from 2018 crucially included a requirement to report summary figures for incidents and total distance travelled for the non-LST trailers operating in the same fleets as the LSTs, where it could be gathered.
Results from this data were available to inform a special study of damage incidents using data from 91 operators who were able to provide both LST and non-LST damage event figures for their fleets on a comparable basis. We collated the data across these 91 operators to examine any difference between the LST and non-LST fleets.
We found that for the operators in this sample, LST fleets have a much lower incident rate than non-LST fleets of the same group of operators. The results were found to pass tests for statistical significance.
We therefore see no indication that the LSTs on the trial are causing more damage than other semi-trailers in the same fleets.
As with the injury incident results, this is not attributed to any inherent characteristic of LSTs, but is taken to indicate that the LSTs are being operated in a manner that reduces the likelihood of damage events.
We also looked at the specific issue of whether the owners of assets damaged by LSTs were commonly aware of who was responsible for the damage. We found that in 85% of cases the owner was either present or was made aware of the incident by the operator. In 5% of cases it was unclear. In only 10% of events the owner was marked as ‘unknown’ and will not have been aware of how the damage occurred.
Damage to the road surface
The analysis has focused on the damage to roadside assets and other vehicles as we have not been asked to study wear and tear impact on the road surface itself. Pre-trial work suggested that this would not be an issue since the overall weight limit and number of axles/tyres for an LST is no different from standard trailers. Indeed, the argument was made that the reduction in tyre scrub by the use of a rear steering axle would mean reduced road surface damage.
Tractor unit with longer semi-trailer in the livery of Malcolm logistics
Might any special operational requirements be appropriate for LSTs?
From our periodic surveys of operators, we know that:
- many operators restrict LST operations to set routes, where:
- they can maximise utilisation of the extra length
- they have assessed the route to be suitable for LSTs
- the delivery points have been assessed as suitable for LSTs
- operators have adopted a range of different approaches to drivers’ LST training
- many operators seek to ensure that LSTs are operated by drivers who do so regularly, and in some cases, on repeated routes
During 2018 we have carried out conversations with eleven operators to further explore the special provisions they have adopted to ensure safe and efficient use of their LSTs.
As in earlier surveys, operators emphasised the key elements of specialist driver training and special route planning and assessment, and also wider issues of awareness for loaders, managers, depot designers and other company roles.
We are continuing these conversations during 2019, with a workshop for operators, looking deeper into the main themes and issues operators have sought to include in their driver (and other) training programmes, route planning and wider management of LSTs within their fleet. The output from this work can be used to inform further the DfT thinking on future LST policy and could form the foundation of a good practice reference for operators and training providers.
During 2018, we also explored operators’ thinking when selecting their LST design, and whether this would change in light of their experiences. Factors such as cost, volume, perceived manoeuvrability and maintainability, were the major influence on the initial design choices, but the choice was also often influenced by the offering and preferences of their favoured manufacturer. In use, the overall impression given by operators is of LSTs being no harder to drive at speed than standard trailers, with operators noting that they ‘follow well’ in cornering.
The more difficult factor to evaluate is the effect of the additional scrutiny of being on the trial, beyond noting that this will have had some effect. The present detailed data gathering process cannot be expected to continue indefinitely, or with a much increased size of national LST fleet. However, from our interviews with operators, we do hear an expectation that LSTs should always be treated by operators as special equipment. This is already the case for double-deckers, ISO carriers and other less common designs, which are subject to some special treatment within their fleet management.
What proportion of the existing GB fleet of semi-trailers might be replaced by LSTs, were numbers not restricted?
In 2016, we carried out a survey of operators to explore the numbers of LSTs that may be taken up by the trial operators, were LSTs to become widely available at some point in the future.
Operators were asked to make two take-up estimates:
- the first assuming today’s infrastructure (mainly depot and yard designs, but also manufacturing bases)
- the second, assuming some future date when some newer depots etc would have been designed or modified to better accommodate the longer trailers
The data gathered showed some logical patterns, with higher take-up estimates made by those with the most control over their load sizes and those involved in longer distance movements between large distribution sites, where the benefits of additional capacity are greatest.
During 2018 we continued to gather information on potential take-up as part of our conversations with selected operators. The table below shows our latest estimate of take-up (for the operators on the trial). This is based on our 2016 data, with some small adjustments resulting from the recent conversations.
This gives a broad indication of the potential take-up in different sectors of the freight industry – where the specific goods involved are sufficiently light (low density) that a full LST load can be carried within the national 44t weight limit.
LST take up projections by goods type: Percentage of current fleet that trial participants might replace, over time, with LSTs – by goods type carried
| Goods type | With current infrastructure | With future infrastructure |
|---|---|---|
| 1) Empties/waste packing | 26% | 31% |
| 2) FMCG (mixed products) | 23% | 33% |
| 3) FMCG (single product) | 14% | 20% |
| 4) Raw material/supplies | 28% | 35% |
| 5) Industrial products | 21% | 28% |
| 6) Biomass/fuel | 10% | 22% |
| 7) Mail/parcels | 14% | 22% |
| 8) Other – retail | 39% | 63% |
| 9) Other – non-retail | 3% | 7% |
| 10) Pallets – mixed/unknown | 21% | 35% |
The take-up figures are distance-weighted averages for each operator based on the total km travelled carrying each good type. FMCG = Fast moving consumer goods.
What next for the trial?
Evaluation work led by Risk Solutions continues in several areas:
- data collection: with a particular focus on data submissions from companies who have joined the trial in the last 12-18 months
- industry and stakeholder conversations: continuing the conversations with a sub-group of operators at a deeper level, with the aim of producing the foundations of ‘good practice’ for efficient and safe use of LSTs when integrating them into an operation
- completing the core elements of a scaling model to DfT to ensure the trial results are applied appropriately to the national freight statistics to estimate the potential impact of LSTs if they were made available in larger numbers
In parallel with this, DfT has informally canvassed stakeholders to gather their views on LSTs and possible regulatory policy that may be considered if there was a move to make LSTs available outside of the trial. It is the intention of DfT that any future policy options maintain the positive outcomes that the trial has indicated.
Tractor unit and longer semi trailer in the livery of Firmin distribution
Department for Transport
The Department for Transport (DfT) is the government department responsible for the English transport network and a limited number of transport matters in Scotland, Wales and Northern Ireland that have not been devolved. DfT began the GB trial of longer semi-trailers for articulated goods vehicles in January 2012 and is responsible for the trial as a whole, including the allocation of trial places to companies applying to participate. The evaluation of the trial is funded by DfT under the Specialist Professional and Technical Services (SPaTS) framework, but is carried out by independent consultants.
Contacts
For further details on the trial, or to request a copy of the full version of the report, contact the DfT trial project manager:
Martin Placek
Policy Adviser, Freight Operator Licensing and Roadworthiness
Freight Operator Licensing and Roadworthiness,
Department for Transport
Great Minster House, 33 Horseferry Road
London, SW1P 4DR
- Email: freight@dft.gov.co.uk
- Tel: 07977 436767
Risk Solutions
Risk Solutions is a specialist management consultancy working in the areas of risk, evaluation and decision support, with specialist expertise in industry engagement and working with complexity and high degrees of uncertainty. Risk Solutions has been involved in policy evidence development, preparation of impact assessments and evaluations for DfT, Defra, BEIS and other government departments and private companies. Risk Solutions was commissioned by DfT in 2012 to help design and implement the LST Trial evaluation process and has since been reappointed twice in the role of independent evaluator.
For further details of Risk Solutions’ services, including the evaluation of the trial, follow the link below or contact:
Dr V Paul Brand
LST Trial Evaluation Manager
Dallam Court, Dallam Lane
Warrington WA2 7LT
- Email: paul.brand@risksol.co.uk
- Tel: 07968 107141
- Web: www.risksol.co.uk
WSP
WSP is one of the world’s leading engineering and professional services consulting firms. With over 43,000 talented people in more than 500 offices across 40 countries, 7,800 of which are based in the UK. WSP supplies services to DfT and Highways England under the SPaTS Framework Contract, using a consortium of in-house skills and carefully selected partners, including Risk Solutions. WSP has a dedicated logistics team that combines technical skills in modelling and analysis with a depth of knowledge based on real life operational experience in the logistics and supply chain sector.
For further details of WSP’s services in the Freight and Logistics Sector, follow the link below or contact:
Nasar Malik
Director
WSP House, 70 Chancery Lane
London WC2A 1AF
- Email: nasar.malik@wsp.com
- Tel: 07834 506154
- Web: www.wsp.com/en-GB
Please note
Communication from trial participants regarding data collection issues should be directed to the trial email address: LSTTrial@risksol.co.uk.