Local authority and children’s homes in England inspections and outcomes Autumn 2017: main findings
Published 20 December 2017

© Crown copyright 2017
This publication is licensed under the terms of the Open Government Licence v3.0 except where otherwise stated. To view this licence, visit nationalarchives.gov.uk/doc/open-government-licence/version/3 or write to the Information Policy Team, The National Archives, Kew, London TW9 4DU, or email: psi@nationalarchives.gov.uk.
Where we have identified any third party copyright information you will need to obtain permission from the copyright holders concerned.
This publication is available at https://www.gov.uk/government/statistics/local-authority-and-childrens-homes-in-england-inspections-and-outcomes/local-authority-and-childrens-homes-in-england-inspections-and-outcomes-autumn-2017-main-findings
This release covers:
-
Inspections and outcomes for local authority children’s services inspections from 1 November 2013 to 31 October 2017, published by 8 December 2017 (Final data)
-
Inspection outcome of the most recent inspection, for all children’s homes, as at 30 September 2017 and published by 31 October 2017 (Final data)
-
Inspections and outcomes for all children’s homes between 1 April 2017 to 30 September 2017, published by 31 October 2017 (Provisional data)
All local authorities (LAs) have been inspected as part of the completed Single Inspection Framework (SIF).
All 152 LAs have been inspected at least once.
The overall effectiveness profile of LAs has improved.
As at 31 October 2017, 36% of LAs were judged good or outstanding, an increase from 29% in March. Over the same period, there was a decrease in LAs judged inadequate from 24% to 19%.
The key judgement profile sometimes differs in important ways from the overall effectiveness profile of the SIF.
While 3 LAs were judged outstanding overall, there were 12 LAs which were judged outstanding for Leadership, management and governance.
The state of the nation picture for children’s homes continued the trend of an increasing proportion of homes judged good or outstanding.
At 30 September 2017, 82% of homes were judged good or outstanding. This is a small increase from 81% at 30 September 2016.
A large majority of homes judged inadequate in their first full inspection between April and September 2017 improved at their subsequent re-inspection.
Of the 31 homes judged inadequate that were subsequently re-inspected, 27 improved.
1. Introduction
This release contains data on children’s homes inspections, local authority (LA) inspections and Local Safeguarding Children’s Board (LSCB) reviews.
Ofsted inspects the 152 LAs in England responsible for ensuring and overseeing the effective delivery of social care services for children. These inspections are of LA services for children who need help and protection, children looked after, and care leavers, under the single inspection framework (SIF). This inspection cycle began in November 2013 and ended in October 2017. All LAs have been inspected at least once in that period.
In addition to the SIF, and conducted at the same time, Ofsted has conducted reviews of the LSCBs. LSCBs are responsible for safeguarding, and promoting the welfare of children.
Children’s homes all receive a full, and certain homes an interim, inspection [footnote 1], on an annual cycle and may receive additional concern driven inspections. Children’s homes are made up of 3 different sub types of homes:
-
children’s homes – these are most of the homes in England and are defined as any home that does not fall within the other 2 sub types below, that is, is not a residential special school registered as a children’s home and is not a secure children’s home
-
residential special school registered as a children’s home – these are residential schools which, due to the number of days they look after children, must register as children’s homes
-
secure children’s homes
Children’s homes cater for a variety of children and young people with varying difficulties, disabilities or disorders. These include, for example, emotional or behavioural difficulties, mental health problems, sensory impairment, and learning difficulties.
Most children’s homes are small: 95% of homes have 10 or fewer places and more than half of homes have fewer than 5 places. This includes all active children’s homes as at 31 August 2017 (see Ofsted Annual Report 2016/17).
Unless otherwise stated 2016 to 2017 refers to 1 April 2016 to 31 March 2017. The ‘period’ referred to throughout is the 6 months in 2017 to 18: 1 April 2017 to 30 September 2017.
2. Inspection of local authority children’s services
There are approximately 12 million children living in England, of whom, at any one time, just over 3% are in the social care system (classified as children in need).
2.1 Overall SIF effectiveness as at 31 October 2017
As at 31 October 2017, the completion of the SIF programme, all 152 LAs in England have had at least one SIF inspection and 6 have had 2 SIF inspections. This section includes the re-inspection judgements of those LAs that were judged inadequate at their first SIF inspection.
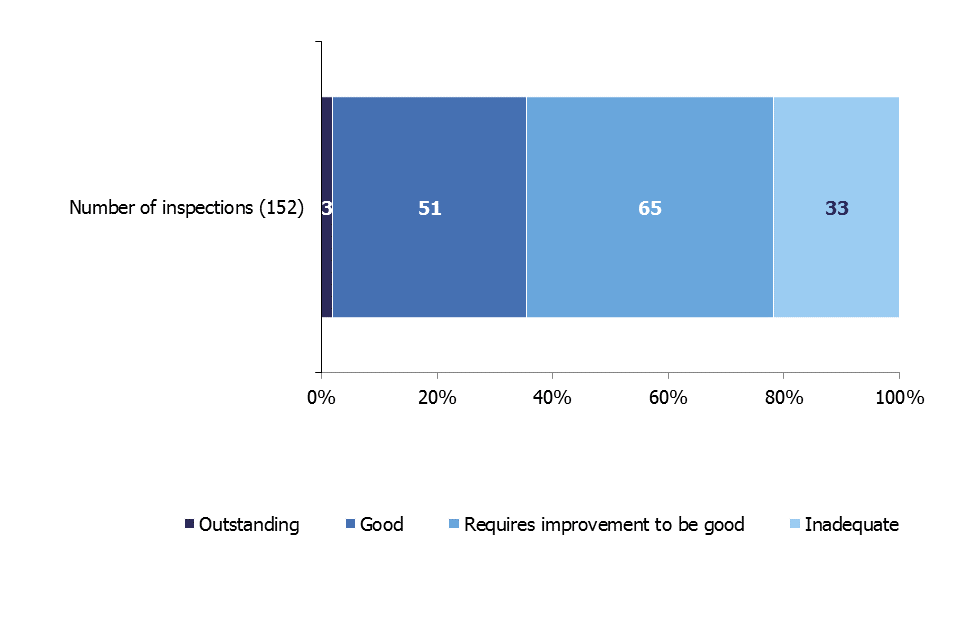
Chart 1: SIF overall effectiveness as at 31 October 2017
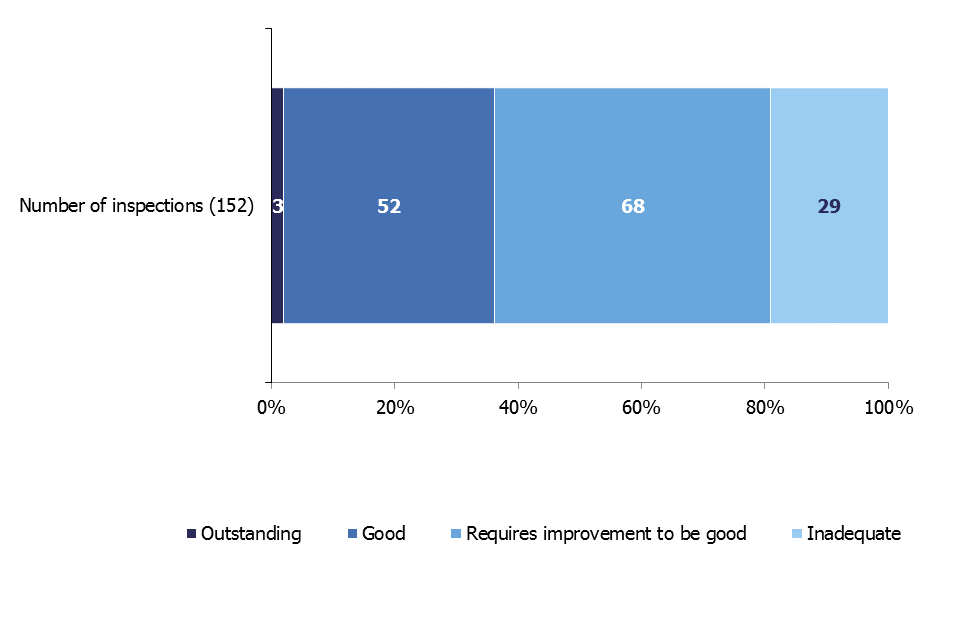
Overall effectiveness of LAs at their most recent SIF inspection
The most recent inspection judgements as at 31 October 2017 led to an improved judgement profile with 36% of LAs now judged good or outstanding for overall effectiveness (up from 29% at 31 March 2017). There was an improvement in the percentage judged inadequate; decreasing from 24% at 31 March 2017 to 19%.
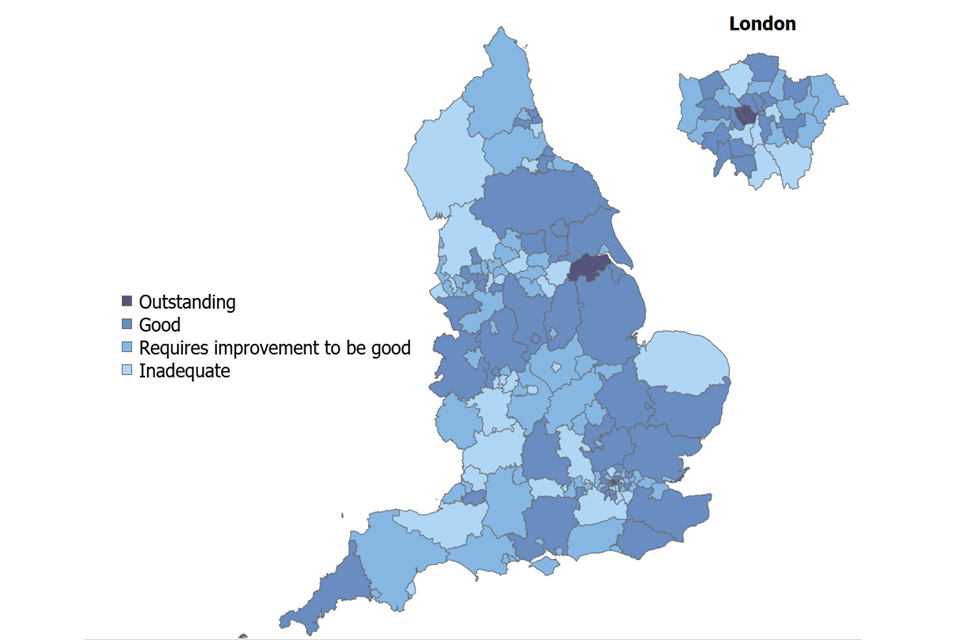
Map 1: SIF inspection overall effectiveness judgements as at 31 October 2017

Map showing overall effectiveness for each LA at their most recent SIF inspection
2.2 Key judgements as at 31 October 2017
Chart 2: SIF key judgements as at 31 October 2017
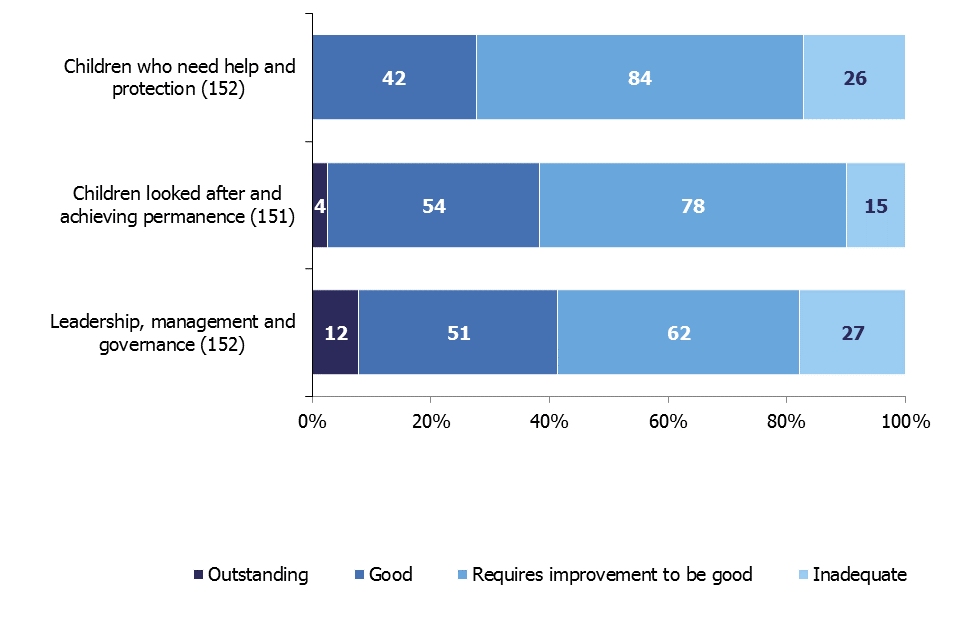
Comparing LAs' key judgements for most recent SIF inspection
The key judgement where most LAs were judged outstanding was Leadership, management and governance. Twelve LAs were judged outstanding; 7 of these were in London. However, the Leadership, management and governance key judgement also had the most LAs judged inadequate (27).
Children who need help and protection, which is acknowledged to be the hardest area of work for an LA to get right, was the area of weakest performance. Over half were judged requires improvement to be good (84 authorities) and 26 authorities were judged inadequate. Children who need help and protection was the only sub judgement where no LA was judged outstanding.
Only one of 16 LAs in the South West were judged good for Children who need help and protection compared with nearly half of LAs in London and over a quarter nationally.
There were 2 LAs judged inadequate in all of the key and sub judgements as at 31 October 2017: Sunderland and Bromley. An additional 10 authorities were judged inadequate for each of the 3 key judgements: Buckinghamshire, Dudley, Kirklees, Reading, Rotherham, Slough, Somerset and Worcestershire plus – since we last reported on SIF inspection outcomes published as at 30 April 2017 – Barnet and Croydon.
2.3 Children looked after and achieving permanence sub judgements (adoption and care leavers) as at 31 October 2017 [footnote 2]
The key judgement area Children looked after and achieving permanence has 2 sub judgements: adoption performance, and experiences and progress of care leavers; both are areas of strong performance by LAs when comparing across all key and sub judgements.
Chart 3: SIF adoption performance sub judgement as at 31 October 2017
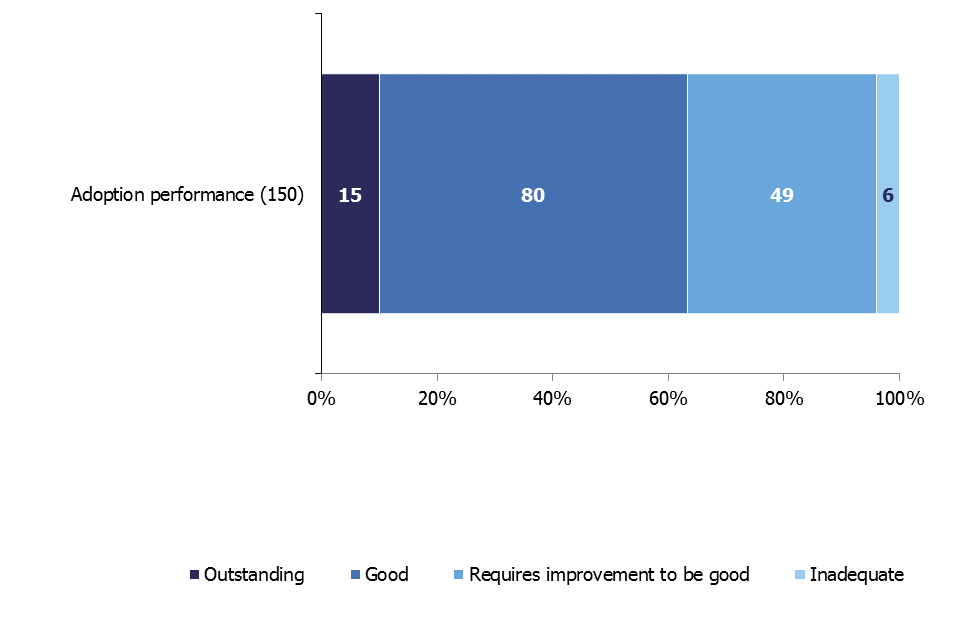
Adoption performance sub judgement of LAs for their most recent SIF inspection
A total of 15 LAs were judged outstanding for adoption performance, with 63% (95) of all authorities judged good or outstanding. Six authorities were judged inadequate (Chart 3).
Chart 4: SIF experiences and progress of care leavers sub judgement as at 31 October 2017

Experiences and progress of care leavers sub judgement for LAs' most recent SIF inspection
Nine authorities were judged outstanding for experiences and progress of care leavers and 61 were judged good. Of the 15 authorities judged inadequate in this sub judgement, 8 were requires improvement to be good for the Children looked after and achieving permanence key judgement; and 7 were inadequate (Chart 4).
2.4 Outcomes by local authority type and location
Chart 5: SIF overall effectiveness judgements as at 31 October 2017, by region
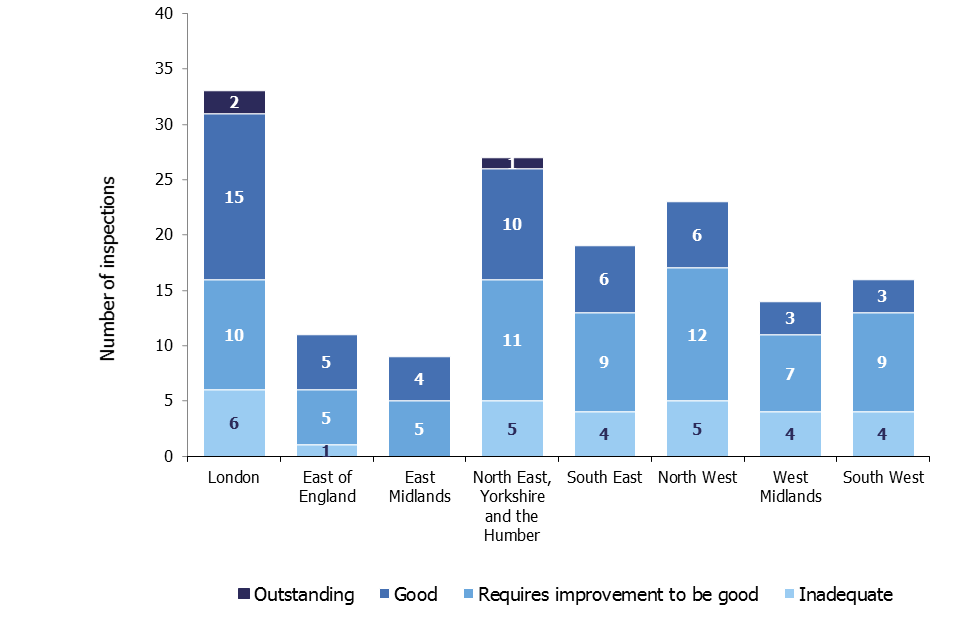
Comparing overall effectiveness of LAs in each region for their most recent SIF inspection
The 55 authorities judged good or outstanding for overall effectiveness are spread across all 8 regions in England. The 29 authorities judged inadequate now cover 7 regions (Chart 5).
Of the 8 regions, 4 had more than 40% of their authorities judged good or outstanding for overall effectiveness – London (52%), the East of England (45%), the East Midlands (44%), and the North East, Yorkshire and the Humber (41%). The South West had the lowest percentage, with just 3 of its 16 authorities (19%) being judged good or outstanding.
The region with the highest percentage of inadequate LAs was the West Midlands (29%). At the other end of the spectrum, the East of England only had 9% (one authority) judged inadequate and the East Midlands [footnote 3] had no inadequate authorities.
Nearly a third (17) of authorities judged good or outstanding for overall effectiveness were London boroughs; and nearly a third (16) were unitary authorities. Thirteen were shire counties and 9 were metropolitan districts. Two of the 3 authorities judged outstanding were London boroughs and the other was a unitary authority.
Of the 29 authorities judged inadequate, over a third (10) were metropolitan districts, 8 were shire counties, 6 were London boroughs and 5 were unitary authorities.
Chart 6: Percentage of children in need by SIF overall effectiveness judgement

The percentage of children in need living in LAs, by SIF overall effectiveness grade profile, for each region
Source: DfE National Statistics, Characteristics of children in need: 2016 to 2017
Across England, 37% of children in need lived in LAs judged good or outstanding. The East of England had the highest percentage of their children in need in good or outstanding authorities (60%) and the South West had the lowest (12%).
In England, 24% of children in need lived in LAs judged inadequate. The West Midlands and the North West had the highest proportion of their children in need in inadequate authorities (39%) and the East of England had the lowest (14%) apart from East Midlands which had none.
The East of England had 45% of their LAs judged good or outstanding, but 70% of their children in need living in those good LAs.
2.5 Local authorities that have had 2 SIF inspections
Six LAs have had a second SIF inspection. Two remained inadequate, 3 improved to requires improvement to be good and one (West Berkshire) improved from inadequate to good.
Of the 2 authorities that remained inadequate, Slough kept exactly the same profile across all sub judgements and was judged inadequate in all of these apart from the adoption performance sub judgement which was judged requires improvement to be good. Birmingham has improved to requires improvement to be good in the Children looked after and achieving permanence key judgement and both sub judgements.
2.6 Overall first SIF summary 2013 to 2017
This section only includes the first SIF inspection, excluding all re-inspections.
Chart 7: Overall effectiveness at first SIF inspection
Overall effectiveness of LAs at their first SIF inspection
Over a third (36%) of LAs were judged good or outstanding for overall effectiveness at their first SIF.
Around two fifths of LAs (43%) were judged requires improvement to be good.
Just over a fifth of LAs (22%) were judged inadequate.
Map 2: Overall effectiveness judgements at first SIF inspection
Map showing overall effectiveness for each LA at their first SIF inspection
Map 3: Percentage of LAs judged good or outstanding at their first SIF inspection, by Ofsted region

Map showing the percentage of LAs within each region judged good or outstanding at their first SIF inspection
Regions in the east of the country performed better than those in the west. In London, the East Midlands, the East of England and North East, Yorkshire and Humber, over 40% of LAs were judged good or outstanding at their first SIF inspection. The exception is the South East which performed similarly to the North West (26%). Less than a fifth of LAs in the South West were judged good or outstanding.
2.7 Key SIF judgements
The overall effectiveness judgement for the SIF is derived from 3 key judgements:
-
the experiences and progress of children who need help and protection
-
the experiences and progress of children looked after and achieving permanence
-
leadership, management and governance
Chart 8: Key judgements at first SIF inspection

The grade profile of key judgements at LAs' first SIF inspection
3. Reviews of Local Safeguarding Children Boards
Ofsted conducted 152 reviews of all Local Safeguarding Children Boards (LSCBs) in England alongside the SIF inspections of LA children’s services.
The final grade profiles for LSCB reviews and SIF inspections were very similar.
Map 4: Overall effectiveness judgements for LSCB reviews as at 31 October 2017

Map showing overall effectiveness judgements for each LA at LSCB review
Seven LSCBs were judged outstanding; 6 of these were judged good under the SIF. North Lincolnshire was judged outstanding in both.
Around one third (53) of the LSCBs were judged good for overall effectiveness. Of these, 62% were judged good or outstanding under the SIF.
There were 25 authorities judged inadequate for their LSCB, 17 of which were judged inadequate under the SIF.
4. Overall experiences and progress of children and young people for all children’s homes [footnote 4]
See inspection of children’s homes framework for inspection from 1 April for further details on grading inspection findings.
There are 2 ways to look at information about overall experiences and progress of children and young people judgement (overall effectiveness) for children’s homes:
State of the nation
This looks at all providers active on 30 September 2017, and what their most recent inspection judgement was at this date;
- for each provider, only their most recent full inspection is included
- providers inspected prior to 1 April 2017, but not since, will have their previous judgement included
In year or relevant period
This looks at all inspections that took place in a set period of time; in this release that period is between 1 April 2017 and 30 September 2017;
- this will include providers that closed before the end of the period, and for some providers will include more than one inspection [footnote 5]
- some providers will be excluded, as they were not inspected in the period [footnote 6]
4.1 State of the nation for all children’s homes
This is the most recent full inspection the provision had received and is not necessarily from 2017 to 18.
There are around 6,000 children in homes at any one time in the year; this figure has remained the same for a number of years.
The size of children’s homes ranges from one-bed homes to a maximum of around 100 beds. However, 95% of homes have 10 or fewer beds, with 5 beds on average.
There has been a continued long-term trend of fewer large homes. The number of places has risen at a slower rate than the number of homes. So, while there are more children’s homes there are not significantly more places for children. This includes all active children’s homes as at 31 August 2017 (see Ofsted Annual Report 2016/17).
On 30 September 2017, 94% of children’s homes had received a full inspection. Only 125 children’s homes had not yet been judged; they are excluded in the analysis below.
Chart 9: Children’s homes overall effectiveness, 6 monthly

Comparing overall effectiveness grade profile for children's homes as at 30 September 2017, 31 March 2017 and 30 September 2016
There was one home that received an overall effectiveness judgement at a monitoring visit. State of the nation analysis includes this home’s monitoring visit overall effectiveness judgement.
Most children’s homes (82%) had an overall effectiveness judgement of good or outstanding. This was the same as the picture as at 31 March 2017, and a small improvement from 30 September 2016 by one percentage point.
Chart 10: Children’s homes overall effectiveness at their most recent inspection, as at 30 September 2017

Comparing overall effectiveness grade profile for different types of children's homes at their most recent inspection
All 3 sub types of children’s homes had seen an improvement in their state of the nation picture since the same date in 2016.
Compared to the same date in 2016, there were 70 additional children’s homes judged good or outstanding, 5 more residential special schools registered as children’s homes, and one more secure children’s home.
4.2 Regional outcomes for all children’s homes
Children’s homes are not spread evenly across the country, with 23% in the North West and only 6% in London. The variation in quality across the country has not changed considerably since March 2017. Overall, 3% of homes were judged inadequate and 18% of homes were judged outstanding as at 30 September 2017, both of which were the same as at 30 September 2016.
Chart 11: Children’s homes overall effectiveness at their most recent inspection, as at 30 September 2017, by region

Comparing overall effectiveness grade profile of children's homes at their most recent inspection in each region
Five regions saw a small increase in the percentage of homes judged good or outstanding since the same date last year, while 2 regions saw small decreases. The percentage of homes good or outstanding in the West Midlands stayed the same, at 78%, as at 30 September 2016.
4.3 Children’s homes inspections in the period
Between 1 April 2017 and 30 September 2017, there were 1,250 full inspections of children’s homes; an increase of 5% from the equivalent period in 2016 (1,196).
Chart 12: Children’s homes overall effectiveness, comparing 6 month periods
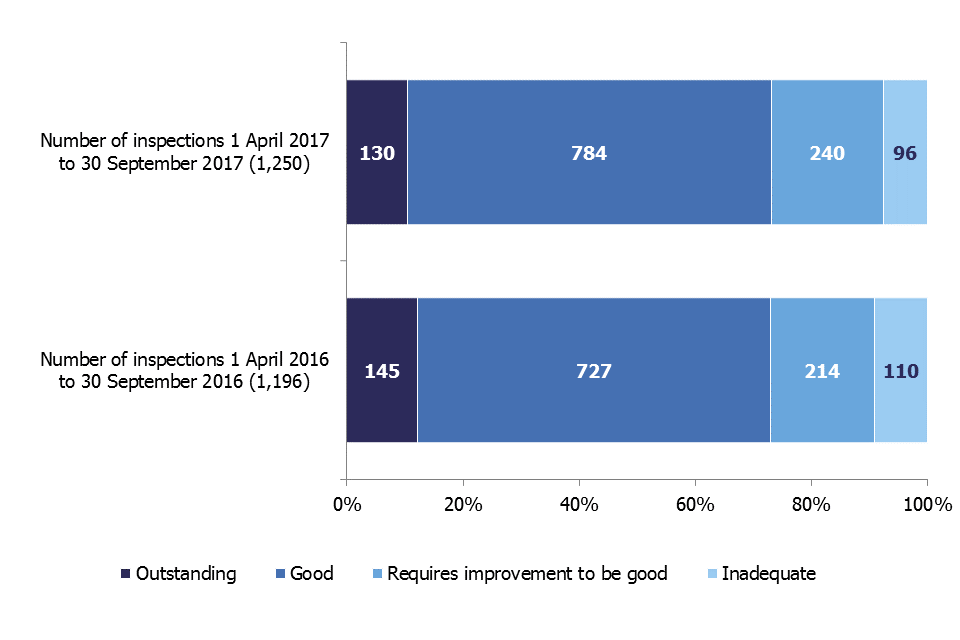
Overall effectiveness grade profile of children's homes inspections between 1 April 2017 and 30 September 2017, compared to overall effectiveness grade profile of children's homes inspections between 1 April 2016 and 30 September 2016
There was one home that received an overall effectiveness judgement at a monitoring visit. Analysis in the period only includes full inspections so this home’s monitoring visit overall effectiveness judgement was excluded.
The percentage of inspections judged good or outstanding remained at 73%, the same as in this period last year.
The percentage of inspections judged inadequate fell to 8% from 9% in the same period last year. Thirty-one homes had 2 full inspections in the 6 month period; all were judged inadequate at their first inspection. All but one of these were also judged inadequate for each of their sub judgements.
Most (87%) homes improved after re-inspection, with only 4 homes remaining inadequate. By 30 September, one of the 4 had resigned their registration.
There were 18 homes that resigned their registration during the period. Eight of these had been judged inadequate at their most recent full inspection; 6 had been judged requires improvement to be good; and 4 had been judged good. Of the providers who resigned, 16 were children’s homes and 2 were residential special schools registered as children’s homes.
Chart 13: Children’s homes overall effectiveness, 1 April 2017 to 30 September 2017, by sub types of homes

Comparing different types of children's homes' overall effectiveness grade profile at their inspections in the period 1 April 2017 to 30 September 2017
Similar to last year, the majority of inspections (1,194 or 96%) were of children’s homes. There were 46 inspections of residential special schools registered as children’s homes (4%) and 10 inspections of secure children’s homes.
Of the 3 sub types of children’s homes, residential special schools registered as children’s homes had the poorest grade profile across the 6 month period, with 65% of inspections resulting in a good or outstanding overall judgement.
4.4 Overall effectiveness for all children’s homes – change since 2016 to 2017 inspection
Of the 1,219 providers which had a full inspection in the period, 1,094 had a full inspection outcome in the previous year.
Chart 14: Change to overall effectiveness compared to previous inspection
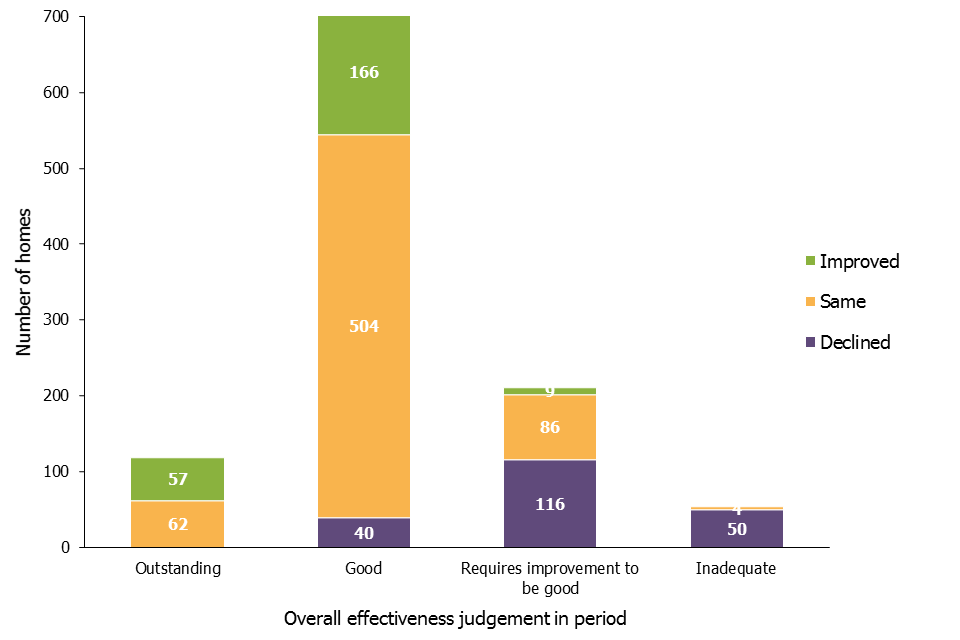
Looking at how children's homes' overall effectiveness has changed compared to their previous inspection
The proportion of homes judged to have stayed the same was 59%, with 21% of homes improving and 20% declining.
Of the 92 children’s homes judged inadequate at their first full inspection in 2017 to 18, 5 were also judged inadequate at their most recent inspection in 2016 to 2017. A further 24 declined from requires improvement to be good, 48 from good and 3 from outstanding. The remaining 12 homes were judged inadequate at their first inspection.
Of the 451 inspections which resulted in a change of judgement, 392 (87%) changed by only one grade and 59 (13%) changed by more than one grade.
The majority of homes (80%) judged to be good or outstanding at their most recent inspection in 2016 to 17 remained at that judgement for their first full inspection in 2017 to 18. Over half (59%) of homes judged requires improvement to be good or inadequate improved their grade to good or outstanding.
4.5 Sector data for all children’s homes in period
Compared to last year, the inspection judgements for all 3 sectors have remained broadly the same.
Chart 15: Children’s homes overall effectiveness, 1 April 2017 to 30 September 2017, by sector

Comparing overall effectiveness grade profile of children's homes by sector for inspections in the period 1 April 2017 to 30 September 2017
Please note that inspection judgements for health authority homes have not been included as a separate entry as there are so few of them (6 inspections, all 6 received good judgements). They have, though, been included in the England figure.
4.6 Regional outcomes for all children’s homes in period
The number of inspections carried out in each region varied in the first 6 months of the inspection year. When you exclude the small number of second inspections of homes, it equated to 55% of homes across England having been inspected, ranging from 47% of homes in the South East to 67% of those in the East of England.
The regional pattern of inspection results for the first 6 months of this inspection year are very similar to those in the first 6 months of last year.
4.7 Interim inspections for all children’s homes in period
Between 1 April 2017 and 30 September 2017 there were 36 interim inspections; 15 resulted in a judgement. This compares to 169 interim inspections in the same period last year.
5. Revisions to previous release
View revised data from 1 April 2016 to 31 March 2017.
- The revision of statistics relating to 1 April 2016 to 31 March 2017 from ‘provisional’ to ‘revised’ status includes outcomes relating to a further 176 inspections. These consist of an additional 55 full inspections, four monitoring visits and one emergency visit of all provision types, and 116 interim inspections of children’s homes. These took place in this period and have been published since 30 April 2017. These additional inspections didn’t affect the general grade profile across all provider types.
6. Notes
Ofsted consulted with users in 2014 to seek views on the proposed arrangements for the frequency and content of social care inspection official statistics, which is described in more detail in the accompanying Quality and Methodology report. Ofsted also has representation at relevant meetings and forums to seek feedback about whether our publications meet user needs, which include regional meetings of performance leads from LAs. Ofsted’s participation helps inform about user views, and suggested improvements are taken on board. Ofsted also engages with other organisations including the Department for Education (DfE) and representations from the private and voluntary sectors.
An explanation about key uses of this data, and further contextual information and the arrangements for quality assurance are provided in the accompanying Quality and Methodology report.
Ofsted also publishes data for all remits, including social care, as part of the annual Data View.
7. Glossary
For a full definition of the terms below, please see the Glossary tab within the underlying data tables.
Children’s homes
A children’s home is an establishment that provides care and accommodation wholly or mainly for children. Children’s homes vary in size and nature, and fulfil a range of purposes to meet the different needs of children and young people.
Providers
The institutions, organisations, or agencies that provide services to the relevant children and young people.
Residential special schools
Residential special schools provide education and accommodation to both full boarders and children resident only during the week, including children with very specialist needs.
Sector
‘Sector’ refers to the type of provider that owns the children’s social care provision.
Academy: These are publicly funded independent schools who are run by trusts.
Health Authority: These are NHS Trust-run.
LA: These are public bodies responsible for the children’s social care provision.
Private: These are for-profit organisations mostly with limited company status. These can also be individually owned children’s social care provisions and run for profit.
Voluntary: These are mostly not-for-profit organisations, mainly with charitable status; and individually owned provisions run on a not-for-profit basis.
Secure children’s homes
Secure children’s homes accommodate children and young people who are remanded or have been sentenced for committing a criminal offence, or whose behaviour is deemed to present a significant threat to their own and others’ safety.
8. Further information
If you have any comments or feedback on this publication, please contact the Social Care Data Team on 03000 130020 or socialcaredata@ofsted.gov.uk
Acknowledgements
Thanks to the following for their contribution to this statistical release: Helen Knight and Francesca Thompson.
-
Ofsted use a risk-based approach to inspecting children’s homes. For more information, see the framework ↩
-
Not all 152 LAs are included in each part of this section. City of London and the Isles of Scilly were not judged on adoption performance. The Isles of Scilly were not judged on experiences and progress of care leavers. ↩
-
Leicester was re-inspected and improved from inadequate to requires improvement to be good. ↩
-
All the sections of this release, on children’s homes, talk about data covering all types of children’s homes as one group, unless the paragraph or chart specifically splits the data into the three sub types of children’s homes. ↩
-
Homes found at some point to be inadequate, or homes for which concerns were raised which required additional inspections. ↩
-
Children’s homes are inspected on a 12 month cycle and this release covers the first 6 months of that period. Some homes will therefore not yet have been inspected. In addition homes with no children on roll and with no plans to accept children within the following 3 months after the inspection would have taken place, were not inspected. ↩