IPO Counterfeit goods research (Wave 4)
Published 17 June 2025

© Crown copyright 2025
This publication is licensed under the terms of the Open Government Licence v3.0 except where otherwise stated. To view this licence, visit nationalarchives.gov.uk/doc/open-government-licence/version/3 or write to the Information Policy Team, The National Archives, Kew, London TW9 4DU, or email: psi@nationalarchives.gov.uk.
Where we have identified any third party copyright information you will need to obtain permission from the copyright holders concerned.
This publication is available at https://www.gov.uk/government/publications/ipo-counterfeit-goods-research-wave-4/ipo-counterfeit-goods-research-wave-4
ISBN
978-1-915090-61-4
Print this page
If you would like to read this report in a PDF format, please choose ‘Print this page’ and click the option to print to PDF. To include chart detail, select ‘Change to table and accessible view’
1. Executive summary
The overall levels of consumption of physical counterfeit goods remained steady with previous waves of research. Most respondents (76% in Wave 4) indicated that they had never knowingly purchased counterfeits. Despite slight fluctuations between waves, the top three reasons for not purchasing counterfeits were consistent. This includes not liking the quality of counterfeit products, concerns about supporting criminal activity, and the use of low-cost labour or poor working conditions.
Around a quarter (24%) of the sample said they had knowingly made a counterfeit purchase. This is a drop of 5 percentage points (pp) compared to the previous wave. A smaller proportion (15%) currently did so often, sometimes, or occasionally (a decrease of 4 pp compared to the previous wave).
Like previous waves, a strong correlation between age and counterfeit purchasing exists. Younger respondents are more likely to purchase counterfeits. Among those currently purchasing counterfeits, 27% were aged 25-34, 21% were aged 35-44, and 20% were aged 18-24. This contrasted with 14% of respondents aged 45–55 and only 7% of those aged 55 and above. In all age groups, 5-14% of respondents indicated that they used to buy counterfeits but no longer do.
Wave 4 of the counterfeit goods tracker showed that, in all categories, purchases stayed the same or fell. The most substantial decline compared to the previous wave was observed in “Toys” (falling by 5 pp to 9%), which returned to the level seen in Wave 2.“Clothing, footwear, and accessories” (12%) and “Sports” (12%) had the highest proportions of counterfeit purchasing.
There were some shifts in the sources of counterfeit purchases in Wave 4. Buying counterfeit goods in-person rose in several categories. These include “Sportswear from clubs/franchises” (+13 pp), “Electrical accessories” (+11 pp), and “Accessories excluding watches” (+10 pp). All other categories remained similar to Wave 3. Buying counterfeit goods online saw increases in the online purchase of “Cosmetic and toiletry products” (+6 pp) and a decrease in those purchasing “Electrical accessories” (-6 pp), “Regular sportswear” (-6 pp), and “Sportswear from clubs/franchises” (-5 pp). Whilst this wave had some fluctuations, the results remained consistent with the long-term trend observed seen the pre-COVID-19 Wave 1 and the post-COVID-19 waves afterward. This trend has seen in-person purchasing generally stay below the levels seen in Wave 1. It has also seen a sustained increase in online purchasing.
Messaging
During the qualitative phase of research that followed the first survey, messaging aimed at reducing counterfeit purchasing was tested in an Online Community. The learning from this qualitative phase informed another iteration of behaviour change campaign messaging, which was subsequently tested in a second quantitative survey. In this wave, the focus was exclusively on the “Beauty and hygiene” category.
Respondents were presented with a total of nine messages and asked to assess the likelihood of each message dissuading them from purchasing various categories of counterfeit products:
- the same three messages proved most effective at both an overall level and across most subgroups, including sex, age, and whether respondents currently purchase, used to purchase, or were open to purchasing counterfeit items
- messages emphasising health and safety performed the best. They were closely followed by messages highlighting the societal impact of counterfeits, such as child labour, while messaging about the environment proved to be the least effective
- the consistent success of messages related to health and safety, in terms of addressing the dangers of purchasing counterfeits, underscores the potential effectiveness of a beauty and hygiene campaign centred around this overarching safety message
Recommendations
Younger respondents, specifically those under the age of 45, were the most active purchasers of counterfeit goods, making them the primary target audience for any behaviour change campaigns.
Consumers in certain product categories are consistently more likely to purchase counterfeits than others, though patterns of consumption in some categories are evolving. Categories like “Clothing, footwear, accessories”, and “Sports” have consistently shown high levels of counterfeit purchasing across all four waves of the study. Therefore, it may be pertinent to explore strategies for targeting these specific categories. On the other hand, “Toys”, which saw an increase in Wave 3, have returned to the levels observed in Wave 2.
Since the onset of the COVID-19 pandemic, there has been a noticeable increase in online purchasing of counterfeit goods, as evidenced in last year’s study. In this fourth wave of the tracker, it is evident that online purchasing has remained consistent, solidifying it as the dominant trend despite a resurgence of in-person purchasing in certain categories, such as “Sportswear from clubs/franchises”. This presents an opportunity to strategically consider where behaviour change interventions might be most effective in disrupting the consumer journey.
The second quantitative survey in this study, which assessed messaging efficacy, showed that several messages focusing on the impacts of counterfeit beauty and hygiene products could be impactful. While health and safety messages were generally the most effective, those related to the societal impact had a greater influence on younger respondents, specifically those aged under 35. This underscores the potential effectiveness of a behaviour change campaign that specifically targets the beauty and hygiene sector, as elaborated upon in the dedicated reporting section on communications.
Qualitative summary
Besides exploring the reasons why consumers purchase counterfeit goods and where they purchase from etc, the qualitative research also sought to understand the context for consumers at the time of the research. The Online Community this year showed that the current economic climate continues to have an impact on the lives and spending habits of participants, many of whom were having to find ways to spend less.
Participants reported trying to cut down on spending across a number of expenses and shopping in general. Therefore, some participants mentioned that they had either maintained the level of purchasing counterfeits from the previous year or increased upon their previous levels of counterfeit purchasing in order to keep costs down. There were no particular differences in regard to levels of purchasing mentioned qualitatively across categories, though interestingly a few of those who purchased fashion related counterfeits did say they would prefer to invest in better quality clothing and that they were worried about some of the practises involved in producing counterfeits. Nonetheless, they couldn’t necessarily afford to do so, but this shows that some participants are aware of and consider the negative aspects of purchasing counterfeits.
In relation to sourcing counterfeit goods, participants in our Online Community mostly went to online sources as a means of purchasing, valuing the ease and convenience as well as the opportunities to establish whether a seller seemed reliable from customer reviews. Some, though a lesser proportion (at least within our smaller qualitative sample), went to brick-and-mortar sources in person, with the benefit of being able to see, touch and evaluate a product before buying. Here markets abroad continued to play an important role, as well as some UK markets (Manchester’s markets came up a few times) and car boot sales.
Chiming with a new line of enquiry in the first quantitative survey this year, participants in the Online Community were asked about what they call counterfeit goods, and what came to mind when they heard the word ‘counterfeit’. Backing up the quantitative responses, many participants in the community mentioned using the words ‘fake’ and ‘knock off’ most commonly. Though most people understood what was meant by the term ‘counterfeit’, many saw this as a more formal way of expressing this type of product which they wouldn’t necessarily use themselves.
2. Methodology
Research aims
For many years, the IPO has sought to create a trackable and strong evidence base to inform decision making about physical counterfeits; the purchasing of counterfeit products, and attitudes towards doing so, in order to draw on this research in regard to policy and communications.
Given the continued success of the IPO’s Online Copyright Infringement (OCI) tracker, a decision was made to measure the purchasing of counterfeit products in the UK in the same way over time.
In 2019 a benchmark study was established, followed by the second wave in 2021 and a third in 2022. As with all previous waves, this wave, (the study’s fourth), continues to build on the evidence base year on year, whilst also taking into account the societal backdrop of the current year to ensure the findings are placed within context. The IPO is also keen to gather evidence that will help to facilitate behaviour change in consumers, based on their specific needs, and fostering greater respect for IP among those who are more actively seeking-out such goods.
Stage 1 (Quantitative)
As in previous years, the first stage of research comprised a large-scale, 15-minute, online survey among a representative sample of the UK adult population (aged 18+). Our sample size of N=5,000 has allowed us to conduct robust analysis at the total and sub-group level (e.g. by age, sex, SEG etc.). Importantly, it has allowed us to explore behaviours relating to a range of industries in-depth.
The survey was live between 16 June to 10 July 2023 and sample was sourced through our network of professionally managed (ESOMAR compliant) online UK consumer research panels. We have ensured that data is representative of the general population (by setting quotas and applying a weighting factor linked to population data released by the Office for National Statistics (ONS)). Respondents were asked about both their general and counterfeit purchasing history and habits across 6 broad product categories which (in total) covered 20 individual categories.
The fourth iteration of the Counterfeit Goods Tracker maintained consistency with previous waves across key metrics, allowing for wave-on-wave trend analysis. Additions were also made to expand and refine the insights gathered. The changes made included:
- routine tweaks to question wording and response options
- additional answer options to a question about factors likely to motivate people to purchase counterfeits, around family and friends or influencers recommending products
- two new sections looking into terminology around counterfeits, to try to ascertain which words the population use to refer to these products
Categories covered
Beauty and hygiene
- cosmetic and toiletry products
- hygiene products
Clothing, footwear and accessories
- clothing excluding sportswear
- footwear/shoes excluding sports footwear
- accessories excluding watches
- watches
Sports
- regular sportswear
- sportswear from clubs/franchises
- sports footwear (i.e. trainers) from sports or fashion brands
- sports equipment including for home workout
Toys
- dolls/action figure toys
- toy building sets
- merchandise from TV/Film excluding dolls/action figures
Electricals
- beauty/hygiene related electricals
- electrical accessories
- electrical devices
- DVDs and Blu Rays
Alcohol
- bottles of wine/champagne
- bottles of spirits (e.g. vodka)
- bottles/cans of beer or cider
Stage 2 (Qualitative)
The qualitative stage consisted of a week-long discussion in our Online Community platform, running from the 17 to 23 July 2023. An online community is a virtual research platform that enables the completion of a variety of tasks through either group discussions or private interactions. Its focus was to understand the reasons behind displayed attitudes and behaviours, especially given the continuing geopolitical context to 2023. The Online Community also sought to test behaviour change messaging and this year, only campaigns aimed at beauty and hygiene counterfeits were tested. This is due to having tested campaigns across all the categories for 3 years already and now seeing the opportunity to dig into individual product categories in more detail, on this occasion building on the IPO’s deep dive project into Beauty and hygiene counterfeits in 2021.
A total of 64 participants were recruited to take part in the Online Community, from a pool of respondents who had taken the survey in the previous stage of this study. Four categories were explored in depth in the qualitative research, due to high incidences of counterfeiting shown in these categories in the survey. As opposed to the survey in which categories were broken out into subcategories (e.g. Sportswear v Sports equipment), the qualitative research treated each category as a whole (e.g. sports overall), given the smaller sample size.
Within the Online Community sample, we focussed on those aged 35 and under, due to the higher incidences of counterfeit purchasing in these age groups, although some participants aged 36-54 were also included in order to understand any differences in behaviours. All participants were intentional purchasers of counterfeits and had knowingly purchased a counterfeit product in the last year.
The Online Community itself covered the following topics: the importance of each product category to participants; reasons for purchasing products in each category; methods of purchasing counterfeits; the 2023 context and its impact on rates of purchasing counterfeits; the language used to talk about counterfeits; and reactions to mocked up campaigns against the purchasing of beauty and hygiene counterfeits.
Categories covered
Beauty and hygiene
- cosmetic and toiletry products
- hygiene products
Clothing, footwear and accessories
- clothing excluding sportswear
- footwear/shoes excluding sports footwear
- accessories excluding watches
- watches
Sports
- regular sportswear
- sportswear from clubs/franchises
- sports footwear (i.e. trainers) from sports or fashion brands
- sports equipment including for home workout (e.g. rackets, bats, football, bikes, exercise machines etc.)
Electricals
- beauty/hygiene related electricals
- electrical accessories
- electrical devices
- DVDs and Blu Rays
Stage 3 (Message Testing - Quantitative)
Building on the in-depth, qualitative insight gained from the Online Community, the same beauty and hygiene-oriented campaigns were then put to respondents in a second survey to see whether robust numbers corroborated the initial qualitative findings.
These campaigns were tested in a survey with non-rejectors of counterfeits (including those who either had purchased, currently purchased or were open to purchasing counterfeit goods).
The survey explored whether each campaign would be likely to prevent respondents from purchasing beauty and hygiene counterfeits, along with some contextual questions to set the scene.
In total, n=1,500 completed the survey.
Fieldwork for this second survey took place between 28 July to 8 August 2023.
The survey included questions on the following topics:
- profiling (e.g. demographics)
- counterfeit purchasing history
- messaging evaluation (whether the information would be likely to impact their purchasing of beauty and hygiene counterfeits)
More information about the methodology can be found in the technical appendix
Interpreting the data
There are considerations to make when interpreting the data. Due to differences in the way some levels of infringement are captured, direct comparisons between infringements for certain categories should include methodology checks.
When comparing to previous waves, changes in behaviour regarding the purchasing of counterfeits precipitated due to COVID-19 should be borne in mind when making comparisons between the first and second waves.
Where questions were asked using a scale the full answer options have been included. Where (single choice) question percentages do not add up to 100%, this is due to rounding of the data.
If base sizes are below N=30, results must be interpreted with caution.
Margin of error: with any piece of research, it is almost never feasible to measure the entire population and thus achieve results that are 100% accurate. We must, therefore, take into account the potential for error. As a guide, we advise caution when interpreting results that have less than a (-/+) 3 or 4% difference.
Navigating this report
Throughout this report, there are references to waves 1-4. Research was carried out in the following years:
- Wave 1 – 2019
- Wave 2 – 2021
- Wave 3 – 2022
- Wave 4 (this report) – 2023
The report begins with an overview of counterfeit purchasing.
Each content category then has its own bespoke section. Qualitative insights are included for content categories covered within the Online Community.
Following this is a section which explores the effectiveness of messaging intended to reduce the amount of counterfeit purchasing.
The report ends with a summary of key findings relevant for future behaviour change campaigns. These results are largely based on the communications testing conducted in the qualitative research.
3. Overarching trends – Incidence, categories, motivations and barriers
This section provides an overview and comparison of key trends at an overall level of counterfeit purchases and a breakdown by category. It is based on the 2023 wave and includes yearly comparisons, where relevant, over the four years of the study. It covers the incidence rate of counterfeit purchasing, purchasing by category, reasons for purchasing / not purchasing counterfeit goods, the reporting of counterfeit purchasing, and the prices respondents are willing to pay for them.
Incidence rate of purchasing counterfeits
The proportion of people who currently, previously, or had never purchased counterfeit goods remained consistent with the first three waves of the study:
- the majority (76%) of respondents indicated that they had never purchased counterfeit goods while just under a quarter (24%) had done so
- 15% said they currently purchase counterfeit goods on an often, sometimes or occasional basis
- 9% used to buy counterfeit goods but no longer do, which is unchanged from the previous wave – of those who stopped, most (76%) did so over a year ago
Chart 1: Question. Which of the following best describes you in relation to purchasing “fake” or counterfeit items. By this we mean items that look very much like the original product but are not made by the brand itself. (By wave)
| Response | Wave 1 | Wave 2 | Wave 3 | Wave 4 |
|---|---|---|---|---|
| NET Have ever made a counterfeit purchase | 28.8% | 26.7% | 29.0% | 24.0% |
| NET Have not purchased counterfeit goods | 71.2% | 73.3% | 71.0% | 76.0% |
| I often buy “fake” or counterfeit products (i.e. at least one every month) | 1.9% | 1.7% | 2.0% | 1.5% |
| I sometimes buy “fake” or counterfeit products (i.e. at least one every three months) | 5.0% | 4.2% | 5.0% | 4.0% |
| I occasionally buy “fake” or counterfeit products (i.e. less regularly than every three months) | 10.6% | 9.4% | 12.0% | 9.6% |
| I used to buy “fake” or counterfeit products but no longer do | 11.3% | 11.4% | 10.0% | 8.9% |
| I have never bought “fake” or counterfeit products but would consider doing so in future | 11.6% | 8.8% | 10.0% | 10.1% |
| I would never knowingly buy “fake” or counterfeit products | 59.6% | 64.5% | 61.0% | 65.9% |
Base: Total sample (n=5,072)
Chart 2: Question. When did you stop purchasing “fake” or counterfeit products?

Base: Those who have stopped purchasing counterfeits in the past year (n=451)
Incidence rate of purchasing counterfeits (by age and sex)
Respondents aged between 18-44 were more likely to indicate that they ‘currently’ purchase counterfeit goods, meaning they do so often, sometimes, or occasionally. This was highest among those aged 25-34, at 27%, followed by 21% for those aged 35-44 and 20% for those aged 18-24. It fell to between 7-14% for the two older age groups.
Compared to the previous wave, there were decreases in those ‘currently’ purchasing counterfeit goods in the two youngest age groups. It decreased by 11 pp to 20% in those aged 18-24 and 6 pp to 27% in those aged 25-34. There were minimal changes (i.e. +/- 3 pp) in all other age groups.
The purchase of counterfeit goods was higher among male (18%) than among female (13%) respondents. This marks a departure from last year when they were at the same level.
Chart 3: Question. Which of the following best describes you in relation to purchasing “fake” or counterfeit items. By this we mean items that look very much like the original product but are not made by the brand itself. (By age group and sex)
| Response | I often buy “fake” or counterfeit products (i.e. at least one every month) | I sometimes buy “fake” or counterfeit products (i.e. at least one every three months) | I occasionally buy “fake” or counterfeit products (i.e. less regularly than every three months) | I used to buy “fake” or counterfeit products but no longer do | I have never bought “fake” or counterfeit products but would consider doing so in future | I would never knowingly buy “fake” or counterfeit products | Total |
|---|---|---|---|---|---|---|---|
| 18-24 | 1.5% | 5.9% | 12.5% | 10.4% | 18.2% | 51.5% | 100% |
| 25-34 | 3.1% | 8.7% | 15.7% | 14.2% | 14.4% | 43.9% | 100% |
| 35-44 | 3.3% | 6.8% | 11.3% | 12.3% | 10.6% | 55.7% | 100% |
| 45-54 | 0.9% | 2.4% | 10.8% | 8.4% | 9.3% | 68.2% | 100% |
| 55+ | 0.4% | 1.0% | 5.2% | 5.1% | 6.3% | 82.0% | 100% |
| Female | 1.2% | 2.7% | 8.7% | 9.2% | 9.6% | 68.6% | 100% |
| Male | 1.9% | 5.3% | 10.6% | 8.6% | 10.6% | 63.0% | 100% |
Base: Total sample (n=5,072)
Product categories
The 24% who had knowingly purchased a counterfeit were asked which product categories they had purchased them in within the past year. They were only asked about the categories in which they had made a purchase. Chart 4 shows the proportion of consumers in each broad product category who had made a counterfeit purchase.
Respondents were most likely to have purchased counterfeit products from the “Clothing, footwear, and accessories” category (12%) and the “Sports” category (12%). Both experienced small declines of 3 pp and 2 pp, respectively; however, these changes were within the margin of error, so they should be interpreted with caution.
Among the remaining categories, “Toys” and “Electricals” both had similar levels of counterfeit purchasing (both 9%), while “Alcohol” had a rate that was 5 pp lower. “Toys” experienced the largest decline among all categories, falling by 5 pp to 9%, which is a return to the rate seen in Wave 2.
Chart 4: Question. Which, if any, of the following categories have you knowingly purchased “fake” or counterfeit products for in the past year? (By wave)
| Product categories knowingly purchased | Wave 1 | Wave 2 | Wave 3 | Wave 4 |
|---|---|---|---|---|
| Beauty and hygiene | 6.0% | 7.0% | 7.5% | 7.0% |
| Clothing, footwear and accessories | 12.8% | 14.2% | 14.3% | 12.4% |
| Sports | 8.6% | 11.8% | 14.7% | 12.2% |
| Toys | 5.2% | 9.0% | 13.8% | 9.0% |
| Electricals | 4.9% | 8.2% | 9.4% | 9.3% |
| Alcohol | 2.2% | 4.1% | 6.6% | 4.9% |
Base for Wave 4: Counterfeit purchasers as a percentage of consumers in each category: Beauty and hygiene (n=312), Clothing, footwear and accessories (n=568), Sports (n=344), Toys (n=166), Electricals (n=318), Alcohol (n=192)
Rationalisations for purchasing counterfeits
Anyone who had ever (i.e. currently or previously) purchased a counterfeit good or indicated that they would consider doing so in the future was presented with a list of potential motivating factors and asked how likely each would make them to purchase counterfeits. Their answers have been split out depending on whether they currently, used to, or would be open to buying counterfeit goods.
The top four factors, while stronger among current purchasers, were important for all. These four were selected by similar proportions within each segment, with factors related to money comprising the main theme - wanting to reduce spending/outgoing but also the price/cost-effectiveness of counterfeits. The desire for the product to closely match the original in terms of quality was also important.
Each of the top four factors was identified as motivations by 71-72% of current purchasers, 41-48% of former counterfeit purchasers, and 42-50% of those who would consider purchasing counterfeits in the future.
Of statements provided, respondents were least likely to mention that they purchased counterfeits due to hearing from an influencer or through social media that the products were of good quality, or because they did not want to support big brands.
Chart 5: Question. To what extent do or would the following influence/motivate you to purchase “fake” or counterfeit products? (By type of counterfeit purchaser)
5-point scale question – The NET is a combination of ‘Somewhat likely to purchase’ and ‘Very likely to purchase’ with other answer options including ‘Neither likely nor unlikely’, ‘Somewhat unlikely to purchase’ and ‘Very unlikely to purchase’)
| Purchasing influence/motivation | Currently purchases counterfeits | Used to purchase counterfeits | Would consider buying counterfeits in the future |
|---|---|---|---|
| Similar/the same quality | 72.3% | 48.5% | 50.3% |
| Wanting to reduce spending/outgoings | 72.0% | 47.9% | 47.0% |
| The ‘real’ product was out of your budget/price range | 70.9% | 47.1% | 45.4% |
| The ‘fake’ or counterfeit was cheaper | 72.0% | 41.1% | 42.5% |
| Hearing from family or friends that the ‘fake’ or counterfeit products were good | 64.8% | 41.9% | 39.4% |
| Similar/the same design | 64.6% | 37.3% | 40.5% |
| Being able to purchase ‘fake’ or counterfeit products easily | 60.5% | 29.4% | 31.3% |
| Not wanting to give money to big brand(s) | 50.2% | 26.0% | 30.9% |
| Hearing from an influencer or people on social media that the ‘fake’ or counterfeit products were good | 48.3% | 24.1% | 22.8% |
Base: Currently purchase counterfeits (n=767), Used to purchase counterfeits (n=451), Would consider buying counterfeits in the future (n=511)
Rationalisations for purchasing counterfeits (by age)
There were some key differences by age in terms of motivations for purchasing counterfeit goods:
- younger respondents were the most likely to be influenced by most of the motivations tested
- in each case, individuals aged 18-24 were the most likely to indicate that it would make them likely to purchase a counterfeit product, 25-34-year-olds ranked as the second most likely group for each category, followed by 35-44-year-olds as the third most likely, and so forth
- the two exceptions were the ability to purchase counterfeit goods easily and hearing from an influencer that the products were good – in these cases, those aged 25-34 were more likely than the 18-24 age group to express that these factors would influence their purchasing decisions
Chart 6: Question. To what extent do or would the following influence/motivate you to purchase “fake” or counterfeit products? (By age group)
5-point scale question – The NET is a combination of ‘Somewhat likely to purchase’ and ‘Very likely to purchase’ with other answer options including ‘Neither likely nor unlikely’, ‘Somewhat unlikely to purchase’ and ‘Very unlikely to purchase’)
| Purchasing influence/motivation | 18-24 | 25-34 | 35-44 | 45-54 | 55+ |
|---|---|---|---|---|---|
| Similar/the same quality | 55.4% | 46.1% | 35.6% | 24.6% | 16.1% |
| Wanting to reduce spending/outgoings | 50.1% | 44.8% | 33.6% | 25.1% | 14.4% |
| The ‘real’ product was out of your budget/price range | 51.0% | 41.4% | 32.7% | 23.7% | 13.4% |
| The ‘fake’ or counterfeit was cheaper | 49.4% | 38.9% | 29.7% | 21.7% | 12.5% |
| Hearing from family or friends that the ‘fake’ or counterfeit products were good | 42.5% | 39.0% | 30.4% | 19.8% | 13.5% |
| Similar/the same design | 39.3% | 37.4% | 29.2% | 20.0% | 11.8% |
| Being able to purchase ‘fake’ or counterfeit products easily | 30.0% | 32.3% | 24.6% | 14.8% | 9.0% |
| Not wanting to give money to big brand(s) | 33.6% | 31.4% | 22.2% | 15.5% | 9.2% |
| Hearing from an influencer or people on social media that the ‘fake’ or counterfeit products were good | 26.7% | 29.5% | 19.9% | 10.9% | 5.5% |
Base: All respondents from each age group – 18-24 (n=512), 25-34 (n=833), 35-44 (n=862), 45-54 (n=912), 55+ (n=1,990)
Rationalisations against purchasing counterfeits
Those who did not ‘currently’ (i.e. often, sometimes or occasionally) purchase counterfeit goods were asked why they didn’t. They were grouped into one of the following: would never buy them; used to buy them but wouldn’t anymore; and those who would consider buying them in the future.
No single reason was dominant in any of the groups. The top three reasons across all groups related to not liking the quality of the products as well as more moral considerations (e.g. worrying about supporting criminal activities, use of low cost labour/poor working conditions).
Chart 7: Question. What are/were your main reasons for not purchasing “fake” or counterfeit products? (By counterfeit purchasing)
Multiple choice question (i.e. respondents were asked to select all options that apply)
| Reasons for not purchasing | Would never buy counterfeits | Would consider buying counterfeits in the future | Use to purchase counterfeits |
|---|---|---|---|
| I would be worried about supporting criminal activity | 53.5% | 26.5% | 36.3% |
| Use of low cost labour or poor working conditions | 42.9% | 28.3% | 44.0% |
| I do not like the quality of ‘fake’ or counterfeit products | 40.9% | 38.5% | 45.3% |
| I would be worried that the product could have harmful effects (e.g. leading to allergies etc.) | 33.8% | 21.0% | 27.0% |
| ‘Fake’ or counterfeit products harm/damage the real brands | 33.5% | 19.4% | 24.4% |
| The negative impact they have on the environment | 24.9% | 15.0% | 19.2% |
| I would be worried about getting in trouble | 18.7% | 15.3% | 14.0% |
| I do not like the design of ‘fake’ or counterfeit products | 17.8% | 14.6% | 17.9% |
| ‘Fake’ or counterfeit products can be similar in price to real ones | 9.1% | 11.8% | 16.4% |
| Fear of being judged by other people for purchasing a ‘fake’ or counterfeit | 8.6% | 12.9% | 15.4% |
| Other | 7.8% | 7.8% | 3.8% |
Base: Would never buy counterfeits (n=3,343), Used to purchase counterfeits (n=451), Would consider buying counterfeits in the future (n=511)
Rationalisations against purchasing counterfeits (by age)
There were some key differences by age in terms of the reasons given for why people don’t currently purchase counterfeits:
- there were several reasons with clear age correlations, for example, worrying about supporting criminal activity and harming/damaging the real brand had a much larger impact on older respondents – for each, 55+ year olds were the most likely to identify this as a reason for not purchasing counterfeits, with the proportions dropping with subsequent age groups
- the inverse was true for fear of being judged and not liking the quality or design; 18-24-year-olds were the most likely to be impacted, with the proportions dropping as age rose
- negative impact on the environment had a bigger impact on those aged 18-24 compared with all other age groups
- worry about getting into trouble had similar impact across different age groups
Chart 8: Question. What are/were your main reasons for not purchasing “fake” or counterfeit products? (By age group)
Multiple choice question (i.e. respondents were asked to select all options that apply)
| Reasons for not purchasing | 18-24 | 25-34 | 35-44 | 45-54 | 55+ |
|---|---|---|---|---|---|
| I would be worried about supporting criminal activity | 35.3% | 34.3% | 42.0% | 50.4% | 57.6% |
| Use of low cost labour or poor working conditions | 46.6% | 34.8% | 38.8% | 37.5% | 44.7% |
| I do not like the quality of ‘fake’ or counterfeit products | 49.9% | 46.3% | 44.0% | 42.3% | 35.9% |
| I would be worried that the product could have harmful effects | 30.3% | 24.2% | 33.1% | 31.4% | 33.7% |
| ‘Fake’ or counterfeit products harm/damage the real brands | 21.2% | 25.9% | 27.8% | 31.2% | 35.6% |
| The negative impact they have on the environment | 32.5% | 19.8% | 19.5% | 21.0% | 24.3% |
| I would be worried about getting in trouble | 13.4% | 17.4% | 20.7% | 19.4% | 17.2% |
| I do not like the design of ‘fake’ or counterfeit products | 23.4% | 22.5% | 20.3% | 16.4% | 13.9% |
| ‘Fake’ or counterfeit products can be similar in price to real ones | 17.4% | 12.0% | 12.4% | 8.0% | 8.1% |
| Fear of being judged by other people for purchasing a ‘fake’ or counterfeit | 22.6% | 14.9% | 13.8% | 8.0% | 4.7% |
| Other | 8.5% | 4.7% | 6.9% | 6.6% | 8.6% |
Base: Doesn’t currently purchase counterfeit products (n=4,305)
Methods of making counterfeit purchases
For each category in which they had made a counterfeit purchase, respondents were asked where they had made that purchase. Comparison to previous waves make it possible to identify potential shifts in shopping habits. Answer options have been grouped for in-person purchases (e.g. in-store, local markets, markets abroad) and online ones (e.g. online from a global e-commerce site, online from a smaller retailer, online from a seller abroad).
Compared to Wave 3, in-person counterfeit purchasing increased in several categories, such as “Sportswear from clubs/franchises” (+13 pp), “Electrical accessories” (+11 pp), and “Accessories excluding watches” (+10 pp). “Sportswear from clubs/franchises” was the only category where in-person counterfeit purchasing levels were higher than in Wave 1. In all other categories, they were either in line with or, in most instances, lower than the levels seen in Wave 1.
Compared to Wave 3, there was an increase in the online purchase of “Cosmetic and toiletry products” (+ 6 pp) and a decrease in those purchasing “Electrical accessories” (-6 pp), “Regular sportswear” (-6 pp), and “Sportswear from clubs/franchises” (-5 pp) online. All other categories remained within +/- 4 pp of Wave 3 levels.
When looking across all four waves, the sharp decline of in-person purchasing and the increase in online counterfeit purchasing that occurred between waves one and two were likely heavily influenced by the state of the pandemic. In Wave 4, while some categories are at a similar level to Wave 1 in terms of in-person purchasing, most remain somewhat below. Online purchasing continues to remain relatively stable at levels that are those seen in the pre-pandemic Wave 1.
Chart 9: Question. And in which of the following ways do you tend to purchase ‘fake’ or counterfeit products …? (By wave)
Results show NET of in-person purchasing.
| Product category | Wave 1 | Wave 2 | Wave 3 | Wave 4 |
|---|---|---|---|---|
| Cosmetic and toiletry products | 60.0% | 43.0% | 42.6% | 45.7% |
| Hygiene products | 68.0% | 51.0% | 54.7% | 53.3% |
| Clothing excluding sportswear | 67.0% | 46.0% | 52.3% | 54.7% |
| Footwear/shoes excluding sports footwear | 63.0% | 42.0% | 49.5% | 50.5% |
| Accessories excluding watches | 65.0% | 53.0% | 51.2% | 60.9% |
| Regular sportswear | 56.0% | 54.0% | 46.7% | 52.4% |
| Sportswear from clubs/franchises | 39.0% | 41.0% | 37.7% | 50.8% |
| Sports footwear (i.e. trainers) from sports or fashion brands | 70.0% | 45.0% | 49.8% | 45.7% |
| Electrical accessories | 41.0% | 40.0% | 29.2% | 40.4% |
Results show NET of online sources of purchasing.
| Product category | Wave 1 | Wave 2 | Wave 3 | Wave 4 |
|---|---|---|---|---|
| Cosmetic and toiletry products | 54.0% | 66.0% | 62.0% | 68.0% |
| Hygiene products | 47.0% | 66.0% | 68.0% | 63.6% |
| Clothing excluding sportswear | 46.0% | 60.0% | 59.0% | 57.4% |
| Footwear/shoes excluding sports footwear | 48.0% | 63.0% | 66.0% | 61.8% |
| Accessories excluding watches | 44.0% | 55.0% | 55.0% | 51.2% |
| Regular sportswear | 50.0% | 51.0% | 64.0% | 58.3% |
| Sportswear from clubs/franchises | 66.0% | 69.0% | 71.0% | 66.0% |
| Sports footwear (i.e. trainers) from sports or fashion brands | 48.0% | 66.0% | 61.0% | 61.9% |
| Electrical accessories | 70.0% | 76.0% | 78.0% | 71.5% |
Base for Wave 4: Counterfeit purchasers of each category: Cosmetic and toiletry products (n=212), Hygiene products (n=140), Clothing excluding sportswear (n=315), Footwear/shoes excluding sports footwear (n=160), Accessories excluding watches (n=191), Regular sportswear (n=138), Sportswear from clubs/franchises (n=95), Sports footwear (i.e. trainers) from sports or fashion brands (n=133), Electrical accessories (n=165)
Future counterfeiting purchasing
New for this year, three quarters (77%) indicated that they would be (NET) unlikely to purchase counterfeit products in the next two years.
Chart 10: Question. Overall, across any category you purchase, how likely would you be to purchase “fake” or counterfeit products in the next two years? (By sex and age group)
5-point scale question – The NET is a combination of ‘Very likely and ‘Somewhat likely’ with other answer options including ‘Neither likely nor unlikely’, ‘Somewhat unlikely’ and ‘Very unlikely’)
| Response | Respondents answering “very likely”/”somewhat likely” (NET likely %) |
|---|---|
| Total | 11.1% |
| Female | 9.0% |
| Male | 13.3% |
| 18-24 | 17.0% |
| 25-34 | 20.4% |
| 35-44 | 18.1% |
| 45-54 | 7.8% |
| 55+ | 4.2% |
Base: Total sample (n=5,072)
Unintentional counterfeit purchasing
Respondents were asked whether they had ever ‘unintentionally’ purchased a counterfeit good. Overall, 17% had done so with most (55%) of this group having done so over a year ago. This is in line with the first wave of the study where 16% had made an unintentional purchase.
At 21%, male respondents were 8% more likely to have done so than female respondents. Those aged 25-44 were also more likely to be unintentional purchasers. Between 24-26% of those aged 25-44 had done so, which fell to 19% in those aged 18-24, 18% in those aged 45-54 and 9% in the 55+.
Chart 11: Question. Have you ever unintentionally purchased “fake” or counterfeit products? (By sex and age group)
| Response | Respondents answering “yes” (%) |
|---|---|
| Total | 16.7% |
| Female | 13.0% |
| Male | 20.6% |
| 18-24 | 18.6% |
| 25-34 | 25.5% |
| 35-44 | 24.2% |
| 45-54 | 17.9% |
| 55+ | 8.8% |
Base: Total sample (n=5,072)
Chart 12: Question. When did you last unintentionally purchase a “fake” or counterfeit product?

Base: Unintentionally purchased a counterfeit product (n=846)
The 17% who had unknowingly purchased a counterfeit were asked which product categories they had purchased them in within the past year (respondents were only asked about the categories they had made purchases in). Chart 13 shows the proportion of consumers in each broad product category who had made a counterfeit purchase.
They were most likely to have unintentionally made purchases in “Clothing, footwear and accessories” (7%), “Sports” (7%), “Toys” (6%) and “Electricals” (6%). Respondents were less likely to have unintentionally purchased counterfeit “Beauty and hygiene” (4%) and “Alcohol” (3%) products.
Compared to the previous wave there seems to have potentially been a slight decrease in unintentional purchasing in some “Toys” (-2 pp). All other categories remained stable.
Chart 13: Question. Which, if any, of the following categories have you unintentionally purchased “fake” or counterfeit products for in the past year? (By wave)
| Product category | Wave 1 | Wave 2 | Wave 3 | Wave 4 |
|---|---|---|---|---|
| Beauty and hygiene | 3.5% | 4.2% | 4.0% | 3.9% |
| Clothing, footwear and accessories | 6.1% | 7.5% | 6.7% | 6.8% |
| Sports | 3.6% | 6.8% | 7.3% | 6.6% |
| Toys | 3.2% | 5.2% | 8.1% | 6.1% |
| Electricals | 3.2% | 5.9% | 6.3% | 6.1% |
| Alcohol | 0.7% | 2.3% | 3.5% | 2.6% |
Base for Wave 4: Unintentional counterfeit purchasers as a percentage of consumers in each category: Beauty and hygiene (n=186), Clothing, footwear and accessories (n=312), Sports (n=186), Toys (n=112), Electricals (n=208), Alcohol (n=101)
Alcohol purchasing
Due to the specific nature of counterfeit alcohol, in Wave 3 and 4 purchasers of legitimate alcohol products who had ever purchased counterfeits were asked a question regarding their awareness of counterfeit alcohol and purchasing habits that could mitigate the risk of unintentionally purchasing counterfeit alcohol products.
Over half of legitimate alcohol purchasers (51%) were not previously aware that there are counterfeit alcohol products. Those that expressed awareness were furthermore more likely to agree with the statement “I think I was aware” (28%) than with “I was definitely aware” (24%).
Respondents were most likely to not take any specific actions when buying alcohol. Others were cautious, checking the bottle, branding, and packaging for legitimacy. Some avoid overly cheap products, while a few consider the product’s origin.
Chart 14: Question. Do you take any of the following steps before or after purchasing alcohol products?
| Response | Overall (%) |
|---|---|
| I do not do anything specific | 38.3% |
| Not buy something if it seems too cheap | 21.0% |
| Buy alcohol products where the branding etc, is in English | 20.5% |
| Check the packaging looks legitimate | 19.1% |
| Check the branding looks legitimate | 18.2% |
| Check the bottle looks legitimate | 18.2% |
| Check where the product was made | 12.9% |
| Buy alcohol products where the branding etc. is in a language other than English | 9.2% |
Base: Alcohol consumers who have ever purchased counterfeits in any category (n=988)
Unintentional purchasing
The (n) of respondents who had made an unintentional purchase in any category were asked how they felt about it:
- the emotions felt are consistent with the previous wave - many respondents felt angry after their purchase, with this most likely to be directed at the person/company who sold them the product (38%) or themselves for not spotting it (36%)
- respondents were more likely to feel indifferent about their purchase (19%) than be angry at the authorities (14%) or the brand they had intended to purchase (14%)
- though anger was, by some way, the most common response to unintentionally purchasing a counterfeit item, a small proportion (13%) indicated that they were pleasantly surprised at the quality of the counterfeit product
Chart 15: Question. How did you feel after unintentionally purchasing “fake” or counterfeit product(s)? (By wave)
| Response | Wave 3 | Wave 4 |
|---|---|---|
| I felt angry at the person/company who sold me the ‘fake’ or counterfeit | 37.5% | 38.2% |
| I felt angry at myself for not spotting it | 36.5% | 35.9% |
| I felt indifferent about it | 18.8% | 18.8% |
| I felt angry at the brand/company whose product I thought I was buying | 10.9% | 14.2% |
| I felt angry at the authorities for allowing the sale | 15.3% | 14.2% |
| I was pleasantly surprised by how good the quality of the product was | 15.1% | 13.0% |
| Other | 3.6% | 2.4% |
Base for Wave 4: Unintentionally purchased a counterfeit product (n=846)
The base for this question is different to the previous one. It was asked to respondents who had unintentionally made a purchase across any product category in the past year and had taken action following this (e.g. had reported it to someone). They were asked about the main reason they reported the seller:
- the most common reason was to get a refund (42%), which was followed by those who weren’t happy with the quality of the product (28%) – in both instances, these percentages were 4 pp higher than in Wave 3
- less common reasons were wanting to stop the seller from operating (14%) or because of potential links to other criminal activity (14%), both of which were at a similar level to the previous wave
Chart 16: Question. After unintentionally purchasing a “fake” or counterfeit product you said you took an action. What was your main reason for reporting the seller of the fake product? (By wave)
| Response | Wave 3 | Wave 4 |
|---|---|---|
| To get a refund | 37.9% | 42.3% |
| The quality of the product | 24.2% | 28.4% |
| The seller’s potential links to other criminal activity | 12.5% | 13.8% |
| To attempt to stop the seller from operating | 16.0% | 13.9% |
| Other | 9.3% | 1.6% |
Base for Wave 4: Took an action after unintentionally purchasing a counterfeit product (n=323)
The base for this question is different to the previous one. Those who had unintentionally made a counterfeit purchase within the past year were asked specifically if they had ever used a reporting system:
- a fifth (20%) indicated that they had done so which was 5 pp lower than in Wave 3
- a further 42% expressed that they would use such a reporting system in the future
- a quarter (26%) felt that they would need to know more about the system, while just 12% said outright that they wouldn’t use one
Chart 17: Question. Most online platforms have reporting systems in relation to the sale of “fake” or counterfeit products, would you consider using these? (By wave)
| Response | Wave 3 | Wave 4 |
|---|---|---|
| Yes, I have used these previously | 24.7% | 20.2% |
| Yes, I would in the future | 41.4% | 42.2% |
| I would need to know more about the systems | 23.4% | 25.6% |
| No | 10.5% | 12.1% |
Base for Wave 4: Unintentionally purchased a counterfeit product (n=846)
The base for this question is different to the previous one. Those who had made an unintentional counterfeit purchase in the past year but chose not to use a reporting system were asked about the main reasons for this:
- the most common reasons were related to a lack of concern (34%); a similar proportion mentioned not knowing how to use the online reporting system (22%) or believing it would be too time-consuming (22%)
- a smaller number of respondents mentioned that they believed the platform would not take any action based on their report (11%)
- a relatively small percentage of respondents (7%) indicated that they wouldn’t use the reporting tool because they preferred to report it in a different way, such as to law enforcement
- there were some shifts compared to the previous wave, such as a 6 pp decrease in the number of respondents who believed that the platform would not take any action based on their report (it’s important to bear in mind the relatively small sample size [n=102] when making these comparisons)
Chart 18: Question. What is the main reason you would not consider using the online platform’s reporting system? (By wave)
| Response | Wave 3 | Wave 4 |
|---|---|---|
| I don’t care enough to report it | 29.5% | 33.7% |
| I don’t know how | 27.3% | 22.0% |
| Too time consuming | 17.8% | 22.0% |
| The platform won’t do anything with my report | 17.3% | 11.5% |
| I would report it using other means e.g. Law enforcement | 7.0% | 6.6% |
| Other | 1.1% | 4.3% |
Base for Wave 4: Had made an unintentional counterfeit purchase in the past year and wouldn’t consider using an online platform to report a counterfeit product (n=102)
Reporting
All 5,072 respondents were asked a series of questions regarding the reporting of counterfeit sources. These questions were first introduced in wave 3.
Respondents were asked if they had ever reported a source/site or individual for selling “fake” or counterfeit products, if they had ever considered doing so, or if they were aware that doing so was a possibility. Based on their answers, respondents were then asked a set of follow up questions regarding the outcome of any reports that had been made, which organisations were reported to, and the motivation behind taking action against counterfeits, as well as not taking action.
Types of action taken
The types of action that were taken were consistent with Wave 3:
- just over one in ten (11%) had previously reported either a source/site (7%) or an individual (6%) for selling “fake” or counterfeit products
- 9% had considered reporting a source (6%) and/or an individual (4%)
- the largest group, representing 39% of the sample, expressed that that they were unaware that “fake” or counterfeit products could be reported
Chart 19: Question. Have you ever reported/considered reporting a source/site or an individual who was selling “fake” or counterfeit products? (By wave)
| Response | Wave 3 | Wave 4 |
|---|---|---|
| I have reported a source/site before | 6.2% | 7.0% |
| I have reported an individual before | 5.4% | 5.8% |
| I have considered reporting a source/site before | 5.8% | 5.7% |
| I have considered reporting an individual before | 3.9% | 4.2% |
| No - I was aware that “fake” or counterfeit products could be reported but have not done so | 25.7% | 28.7% |
| No - I was not aware that “fake” or counterfeit products could be reported | 42.4% | 38.8% |
| Don’t know/not sure | 14.9% | 14.7% |
Base: Total sample (n=5,072)
Organisations reported to
The (n=554) respondents who had reported “fake” or counterfeit products were shown a list of organisations and asked, for each organisation: whether or not they were aware of the organisation, if they thought that infringement could be reported to them, and whether or not they had done so.
Respondents were most likely to have been aware that they could report “fake” or counterfeit items to the source of their purchase, and to have done so:
- 85% had reported (24%) or were aware they could report (60%) to the store in which they had brought the item while 82% either had reported (34%) or were aware they could report (48%) to the online platform where they had made the illegitimate purchase
- both the police (77%), a local trading standards department (77%) and the brand (72%) also had high levels of combined reporting and respondent awareness
- reporting and awareness of the ability to report was lowest for search engines (56%), Citizens Advice (61%) and Action Fraud (65%)
Chart 20: Question. Here are some bodies/organisations that you can report content infringement to. For each, tell us which option best represents your knowledge/relationship with them.
| Type | Aware and have reported to them | Aware that you can report to them | Unaware that you can report to them | Unaware of them | Total |
|---|---|---|---|---|---|
| A local trading standards department | 23.0% | 53.2% | 15.5% | 8.3% | 100.0% |
| Action Fraud | 20.2% | 45.2% | 16.0% | 18.7% | 100.0% |
| The police | 19.7% | 57.2% | 19.4% | 3.8% | 100.0% |
| Citizens Advice | 20.2% | 41.0% | 30.7% | 8.2% | 100.0% |
| Crime Stoppers | 17.0% | 49.8% | 23.7% | 9.6% | 100.0% |
| The online platform where you bought the item | 33.7% | 47.9% | 13.1% | 5.3% | 100.0% |
| The store where you bought the item | 24.5% | 60.2% | 10.8% | 4.5% | 100.0% |
| The brand | 21.0% | 51.1% | 21.7% | 6.2% | 100.0% |
| Search engine | 18.2% | 37.8% | 35.2% | 8.7% | 100.0% |
Base: Those who had reported a source/site or individual (n=554)
Outcome of actions
For each organisation, respondents who had reported a “fake” or counterfeit item were asked about the outcome of their action. Due to small sample sizes, these results should be interpreted with caution:
- a local trading standards department was the most likely to have taken action, having done so for 56% of respondents who had reported to them – however, fewer than one in ten (8%) had received a refund of their money
- Citizens Advice had taken action in 54% of cases, followed by the Police and Action Fraud, both at 53%
- all other organisations were known to have taken action in 47-51% of cases
- interestingly, respondents were most likely to receive a refund when reporting to the online platform where the purchase had been made or the shop where they had bought the item, even though these two options had some of the lowest levels of overall awareness
Chart 21: Question. Do you know if any action has been taken since you reported the source/site or individual?
| Type | Yes, action has been taken and I received my money back | Yes, action has been taken | No, to my knowledge action has not yet been taken | I am unaware if action has or will be taken | Total |
|---|---|---|---|---|---|
| A local trading standards department | 8.4% | 47.7% | 26.8% | 17.1% | 100.0% |
| Action Fraud | 9.5% | 43.7% | 25.0% | 21.9% | 100.0% |
| The police | 8.9% | 44.3% | 28.9% | 17.8% | 100.0% |
| Citizens Advice | 5.6% | 48.3% | 28.7% | 17.3% | 100.0% |
| Crime Stoppers | 3.1% | 44.1% | 32.5% | 20.3% | 100.0% |
| The online platform where you bought the item | 17.1% | 31.9% | 27.6% | 23.4% | 100.0% |
| The store where you bought the item | 13.9% | 34.5% | 28.7% | 22.9% | 100.0% |
| The brand | 4.6% | 45.1% | 25.9% | 24.5% | 100.0% |
| Search engine | 2.8% | 48.2% | 30.5% | 18.5% | 100.0% |
Base: Those who had reported to each organisation (n=74-159)
Reasons for and against taking action
Those who had taken action or have considered doing so were also asked their reasons for doing so. Results were consistent with the previous wave, with moral issues (45%) the most prominent concern, followed by being personally affected by fraud/cybersecurity (34%) or malware/viruses on their devices (26%).
Chart 22: Question. Why did you report or consider reporting a source/site or an individual who was selling “fake” or counterfeit products? (By wave)
| Response | Wave 3 | Wave 4 |
|---|---|---|
| I have moral issues with those selling “fake” or counterfeit products | 43.9% | 44.9% |
| Due to concerns about or being personally affected by malware, viruses etc. on devices | 30.1% | 26.4% |
| Due to concerns about or being personally affected by fraud or cyber security | 35.1% | 33.6% |
| To get my money back on “fake” or counterfeit products I had knowingly purchased | 11.9% | 16.0% |
| To get my money back on “fake” or counterfeit products I had unknowingly purchased | 22.3% | 20.7% |
| Other | 3.1% | 3.7% |
Base: Those who had reported or considered reporting a source/site or individual (n=902)
Those who had not taken action were also asked their reasons for doing so:
- slightly more than a third (35%) expressed that, to their knowledge, they had never come across anyone selling “fake” or counterfeit items
- other common reasons related to awareness – 20% did not know who/where to report to, while 17% did not know that reporting was an option
Chart 23: Question. Why have you never reported a source/site or individual who was selling “fake” or counterfeit products? (By wave)
| Response | Wave 3 | Wave 4 |
|---|---|---|
| To my knowledge, I have never come across anyone selling “fake” or counterfeit products | 34.8% | 35.3% |
| I do not know who/where to report to | 19.9% | 19.8% |
| I did not know reporting was an option | 16.9% | 16.8% |
| I do not think me reporting it will make a difference/impact | 13.1% | 13.1% |
| I do not have the time | 7.5% | 6.7% |
| Reporting process was unclear/too complicated | 6.1% | 6.0% |
| I am worried that it might have a negative impact on me (e.g. if the infringers find out I reported them) | 5.1% | 5.3% |
| Other | 3.1% | 3.5% |
| None of the above | 15.9% | 16.0% |
Base: Those who had not reported a source/site or individual (n=4,518)
An in-depth look at price
Respondents who were open to purchasing counterfeits (i.e. they either currently did so or were considering doing so in the future) were asked about three different pricing scenarios for counterfeit products using the Van Westendorp pricing model. This is where, for each scenario, they were asked at what point the product would be too expensive, expensive, cheap or too cheap. They were told the price of the genuine product in each of these scenarios.
Scenario 1:
Chart 24: A “fake” or counterfeit bottle of perfume of a brand which you or someone you know likes. The ‘real’ item would usually retail at £70.

For a counterfeit perfume worth £70 the optimal price point that respondents were willing to pay was £25 (36% of the value of the genuine items). The price point of marginal cheapness (i.e. when people would start to doubt the quality of the product) was £20.50 while the point of expensiveness (i.e. when the cost is becoming a major concern) was £35. The point of indifference (i.e. when they start to feel the price is starting to become expensive) was £30.
Scenario 2:
Chart 25: A “fake” or counterfeit kit for your favourite football team that you or someone you know supports. The ‘real’ item would usually retail at £100.

For a counterfeit football kit worth £100 the optimal price point that respondents were willing to pay was £32.50 (32.5% of the value of the genuine items). The price point of marginal cheapness (i.e. when people would start to doubt the quality of the product) was £29 while the point of expensiveness (i.e. when the cost is becoming a major concern) was £49. The point of indifference (i.e. when they start to feel the price is starting to become expensive) was £40.
Scenario 3:
Chart 26: A “fake” or counterfeit handbag of a brand that you or someone you know likes. The ‘real’ item would usually retail at £1,500.

For a counterfeit handbag worth £1,500 the optimal price point that respondents were willing to pay was £200 (13% of the value of the genuine items). The price point of marginal cheapness (i.e. when people would start to doubt the quality of the product) was £150 while the point of expensiveness (i.e. when the cost is becoming a major concern) was £350. The point of indifference (i.e. when they start to feel the price is starting to become expensive) was £250.
4. Category Insights
This section provides infographics that explore counterfeit purchasing, encompassing both intentional and unintentional instances, with infographics at both broad and individual category levels. It furnishes data on the incidence rate of counterfeit purchasing at an overall level and among sub-groups. Additionally, it examines where respondents are making these purchases, their reasons for doing so, the amount they spend, and the counterfeit brands corresponding to the goods they purchase.
Intentional counterfeit purchasing
Beauty and hygiene
Here are the key highlights from the beauty & hygiene infographic, which includes insights from individuals who have deliberately purchased counterfeit goods:
- 94% of the total sample had purchased a beauty and hygiene product in the last year
- 7% of those who purchased beauty and hygiene products in the last year had purchased counterfeit products in that category
- 6% of those who purchased hygiene products in the last year had purchased counterfeit products in that category
Of those who had purchased beauty and hygiene counterfeits in the last year:
Sex:
- male: 6%
- female: 7%
Age:
- 18-24: 15%
- 25-34: 13%
- 35-44: 11%
- 45-54: 4%
- 55+: 3%
Social Grade:
- ABC1: 7%
- C2DE: 6%
Passion level for category:
- high: 12%
- medium: 7%
- low: 3%

This infographic highlights key findings about cosmetics and toiletry products, based on insights from the 6% of consumers in this category who knowingly purchased counterfeit products within this category in the past year. All figures presented here pertain solely to the purchase of counterfeit goods within this category.
Purchase frequency:
- monthly (14%)
- every 3 months (20%)
- every 6 months (19%)
- once a year (19%)
- less than once a year (28%)
Recipients:
- myself (78%)
- family (29%)
Reasons for purchase:
- cheaper price (48%)
- similar quality (39%)
- save money (36%)
Average annual spend: £137
Top counterfeited brands:
- Calvin Klein (25%)
- Chanel (21%)
- Hugo Boss (20%)
Source of purchase:
- global e-commerce (31%)
- in-store retailers (28%)
- social media (27%)
If unavailable, would:
- buy similar, cheaper (24%)
- buy from brand (50%)
- go without (20%)
- unsure (7%)

This infographic highlights key findings about hygiene products, based on insights from the 3% of consumers in this category who knowingly within this category in the past year. All figures presented here pertain solely to the purchase of counterfeit goods within this category.
Frequency of purchase:
- monthly (27%)
- every 3 months (31%)
- every 6 months (19%)
- once a year (7%)
- less than once a year (16%)
Recipients:
- myself (75%)
- family (33%)
Reasons for purchase:
- cheaper price (37%)
- save money (34%)
- similar quality (31%)
Average annual spend: £190
Top counterfeited brands:
- Head & Shoulders (33%)
- Dove (32%)
- Carex (26%)
Source of purchase:
- in-store, not from brand (42%)
- global e-commerce (31%)
- social media (28%)
If counterfeits were not available, they would:
- buy similar, cheaper (49%)
- buy from brand (36%)
- go without (6%)
- unsure (9%)

Qualitative Insight – Cosmetics, toiletry and hygiene products
The importance of cosmetic, toiletry and hygiene products for consumers
For many participants, beauty and hygiene products were an important part of daily life and said to be intrinsic to their sense of wellbeing, confidence, identity and even empowerment as mentioned especially by a few female participants. These products were very much involved in a sense of self care, both from a practical side (i.e. keeping clean) but also an emotional side (i.e. helping boost confidence either through skincare, make-up or perfumes and aftershaves).
Most commonly purchased counterfeit cosmetic, toiletry and hygiene products
Though of course a small sample, by far the most purchased types of counterfeit beauty and hygiene product in our community were perfumes and aftershaves. This was because of the reportedly high price of original versions of branded perfumes and aftershaves and the huge savings which could be made by purchasing counterfeit versions which replicated the scents of luxury brands quite accurately. These types of counterfeit products were also seen as relatively risk free in comparison with other products such as skincare, make-up etc.
There were only a couple of reports of any other products in this year’s Online Community, namely a few mentions of make-up and skincare. Most of these mentions were in fact of replica own brand products bought from high street stores rather than counterfeits. These sources were still deemed reliable or at least not dangerous to people’s health, whereas purchasing counterfeit skincare or make-up products did concern many people who worried about the potential damage which could be done to their skin.
Reasons for purchasing counterfeit cosmetic, toiletry and hygiene products
As in previous years, the key reason for purchasing counterfeit cosmetic, toiletry and hygiene products is cost and looking for products which are going to save people money. Many participants were feeling a financial strain and were looking for ways to save money across all of their outgoings, meaning counterfeit beauty and hygiene products were particularly attractive, especially as they were products which participants made use of on a near daily basis.
Another factor for a minority was curiosity and simply trying things out, even without the end goal being as financially motivated. A few simply saw the possibility of trying out products in a different way and from different sources and wanted to try counterfeit products in order to see whether they could be an option.
Changes to purchases of counterfeit cosmetic, toiletry and hygiene products
The context to this particular wave was one in which many were struggling with budgets. Though no longer a year of COVID-19 related lockdowns as in previous waves but with the war in Ukraine continuing to inflate prices, many said that the previous hardship of the pandemic was now being exacerbated by a rise in prices across various products.
Therefore, some said their purchases of counterfeits had gone up because they had started shopping online more since the pandemic and came across more counterfeit items, or because they wanted to continue to enjoy little luxuries like their favourite self-care staples such as perfumes and fragrances whilst cutting down on cost.
A few said they had not bought either more nor less counterfeits, sticking to a certain regularity of purchasing over the years, with the reason as ever to save money on certain purchasers.
Others said they were overall trying to save money across all products regardless of their origin and had therefore bought less counterfeit products than previously.
Sources of counterfeit cosmetic, toiletry and hygiene products
Most bought from e-commerce sites, including online marketplaces, auction sites and mobile shopping apps. This was the most convenient place to purchase such products but also offered a level of control to consumers due to the fact that they could read reviews left by others and decide whether they felt a seller seemed reliable. Most were happy with this way of purchasing, rarely coming across any issues. Though one thing mentioned when asked about the security of payments, was that with online marketplaces such as eBay, participants felt relatively protected in regard to their payments whereas payments through Facebook marketplace involved risks.
In addition to online, some also bought counterfeit beauty and hygiene products in person; car boot sales and markets were mentioned by a few. These participants thought of these purchasing occasions as an opportunity to see and feel the products before purchasing them or sometimes even part of a day out.
The most common way participants had discovered these sources were either through googling or through word of mouth and ads online.
To save money and to get similar quality perfume but with half of the price. Before the pandemic I never tried cheaper perfumes, so quality and cheaper prices are 2 main reasons.
Male, 35, Beauty and Hygiene
The main reason is due to cost. The products are much cheaper and you can get similar quality to what you get from the actual manufacturer.
Male, 31, Beauty and Hygiene
Because they are cheaper. It means you get more for your money and can spend money on other things that you may need.
Female, 34, Beauty and Hygiene
Clothing, footwear and accessories
Here are the key highlights from the clothing, footwear and accessories infographic, which includes insights from individuals who have deliberately purchased counterfeit goods:
- 90% of the total sample had purchased a clothing, footwear and accessories product in the last year
- 12% of those who purchased clothing, footwear and accessories in the last year had purchased counterfeit products in that category
- 8% of those who purchased clothing (excluding sportswear) in the last year had purchased counterfeit products in that category
- 5% of those who purchased footwear/shoes (excluding sports footwear) in the last year had purchased counterfeit products in that category
- 10% of those who purchased accessories (excluding watches) in the last year had purchased counterfeit products in that category
- 9% of those who purchased watches in the last year had purchased counterfeit products in that category
Of those who had purchased clothing, footwear and accessories counterfeits in the last year:
Sex:
- male: 14%
- female: 11%
Age:
- 18-24: 16%
- 25-34: 25%
- 35-44: 18%
- 45-54: 10%
- 55+: 5%
Social Grade:
- ABC1: 12%
- C2DE: 13%
Passion level for category:
- high: 23%
- medium: 12%
- low: 7%

This infographic highlights key findings about clothing products, based on insights from the 8% of consumers in this category who knowingly purchased counterfeit products within this category in the past year. All figures presented here pertain solely to the purchase of counterfeit goods within this category.
Frequency of purchase:
- monthly (9%)
- every 3 months (13%)
- every 6 months (19%)
- once a year (17%)
- less than once a year (42%)
Recipients:
- myself (76%)
- family (28%)
Reasons for purchase:
- cheaper price (53%)
- similar design (41%)
- spend less (39%)
Average annual spend: £80
Top counterfeited brands:
- Gucci (28%)
- Louis Vuitton (19%)
- High street brands (19%)
Source of purchase:
- global e-commerce (30%)
- local markets on holiday (25%)
- local markets in the UK (20%)
If counterfeits were not available, they would:
- buy similar, cheaper (36%)
- go without (33%)
- buy from brand (20%)
- unsure (11%)

This infographic highlights key findings about footwear and shoe products, based on insights from the 5% of consumers in this category who knowingly purchased counterfeit products within this category in the past year. All figures presented here pertain solely to the purchase of counterfeit goods within this category.
Frequency of purchase:
- monthly (14%)
- every 3 months (14%)
- every 6 months (16%)
- once a year (14%)
- less than once a year (43%)
Recipients:
- myself (79%)
- family (22%)
Reasons for purchase:
- cheaper price (53%)
- spend less (40%)
- similar design (39%)
Average annual spend: £183
Top counterfeited brands:
- Gucci (34%)
- Ralph Lauren (17%)
- Timberland (17%)
Source of purchase:
- global e-commerce (33%)
- in-store, not from brand (20%)
- local markets in the UK (20%)
If counterfeits were not available, they would:
- buy from brand (49%)
- buy similar, cheaper (28%)
- go without (9%)
- unsure (6%)

This infographic highlights key findings about accessories products, based on insights from the 10% of consumers in this category who knowingly purchased counterfeit products within this category in the past year. All figures presented here pertain solely to the purchase of counterfeit goods within this category.
Frequency of purchase:
- monthly (10%)
- every 3 months (7%)
- every 6 months (14%)
- once a year (19%)
- less than once a year (49%)
Recipients:
- myself (77%)
- family (22%)
Reasons for purchase:
- cheaper price (51%)
- spend less (43%)
- design looks similar (42%)
Average annual spend: £83
Top counterfeited brands:
- Gucci (34%)
- Louis Vuitton (29%)
- Chanel (21%)
Source of purchase:
- local markets on holiday (29%)
- global e-commerce (24%)
- local markets in UK (22%)
If counterfeits were not available, they would:
- go without the product (36%)
- buy a similar product from a cheaper brand (34%)
- buy the product directly from the brand (20%)
- not sure/don’t know (10%)

Here are the key highlights from the watches products infographic, based on insights from the 9% of consumers in this category who knowingly purchased counterfeit products in the past year in this category. All figures in the infographic pertain to the purchase of counterfeit goods in this category.
Frequency of purchase:
- monthly (17%)
- every 3 months (15%)
- every 6 months (14%)
- once a year (13%)
- less than once a year (41%)
Recipients:
- myself (74%)
- family (26%)
Reasons for purchase:
- cheaper price (49%)
- design looks similar (41%)
- spend less (38%)
Average annual spend: £223
Top counterfeited brands:
- Apple (38%)
- Rolex (21%)
- Burberry (17%)
Source of purchase:
- global e-commerce (34%)
- social media (24%)
- online sellers abroad (23%)
If counterfeits were not available, they would:
- buy a similar product from a cheaper brand (36%)
- go without the product (29%)
- buy the product directly from the brand (26%)
- not sure/don’t know (7%)

Qualitative Insight – Clothing, shoes and accessories
The importance of clothing, shoes and accessories for consumers
This category of products was extremely important to participants, as a daily necessity but also something which expressed their personality and could make participants feel comfortable in themselves.
Most popular types of counterfeit clothing, shoes and accessories
Participants bought a wide variety of products across the overall clothing, shoe and accessories spectrum. From T-shirts and jumpers replicating well-known premium brands, to one-off leather jackets, trainers and jackets. Watches were also popular, as well as handbags and sunglasses, all imitating major brands who participants couldn’t otherwise afford.
Reasons for purchasing counterfeit clothing, shoes and accessories
For the participants in our Online Community, price was the most commonly mentioned factor motivating them to purchase counterfeits. They felt that for a much cheaper price they were able to get something which looked the same and which they believed to be of good quality.
A few said that often the counterfeit items lasted for a good time and that therefore, they didn’t see the benefit of paying for a brand when they received the same aesthetics and sometimes even the quality to last matching the real product also. A couple even mentioned enjoying going around markets on holiday and that sometimes picking up a counterfeit item was a part of the experience of being at certain locations abroad.
Despite the obvious price benefits, there were nonetheless concerns mentioned; most commonly around the quality of products, but also a few mentions of concern for how the products were made and who by, as well as a few mentions of the risk of being scammed. These show that while purchases are seen as financially necessary sometimes, people are not always comfortable with them.
Changes to purchases of counterfeit clothing, shoes and accessories
Some participants directly cited the increase in prices over the last couple of years and said that their purchasing of counterfeit goods had increased out of necessity and having to cut down on spending. For some, this overlapped with circumstantial events such as children growing and needing new clothing regularly which stretched budgets even further.
Only a couple said their purchasing had decreased, due to their salaries picking up since the pandemic but many said they were still purchasing the same amount of counterfeits as before, seeing a need to buy cheaper items or unwilling to pay the prices for original products.
Sources of counterfeit clothing, shoes and accessories
Most participants bought counterfeit clothing, shoes and accessories online but interestingly for this category, there were a few who said they exclusively bought these counterfeit products when at markets abroad on holiday, a couple even reporting going back to the same country (in this instance, Turkey) and buying there every time. Added to these physical sources were markets in the UK (a couple of participants from Manchester mentioned Cheetham Market and this having been somewhere they bought regularly before the police raids on this area) as well as car boot sales which allowed some participants who took these routes to touch the fabric and material first.
Regarding online sources, eBay, Amazon, Etsy and Alibaba were commonly mentioned as go-to sources on which participants could browse easily and read up through reviews left by others, informing a decision to purchase. These sites were often discovered through Google searches, word of mouth recommendations or social media adverts on Instagram, Facebook etc. A couple of participants mentioned seeing people review their counterfeit purchases and where they brought them from on TikTok.
I’m trying to save money across all fronts. I have purchasing counterfeits a little bit more on a few things for my kids, just a couple of pairs of trainers and bags that would have been much more expensive for the real thing.
Male, 52, Clothing, accessories and footwear
It has definitely had an impact on how I spend my money as the cost of living crisis is rising. I’ve started buying cheaper and less food just to get by. I’m purchasing more counterfeit products as it saves me more money.
Female, 18, Clothing, accessories and footwear
I have had to become more savvy with how I spend my money, from everything from eating out and buying groceries, to searching for things with discounts. I have therefore bought more counterfeit products as I can’t afford or justify the genuine items.
Female, 39, Clothing, accessories and footwear
Sports
Here are the key highlights from the sports infographic, which includes insights from individuals who have deliberately purchased counterfeit goods:
- 56% of the total sample had purchased a sports product in the last year
- 12% of those who purchased sports products in the last year had purchased counterfeit products in that category
- 7% of those who purchased regular sportswear in the last year had purchased counterfeit products in that category
- 14% of those who purchased sportswear from clubs/franchises in the last year had purchased counterfeit products in that category
- 7% of those who purchased sports footwear (i.e. trainers) from sports or fashion brands in the last year had purchased counterfeit products in that category
- 8% of those who purchased sports equipment including for home workout in the last year had purchased counterfeit products in that category
Of those who had purchased sports counterfeits in the last year:
Sex:
- male: 15%
- female: 9%
Age:
- 18-24: 12%
- 25-34: 20%
- 35-44: 16%
- 45-54: 9%
- 55+: 4%
Social Grade:
- ABC1: 12%
- C2DE: 13%
Passion level for category:
- high: 23%
- medium: 12%
- low: 6%

Here are the key highlights from the regular sportswear products infographic, based on insights from the 7% of consumers in this category who knowingly purchased counterfeit products in the past year in this category. All figures in the infographic pertain to the purchase of counterfeit goods in this category.
Frequency of purchase:
- monthly (12%)
- every 3 months (15%)
- every 6 months (18%)
- once a year (15%)
- less than once a year (40%)
Recipients:
- myself (76%)
- family (27%)
Reasons for purchase:
- cheaper price (49%)
- spend less (40%)
- similar quality (39%)
Average annual spend: £152
Top counterfeited brands:
- Nike (49%)
- Adidas (46%)
- Puma (23%)
Source of purchase:
- global e-commerce (33%)
- local markets on holiday (26%)
- local market in the UK (20%)
If counterfeits were not available, they would:
- buy a similar product from a cheaper brand (46%)
- go without the product (21%)
- buy the product directly from the brand (19%)
- not sure/don’t know (14%)

Here are the key highlights from sportswear from clubs/franchises products infographic, based on insights from the 14% of consumers in this category who knowingly purchased counterfeit products in the past year in this category. All figures in the infographic pertain to the purchase of counterfeit goods in this category.
Frequency of purchase:
- monthly (15%)
- every 3 months (23%)
- every 6 months (11%)
- once a year (20%)
- less than once a year (31%)
Recipients:
- myself (70%)
- family (36%)
Reasons for purchase:
- cheaper price (41%)
- spend less (39%)
- similar design (37%)
Average annual spend: £141
Top counterfeited brands:
- Premier League team sportswear (48%)
- National team (e.g. England, Wales) sportswear (23%)
- Bundesliga team sportswear (22%)
Source of purchase:
- social media (27%)
- global e-commerce (25%)
- smaller retailer online (23%)
If counterfeits were not available, they would:
- buy the product directly from the brand (31%)
- buy a similar product from a cheaper brand (30%)
- go without the product (30%)
- not sure/don’t know (9%)

Here are the key highlights from sports footwear products infographic, based on insights from the 7% of consumers in this category who knowingly purchased counterfeit products in the past year in this category. All figures in the infographic pertain to the purchase of counterfeit goods in this category.
Frequency of purchase:
- monthly (14%)
- every 3 months (9%)
- every 6 months (17%)
- once a year (22%)
- less than once a year (39%)
Recipients:
- myself (73%)
- family (26%)
Reasons for purchase:
- cheaper price (52%)
- spend less (35%)
- similar design (32%)
Average annual spend: £175
Top counterfeited brands:
- Nike (47%)
- Adidas (36%)
- Converse (18%)
Source of purchase:
- social media (25%)
- global e-commerce (23%)
- local markets on holiday (17%)
If counterfeits were not available, they would:
- buy a similar product from a cheaper brand (37%)
- go without the product (31%)
- buy the product directly from the brand (23%)
- not sure/don’t know (9%)

Qualitative Insight – Sportswear
The importance of sportswear for consumers
Though more functional than regular clothing, sportswear was an important part of many participants’ daily lives, with joggers, trainers and sports t-shirts representing items of clothing many spent considerable time in on a daily basis for comfort as well as doing exercise. Sportswear from clubs and franchises was also important with football shirts especially popular for children as well as other fans to show their support for certain teams.
Most popular types of counterfeit sportswear
The most commonly purchased counterfeit sportswear items included t-shirts, tracksuit bottoms, football kits and trainers. T-shirts made for popular counterfeit products because brands such as Adidas, Nike and Under Armour were all desirable brands to have on this item of clothing and many said that t-shirts were hard to tell apart from the real thing. A few mentioned that this was not the case for trainers however, as these were seen to be ‘harder to get away with’ because it was easier to tell that they were counterfeit and so some were nervous around quality regarding counterfeit trainers. Nonetheless, these were a popular item for our small qualitative sample this wave.
Counterfeit football kits were mentioned by some people as these were perceived to be expensive to buy new and were updated so regularly with every season that they felt it would be impossible to keep up. There was mention of the fact that very rich clubs produced these kits and that it wouldn’t make a difference if some people bought counterfeits.
Reasons for purchasing counterfeit sportswear
Price was the main motivation for participants in this Online Community to purchase counterfeit sportswear, as established sports brands which were popular (such as Adidas, Nike, Under Armour etc.) were seen as expensive to buy on a regular basis – things like sports t-shirts or joggers were aspects of daily life for some.
In regard to influences on purchasing, some mentioned that their children wanted certain items (especially trainers or football kits etc.) in order to keep up with trends and so these became factors for some parents.
Changes to purchases of counterfeit sportswear
Participants in this small qualitative sample reported their purchasing of counterfeit sportswear items had either stayed the same or increased in the last year, with a few mentioning that they had started purchasing counterfeit versions of things like joggers, trainers and football kits for the first time this year. This was all attributed to the general context of higher prices across a variety of consumer goods.
Sources of counterfeit sportswear
The most common sources of counterfeit sportswear were e-commerce and social media sites such as Amazon, eBay and Facebook Marketplace. Often these were recommended as sources by friends or participants stumbled upon them whilst searching online. Generally participants used these large forums to double check on reviews about products before purchasing them. However, as mentioned elsewhere in the community, there was mention of Facebook not necessarily being the most reliable or secure option for payments. Though one mentioned going to pick up a product found on Facebook in person and only paying once there and having inspected it.
Some still preferred to purchase counterfeit sportswear items in person. There was mention of ‘certain streets’ in Manchester where it was easy to purchase counterfeits, as well as having a friend with ‘connections’ who could acquire counterfeit football shirts. These methods weren’t necessarily the most widespread as they were contingent on proximity to such markets or having such contacts, but when available to people, they were seen as reliable due to being able to see, touch and ask about products first.
To save money instead of buying the real thing. There are really good fakes or counterfeits nowadays that I don’t think you can really tell the difference.
Female, 34, Sportswear
It’s mostly the price vs quality ratio and wanting to spend less money on shopping these days. Kids want to have so many things, so that is a big reason for me to look for counterfeit products because they are very cheap.
Male, 26, Sportswear
[I buy them] For my kids to wear the latest football kits and be on trend. They are often good and cheaper versions of the real thing. Friends also get their kits online and this has encouraged me to also. As the football clubs are already making millions I can justify it. I would rather be more financially stable than spend lots on a kit I can get in other ways.
Female, 39, Sportswear
Toys
Here are the key highlights from the toys infographic, which includes insights from individuals who have deliberately purchased counterfeit goods:
- 36% of the total sample had purchased a toy products in the last year
- 9% of those who purchased toy products in the last year had purchased counterfeit products in that category
- 8% of those who purchased dolls/action figure toy products in the last year had purchased counterfeit products in that category
- 6% of those who purchased toy building set products in the last year had purchased counterfeit products in that category
- 8% of those who purchased merchandise from TV/film (excluding dolls/action figures) in the last year had purchased counterfeit products in that category
Of those who had purchased toy counterfeits in the last year:
Sex:
- male: 13%
- female: 5%
Age:
- 18-24: 9%
- 25-34: 15%
- 35-44: 14%
- 45-54: 3%
- 55+: 2%
Social Grade:
- ABC1: 10%
- C2DE: 8%
Passion level for category:
- high: 21%
- medium: 8%
- low: 2%

Here are the key highlights from the toys products infographic, based on insights from the 9% of consumers in this category who knowingly purchased counterfeit products in the past year in this category. All figures in the infographic pertain to the purchase of counterfeit goods in this category.
Frequency of purchase:
- monthly (20%)
- every 3 months (23%)
- every 6 months (25%)
- once a year (10%)
- less than once a year (22%)
Recipients:
- family (42%)
- myself (46%)
Reasons for purchase:
- spend less (28%)
- similar design (27%)
- easy to purchase counterfeit products (26%)
Average annual spend: £278
Top counterfeited brands:
- Lego (including Duplo and themed Lego sets) (37%)
- Disney toys/merchandise (29%)
- Marvel toys/merchandise (25%)
Source of purchase:
- global e-commerce (37%)
- online from a smaller retailer (28%)
- social media (27%)
If counterfeits were not available, they would:
- buy the product directly from the brand (38%)
- buy a similar product from a cheaper brand (37%)
- go without the product (21%)
- not sure/don’t know (4%)

Electricals
Here are the key highlights from the electricals infographic, which includes insights from individuals who have deliberately purchased counterfeit goods:
- 67% of the total sample had purchased electrical products in the last year
- 9% of those who purchased electrical products in the last year had purchased counterfeit products in that category
- 6% of those who purchased beauty/hygiene related electrical products in the last year had purchased counterfeit products in that category
- 8% of those who purchased electrical accessory products in the last year had purchased counterfeit products in that category
- 4% of those who purchased electrical device products in the last year had purchased counterfeit products in that category
- 8% of those who purchased DVD/Blu-Ray products in the last year had purchased counterfeit products in that category
Of those who had purchased electrical counterfeits in the last year:
Sex:
- male: 12%
- female: 6%
Age:
- 18-24: 10%
- 25-34: 19%
- 35-44: 13%
- 45-54: 6%
- 55+: 2%
Social Grade:
- ABC1: 10%
- C2DE: 9%
Passion level for category:
- high: 19%
- medium: 8%
- l ow: 3%

Here are the key highlights from the electrical accessory products infographic, based on insights from the 8% of consumers in this category who knowingly purchased counterfeit products in the past year in this category. All figures in the infographic pertain to the purchase of counterfeit goods in this category.
Frequency of purchase:
- monthly (16%)
- every 3 months (14%)
- every 6 months (17%)
- once a year (20%)
- less than once a year (33%)
Recipients:
- myself (79%)
- family (26%)
Reasons for purchase:
- cheaper price (47%)
- spend less (38%)
- similar quality (32%)
Average annual spend: £148
Top counterfeited brands:
- Apple (47%)
- Samsung (34%)
- Bose (15%)
Source of purchase:
- global e-commerce (50%)
- in-store from a smaller retailer (21%)
- social media (18%)
If counterfeits were not available, they would:
- buy a similar product from a cheaper brand (57%)
- buy the product directly from the brand (28%)
- go without the product (9%)
- not sure/don’t know (6%)

Qualitative Insight – Electricals
The importance of electrical products for consumers
Rather than any emotional attachment (as there was with other categories), participants’ relationships to electrical products were more functional in nature – except for in their relationships to items such as smartphones, which were seen as some of participants’ most precious belongings. Other items such as headphones or laptop/phone chargers were items participants relied upon, but didn’t have a particular connection to.
Most popular types of counterfeit electrical products
The types of counterfeit electrical items most commonly purchased within the Online Community this year were headphones and earbuds replicating brands and models seen as expensive and often had to be replaced (due to losing one or one breaking etc.) and which therefore some preferred to purchase more cheaply.
Aside from headphones, chargers for phones and laptops were commonly bought as counterfeits, and this year there were also a few mentions of Apple Macs and tablets which some said they bought as counterfeits at a much cheaper price and then simply replaced when inevitably they didn’t last as long.
Reasons for purchasing counterfeit electricals
Reasons for purchasing counterfeit electrical items revolved around price – many said that counterfeit electrical items could be bought for a much lower price but with decent quality, meaning that they overall seemed better value for money. Some also felt that some items such as chargers needed replacing regularly and so were easier to purchase as counterfeits. Some also mentioned that their children were specific about the exact sorts of products they liked in relation to headphones, etc, and this was another reason why parents leant towards counterfeit products, to satisfy these expectations.
A few did express concerns about some of these items, mainly around quality and a couple reported that some had caught fire on occasion, but this had not put these particular participants off, they simply looked for better quality counterfeits since such incidents.
Changes to purchasing of counterfeit electricals
In regard to any changes in purchases of counterfeits, there was a mixed picture. For many, the rate at which they were purchasing counterfeit electrical products had stayed the same. Some reported that they were purchasing more counterfeit electricals than previously, due to constraints on costs at present. But some said they had been purchasing less this year as they had less need for as many chargers, docks, headphones, etc, than they had done during the years of the pandemic when they had been working from home so much.
Sources of counterfeit electrical products
Participants reported purchasing many of their counterfeit electrical products online, from sites such as Amazon, eBay and AliExpress. These sites were seen to be convenient with quick delivery times. Some said they often checked the reliability and ratings of buyers to check that they would receive their products in the condition expected - or receive them at all. Others, however, said they didn’t care too much about the ratings or reviews of sellers online for small products such as basic headphones or chargers as these were often at such a low price that the stakes were not seen to be as high.
Some also reported getting counterfeit electricals from local markets or from small stores on local high streets where they could see and feel the product they were buying and take it straight home with them.
They’re much cheaper and are easy to get. Also the kids always seem to want the next big thing.
Female, 49, Electricals
[I buy counterfeit electricals] in order to save myself money and be able to spend on bigger, branded electrical items. Also these items seem to be getting much higher quality than before.
Female, 28, Electricals
Low cost and good build. The products cost 80 to 90% less. If I lose them or they go missing I’m not upset as much as it’s only a cheap item. Price really is the main reason as they last just as long.
Male, 33, Electricals
Alcohol
Here are the key highlights from the alcohol infographic, which includes insights from individuals who have deliberately purchased counterfeit goods:
- 77% of the total sample had purchased alcohol products in the last year.
- 5% of those who purchased alcohol products in the last year had purchased counterfeit products in that category
- 3% of those who purchased bottles of wine/champagne in the last year had purchased counterfeit products in that category
- 3% of those who purchased bottles of spirits (e.g. vodka) in the last year had purchased counterfeit products in that category
- 3% of those who purchased bottles/cans of beer or cider in the last year had purchased counterfeit products in that category
Of those who had purchased alcohol counterfeits in the last year:
Sex:
- male: 6%
- female: 3%
Age:
- 18-24: 7%
- 25-34: 12%
- 35-44: 10%
- 45-54: 2%
- 55+: 1%
Social Grade:
- ABC1: 5%
- C2DE: 5%
Passion level for category:
- high: 15%
- medium: 5%
- low: 2%

Here are the key highlights from the alcohol products infographic, based on insights from the 5% of consumers in this category who knowingly purchased counterfeit products in the past year in this category. All figures in the infographic pertain to the purchase of counterfeit goods in this category.
Frequency of purchase:
- monthly (28%)
- every 3 months (25%)
- every 6 months (22%)
- once a year (7%)
- less than once a year (18%)
Recipients:
- myself (64%)
- family (33%)
Reasons for purchase:
- cheaper price (47%)
- spend less (30%)
- the quality is similar/the same (31%)
Average annual spend: £234
Top counterfeited brands:
- Blossom Hill (23%)
- Budweiser (22%)
- Brandy (17%)
Source of purchase:
- in-store from a smaller retailer (45%)
- social media (28%)
- global e-commerce (26%)
If counterfeits were not available, they would:
- buy a similar product from a cheaper brand (47%)
- buy the product directly from the brand (35%)
- go without the product (11%)
- not sure/don’t know (7%)

Unintentional counterfeit purchasing
Cosmetics and toiletry products
Here are the key highlights from the cosmetics and toiletry products infographic, based on insights from the 4% of consumers in this category who unintentionally purchased counterfeit products in the past year in this category. All figures in the infographic pertain to the unintentional purchase of counterfeit goods in this category.
Who the product is for:
- myself (77%)
- family (23%)
Where it was purchased from:
- online via a global e-commerce site (e.g. amazon, ebay, etc.) (46%)
- in-store not from the brand via a smaller retailer (31%)
- online not from the brand via a smaller retailer (23%)
Top 3 reasons that made them realise it was a fake:
- the quality (61%)
- the packaging (37%)
- the design (30%)
When they realised their unintentional purchase(s) were a fake:
- before consuming (50%)
- after consuming (50%)
Actions after purchase:
- took action (74%)
- took no action (26%)
Top action: I made a complaint to the seller (35%)
Whether or not they successfully got a refund:
- yes (90%)
- no (10%)

Clothing
Here are the key highlights from the clothing products infographic, based on insights from the 4% of consumers in this category who unintentionally purchased counterfeit products in the past year in this category. All figures in the infographic pertain to the unintentional purchase of counterfeit goods in this category.
Who the product is for:
- myself (77%)
- family (30%)
Where it was purchased from:
- online via a global e-commerce site (e.g. Amazon, eBay etc.) (45%)
- online via a social media site (e.g. Facebook Marketplace) (26%)
- in-store not from the brand via a smaller retailer (17%)
Top 3 reasons that made them realise it was a fake:
- the quality (59%)
- the design (34%)
- upon reflection it was too cheap (32%)
When they realised their unintentional purchase(s) were a fake:
- before consuming (46%)
- after consuming (54%)
Actions after purchase:
- took action (41%)
- took no action (59%)
Top action: I made a complaint to the seller (29%)
Whether or not they successfully got a refund:
- yes (89%)
- no (11%)

Footwear/shoes
Here are the key highlights from the footwear/shoes products infographic, based on insights from the 2% of consumers in this category who unintentionally purchased counterfeit products in the past year in this category. All figures in the infographic pertain to the unintentional purchase of counterfeit goods in this category.
Who the product is for:
- myself (80%)
- family (25%)
Where it was purchased from:
- online via a global e-commerce site (e.g. Amazon, eBay etc.) (42%)
- online via a social media site (e.g Facebook Marketplace) (28%)
- in-store not from the brand via a smaller retailer (23%)
Top 3 reasons that made them realise it was a fake:
- the quality (57%)
- the design (34%)
- upon reflection it was too cheap (30%)
When they realised their unintentional purchase(s) were a fake:
- before consuming (49%)
- after consuming (51%)
Actions after purchase:
- took action (68%)
- took no action (32%)
Top action: I made a complaint to the seller (30%)
Whether or not they successfully got a refund:
- yes (75%)
- no (25%)

Accessories
Here are the key highlights from the accessory products infographic, based on insights from the 4% of consumers in this category who unintentionally purchased counterfeit products in the past year in this category. All figures in the infographic pertain to the unintentional purchase of counterfeit goods in this category.
Who the product is for:
- myself (74%)
- partner (30%)
Where it was purchased from:
- online via a global e-commerce site (e.g. Amazon, eBay etc.) (37%)
- online via a social media site (e.g. Facebook, Instagram) (24%)
- in-store not from the brand via a smaller retailer (22%)
Top 3 reasons that made them realise it was a fake:
- the quality (56%)
- upon reflection it was too cheap (35%)
- the design (24%)
When they realised their unintentional purchase(s) were a fake:
- before consuming (45%)
- after consuming (59%)
Actions after purchase:
- took action (58%)
- took no action (42%)
Top action: I made a complaint to the seller (24%)
Whether or not they successfully got a refund:
- yes (87%)
- no (13%)

Regular sportswear
Here are the key highlights from the regular sportswear products infographic, based on insights from the 3% of consumers in this category who unintentionally purchased counterfeit products in the past year in this category. All figures in the infographic pertain to the unintentional purchase of counterfeit goods in this category.
Who the product is for:
- myself (74%)
- family (27%)
Where it was purchased from:
- online via a global e-commerce site (e.g. Amazon, eBay etc.) (35%)
- in-store not from the brand-via a smaller retailer (18%)
- from a local market in the UK (16%)
Top 3 reasons that made them realise it was a fake:
- the quality (54%)
- someone else told me it was a ‘fake’ or counterfeit (34%)
- the packaging (32%)
When they realised their unintentional purchase(s) were a fake:
- before consuming (52%)
- after consuming (49%)
Actions after purchase:
- took action (41%)
- took no action (59%)
Top action: Reported via online platform (e.g. Amazon, eBay) (22%)
Whether or not they successfully got a refund:
- yes (87%)
- no (13%)

Sports footwear
Here are the key highlights from the sports footwear products infographic, based on insights from the 4% of consumers in this category who unintentionally purchased counterfeit products in the past year in this category. All figures in the infographic pertain to the unintentional purchase of counterfeit goods in this category.
Who the product is for:
- myself (65%)
- family (36%)
Where it was purchased from:
- online via a global e-commerce site (e.g. Amazon, eBay etc) (34%)
- online not from the brand via a smaller retailer (24%)
- online via a social media site (e.g. Facebook, Instagram) (21%)
Top 3 reasons that made them realise it was a fake:
- the quality (48%)
- someone else told me it was a ‘fake’ or counterfeit (38%)
- upon reflection it was too cheap (35%)
When they realised their unintentional purchases were a fake:
- before consuming (50%)
- after consuming (50%)
Actions after purchase:
- took action (65%)
- took no action (35%)
Top action taken after purchase: I made a complaint to the seller (34%)
Whether or not they successfully got a refund:
- yes (92%)
- no (8%)

Toy products
Here are the key highlights from the toy products infographic, based on insights from the 6% of consumers in this category who unintentionally purchased counterfeit products in the past year in this category. All figures in the infographic pertain to the unintentional purchase of counterfeit goods in this category.
Who the product is for:
- myself (54%)
- family (50%)
Where it was purchased from:
- online via a global e-commerce site (e.g. Amazon, eBay etc.) (42%)
- online via a social media site (e.g. Facebook, Instagram) (31%)
- in-store not from the brand via a smaller retailer (30%)
Top 3 reasons that made them realise it was a fake:
- the quality (50%)
- the packaging (33%)
- the design (33%)
When they realised their unintentional purchases were a fake:
- before consuming (71%)
- after consuming (29%)
Actions after purchase:
- took action (80%)
- took no action (20%)
Top action taken after purchase: reported via online platform (e.g. Amazon, eBay) (31%)
Whether or not they successfully got a refund:
- yes (88%)
- no (12%)

Electrical accessories
Here are the key highlights from the electrical accessory products infographic, based on insights from the 5% of consumers in this category who unintentionally purchased counterfeit products in the past year in this category. All figures in the infographic pertain to the unintentional purchase of counterfeit goods in this category.
Who the product is for:
- myself (80%)
- family (26%)
Where it was purchased from:
- online via a global e-commerce site (e.g. Amazon, e-Bay etc.) (49%)
- in-store not from the brand via a smaller retailer (29%)
- online via a social media site (e.g. Facebook, Instagram) (21%)
Top 3 reasons that made them realise it was a fake:
- the quality (53%)
- the packaging (31%)
- upon reflection it was too cheap (26%)
When they realised their unintentional purchases were a fake:
- before consuming (44%)
- after consuming (56%)
Actions after purchase:
- took action (63%)
- took no action (37%)
Top action taken after purchase: I made a complaint to the seller (27%)
Whether or not they successfully got a refund:
- yes (79%)
- no (21%)

5. Segmentation
A segmentation was conducted on the 24% of the total sample that had knowingly purchased a counterfeit product to identify distinct groups of consumers. The basis for this was data from the first phase of the research derived from variables including the frequency of how often they purchase counterfeits, as well as the categories their purchases were in. Three segments were identified, which exhibited differences in terms of their purchasing behaviours and demographics.
Light counterfeit purchasers (9% of the total sample): Light counterfeit purchasers tend to be older (26% aged 55+) and are marginally more female. They tend to believe what is said about the harmful consequences of counterfeits and are less likely to think it is okay to buy them because brands charge too much. They were most likely to make purchases from the “Clothing, footwear, and accessories” category (17%), with no other category having purchase levels above 7%.
Moderate counterfeit purchasers (10% of the total sample): Moderate counterfeit purchasers are relatively evenly split across sex and age groups. They are prone to spontaneous counterfeit purchases and share the belief that major brands overprice their products. They display a higher level of engagement with product trends compared to light purchasers. However, similarly to light counterfeit purchasers, their most common purchases are in the “Clothing, footwear, and accessories” category, although this is at a much higher rate (59%). A substantial number of purchases are also made in the “Sports” (37%), “Electricals” (27%), and “Beauty and hygiene” (21%) categories.
Heavy counterfeit purchasers (6% of the total sample): Heavy counterfeit purchasers are the youngest segment (majority under 35) and skew male. They are the most likely to be parents or guardians (53%). They claim to be at the forefront of trends around new products and buy counterfeit goods across a range of categories. Attitudinally, they have the least regard for their purchases being harmful and are more likely to believe that big brands charge too much.
Light counterfeit purchasers
This infographic shows data for those who have been categorised as light counterfeit purchasers. They comprised 37% of all counterfeit purchasers and 9% of the total sample.
Purchased counterfeit category
- clothing, footwear and accessories (17%)
- sports (7%)
- beauty and hygiene (5%)
- electricals (4%)
- alcohol (1%)
- toys (1%)
Sex
- male (47%)
- female (53%)
Age
- 18-24 (12%)
- 25-34 (21%)
- 35-44 (22%)
- 45-54 (20%)
- 55+ (26%)
Consumer type (NET agree)
- people often ask me about new products (31%)
- I am usually among the first of my friends to try new products (49%)
Change in frequency of counterfeit purchase since outbreak of COVID-19
- increased (10%)
- decreased (12%)
- remained the same (67%)
- hadn’t purchased them prior to COVID-19 (11%)
Behaviours and consequences (NET agree)
- buying a ‘fake’ or counterfeit product is usually a spontaneous decision (46%)
- I don’t believe what is said about the harmful consequences of ‘fake’ or counterfeit products (e.g. to society, to individuals) (18%)
- it is okay to buy ‘fake’ or counterfeit products because brands charge too much (31%)

Moderate counterfeit purchasers
This infographic shows data for those who have been categorised as moderate counterfeit purchasers. They comprised 40% of all counterfeit purchasers and 10% of the total sample.
Purchased counterfeit category
- clothing, footwear and accessories (59%)
- sports (37%)
- electricals (27%)
- beauty and hygiene (21%)
- toys (14%)
- alcohol (7%)
Sex
- female (46%)
- male (54%)
Age
- 18-24 (14%)
- 25-34 (28%)
- 35-44 (20%)
- 45-54 (19%)
- 55+ (20%)
Consumer type (NET agree)
- I am usually among the first of my friends to try new products (55%)
- people often ask me about new products (60%)
- change in frequency of counterfeit purchase since outbreak of COVID-19
- increased (22%)
- decreased (14%)
- remained the same (58%)
- hadn’t purchased them prior to COVID-19 (6%)
Behaviours and consequences (NET agree)
- buying a ‘fake’ or counterfeit product is usually a spontaneous decision (60%)
- I don’t believe what is said about the harmful consequences of ‘fake’ or counterfeit products (e.g. to society, to individuals) (36%)
- it is okay to buy ‘fake’ or counterfeit products because brands charge too much (56%)

Heavy counterfeit purchasers
This infographic shows data for those who have been categorised as heavy counterfeit purchasers. They comprised 24% of all counterfeit purchasers and 6% of the total sample.
Purchased counterfeit category
- clothing, footwear and accessories (81%)
- electricals (75%)
- sports (73%)
- beauty and hygiene (71%)
- alcohol (62%)
- toys (57%)
Sex
- male (63%)
- female (37%)
Age
- 18-24 (12%)
- 25-34 (42%)
- 35-44 (30%)
- 45-54 (9%)
- 55+ (7%)
Consumer type (NET agree)
- I am usually among the first of my friends to try new products (75%)
- people often ask me about new products (73%)
Change in frequency of counterfeit purchase since outbreak of COVID-19
- increased (49%)
- decreased (7%)
- remained the same (41%)
- hadn’t purchased them prior to COVID-19 (3%)
Behaviours and consequences (NET agree)
- buying a ‘fake’ or counterfeit product is usually a spontaneous decision (60%)
- I don’t believe what is said about the harmful consequences of ‘fake’ or counterfeit products (e.g. to society, to individuals) (48%)
- it is okay to buy ‘fake’ or counterfeit products because brands charge too much (62%)

6. Communications testing
This section assesses beauty and hygiene campaigns through both qualitative and quantitative research methods. The qualitative online community delves into the effectiveness of various campaigns and investigates the reasons behind their effectiveness. In the subsequent survey, we aimed to quantify the effectiveness of these campaigns at an overall level and among subgroups such as age, sex, type of counterfeit purchaser, and the categories they purchase.
Informing the communications testing – Qualitative Stage
The communications testing for this wave of the Counterfeit Goods tracker took a slightly different approach to previous years. For the first 3 waves of this annual project, participants were shown campaigns relevant across the whole breadth of counterfeit categories, or across counterfeit categories as a whole. This year, participants were only shown campaigns pertaining to beauty and hygiene counterfeits, in an effort to bolster findings for an upcoming campaign. As in the previous waves, the qualitative Online Community stage in which these campaigns were tested consisted of 64 participants.
Communications testing
In this Online Community, a total of nine campaigns were tested, all to do with beauty and hygiene counterfeits, and all mocked up by the IPO’s design team with a slogan/blurb and imagery. The campaigns aimed to bring across different sorts of messages, in order to see what angle on these products may resonate best. Participants were asked which they felt would be most effective in terms of making them rethink purchasing beauty and hygiene counterfeits, and which they felt would be least effective.
Effective campaigns
1. Most effective:
In regard to total number of votes, two campaigns drew for first position (i.e. most effective):
- the image showing the aftereffects which can afflict users of counterfeit make-up
- the image showing the potentially exploitative origins and dark underbelly of the counterfeit world
Message 1 - Showing the after effects which can afflict users of counterfeit make-up (health and safety)
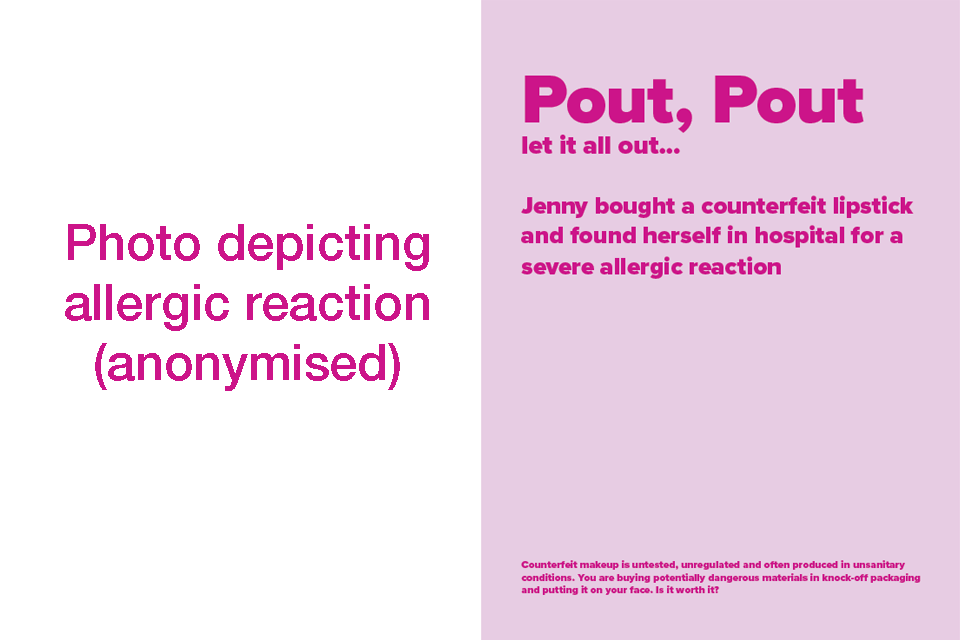
Message 2 - Showing the potentially exploitative origins and dark underbelly of the counterfeit world (societal)
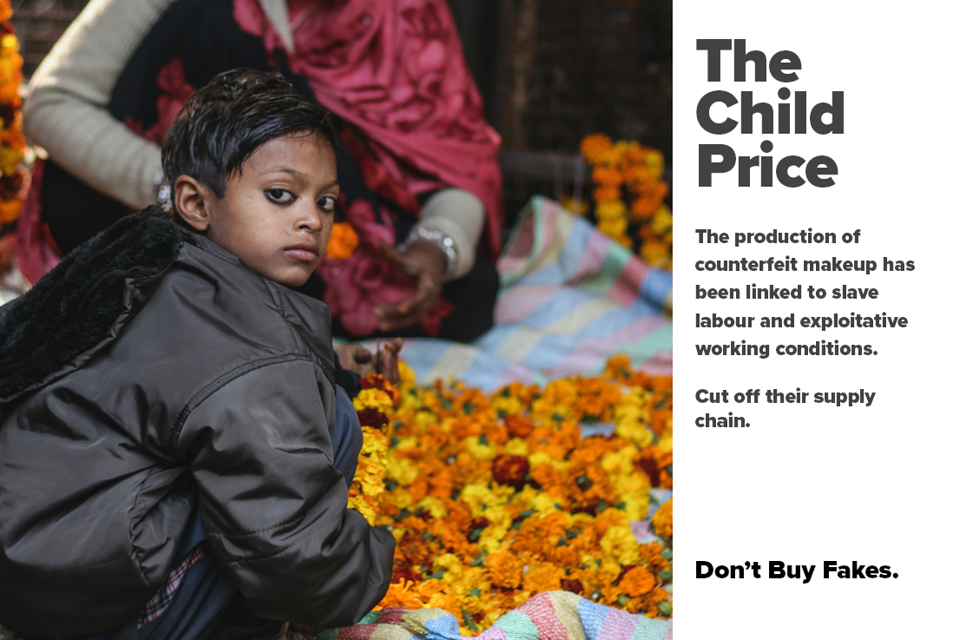
These results chime with the findings of a dedicated beauty and hygiene study run by the IPO and AudienceNet in 2021 and reinforce the fact that harm to consumers themselves as well as the realities of slave and child labour are compelling and catch attention.
In both campaigns, both the messages themselves as well as the imagery helped convey the severity of the topic and elicited a sense either of disgust or foreboding from participants.
The picture of the girl who bought counterfeit lipstick and ended up in hospital. The visual of what happened to her is really powerful so the message really hits home.
Female, 51
The picture of the woman’s face with an allergic reaction because it scares me that I could have a reaction like that and using a picture of someone it’s happened to works as proof.
Female, 28
For me, it’s the one about children. Anything like this will work on me. Children have to work just so we can get cheaper products.
Female, 39
The Child Price. I don’t agree with child labour. And using a real life image really hits it home.
Female, 49
2. Second most effective:
Aside from the two campaigns above which garnered most attention as individual campaigns, there were also a group of four campaigns with similar messages which all did well – these all revolved around the idea of not knowing what ingredients counterfeit beauty and hygiene products contain.
These were messages around counterfeit beauty and hygiene products potentially containing traces of things like horse urine, mercury, arsenic and rat droppings. These messages certainly struck a chord with participants, and though each of these campaigns only received a handful of votes individually, if one looks at them as a group, then the overall message about product composition also performed well overall.
Message 3 - Showing the harmful elements that can be found in counterfeit beauty products (health and safety)
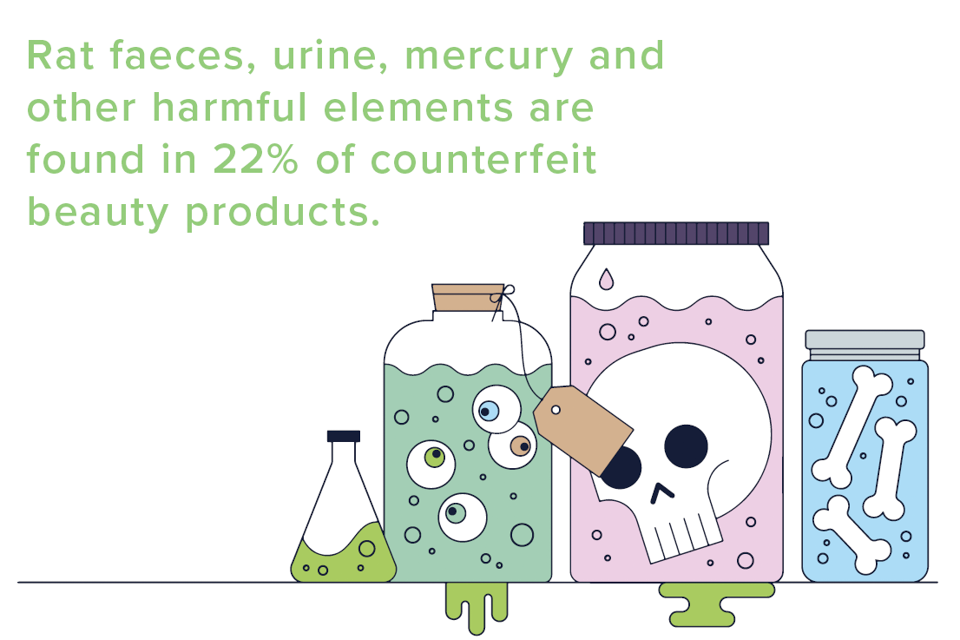
Message 5 - Showing that counterfeit beauty products may contain unknown ingredients, including those which could be harmful (health and safety)
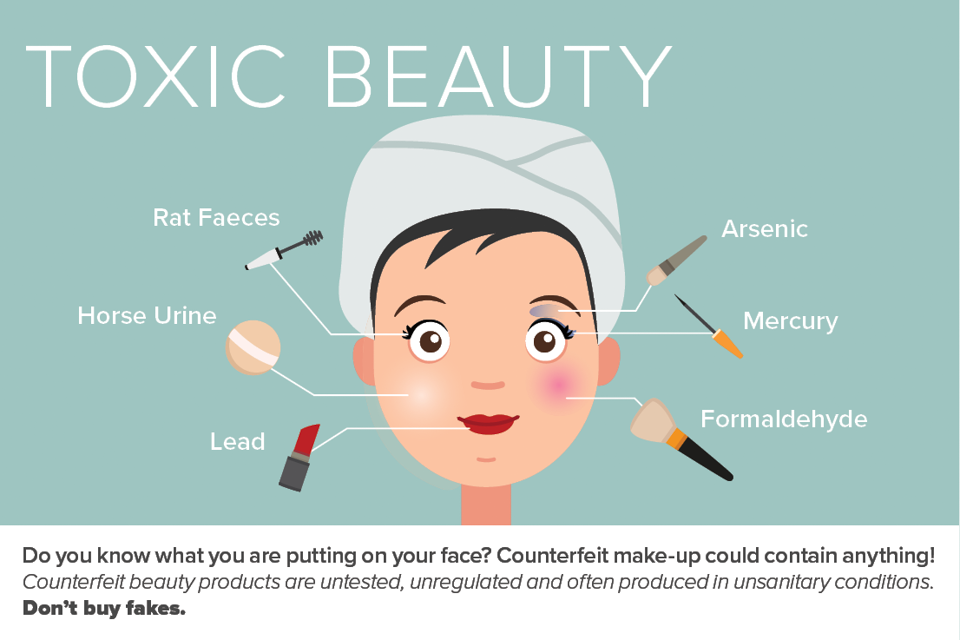
Message 4 - Showing the risks of counterfeit make up. Counterfeit make up can contain harmful chemicals, with risk of serious health consequences (health and safety)
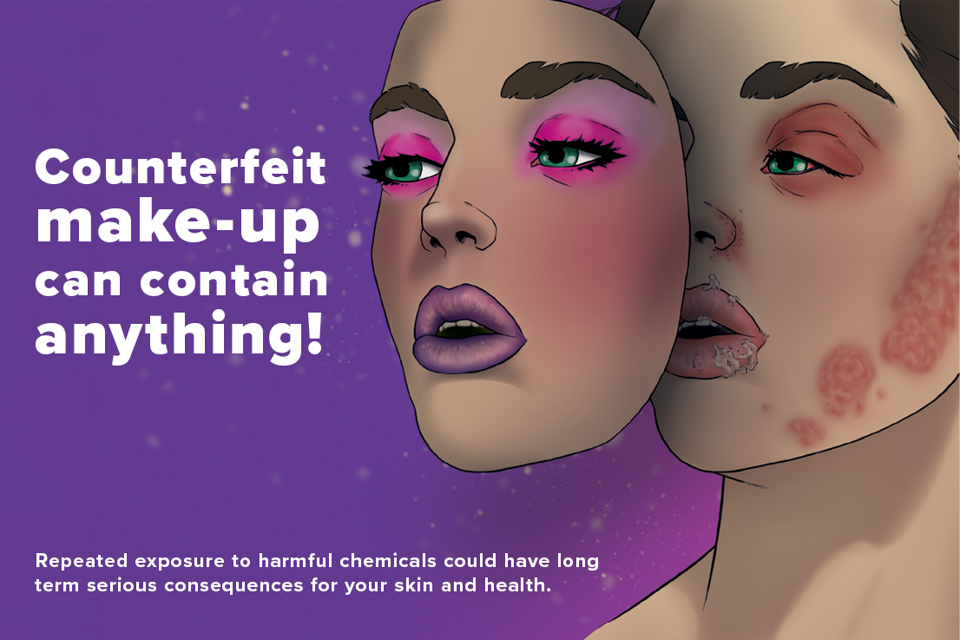
Message 8 - Showing the types of ingredients that have been found in counterfeit makeup products, including rat faeces, urine, mercury, arsenic, lead and cyanide (health and safety)
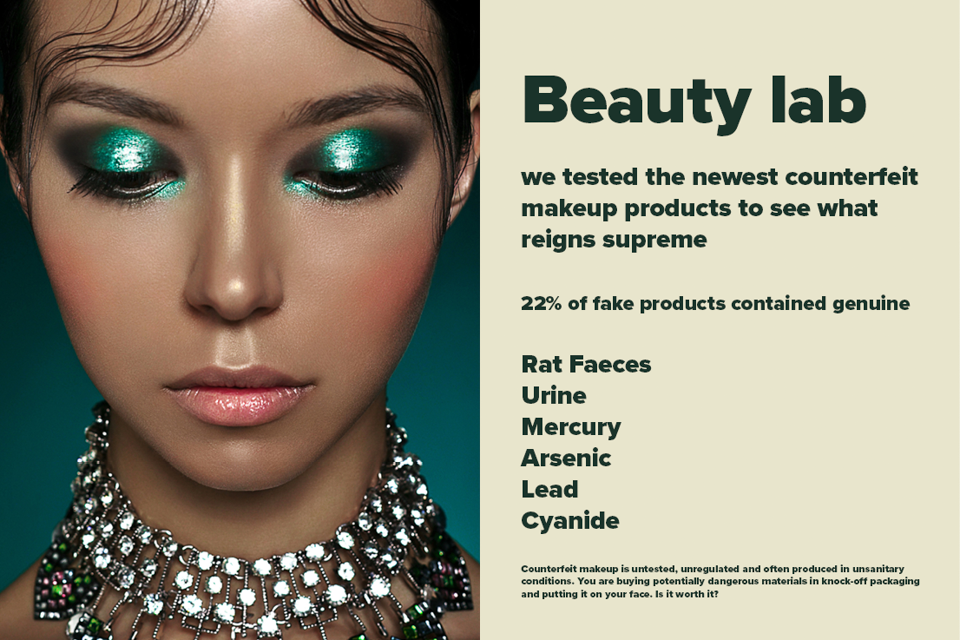
Toxic beauty seems most effective. These counterfeit products are manufactured and sold without proper quality control and regulatory oversight, posing significant health risks to consumers.
Male, 35
The ingredients that can be found in these beauty products are very shocking and disturbing. I’m sure this would put people off.
Female, 34
Toxic Beauty as it is not too horrible to look at and eye catching and simple and easy to read. I like the layout of it and the information is in the right place to get the message across of what could be in the items being bought and I like the animated picture/style.
Male, 28
The one where it tells you that counterfeit beauty products can contain rat faeces!! I had no idea they contained things like that and that definitely would stop me from buying anything like that.
Female, 28
3. Less effective campaigns:
Some campaigns clearly resonated less than others, garnering only a few votes each. This year, the two campaigns which performed most poorly were those around sustainability.
Though we know that environmental issues are of great societal concern and widely debated topics at present, it seems unfortunately (as it has done for the past few years when tested), that concerns for the environment are still overridden by compellingly low prices.
For some, the messages simply weren’t specific enough or didn’t have the shock factor which the other campaigns had. Some, as we have also seen in previous waves, brought counterarguments around the general wasteful habits of corporations and the wider retail sector, saying that counterfeits may not be the worst culprits and that waste and landfill were huge issues for society in general.
Message 7 - Showing the environmental result of buying counterfeit beauty products, that can be of lower quality and will often end up being discarded in general waste (environmental)
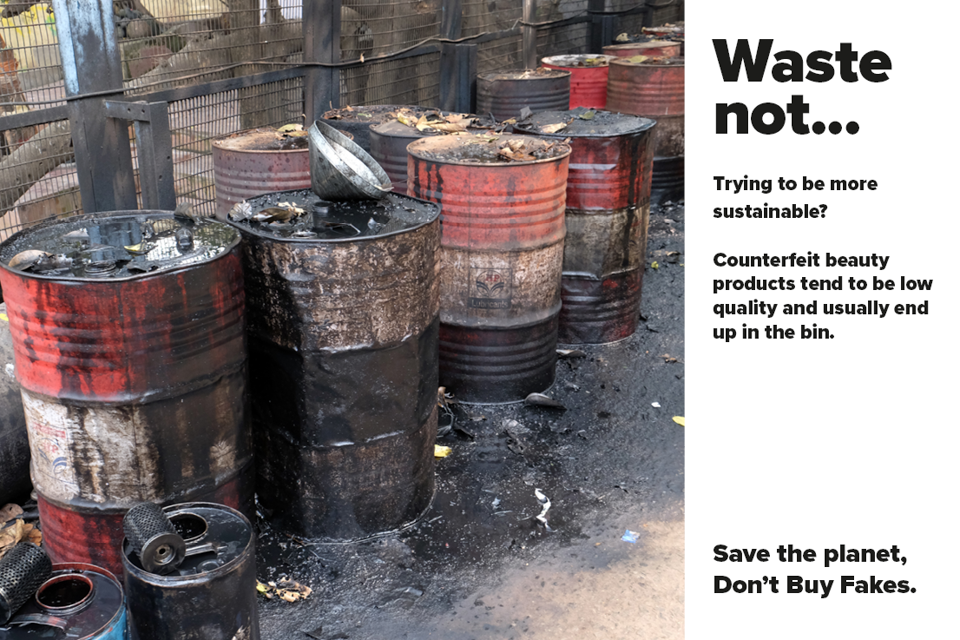
Message 9 - Showing that counterfeit beauty products are not a sustainable option due to then likelihood of being low quality, resulting in them often being discarded in general waste (environmental)
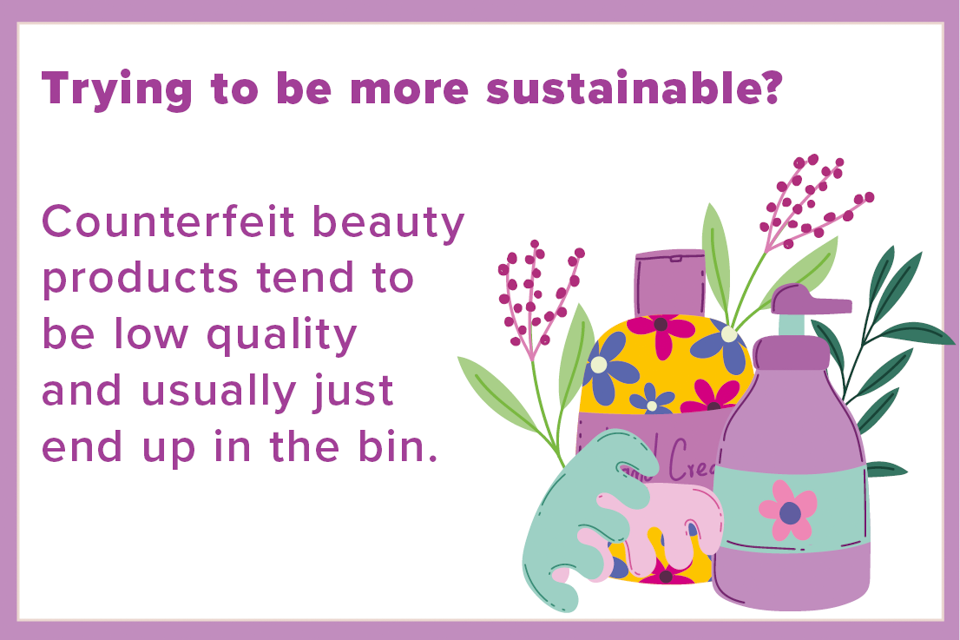
Trying to be more sustainable is not that powerful and seems quite plain and obvious.
Male, 35
Probably the one about waste. People tend not to think of this as a priority.
Female, 34
Waste Not is less effective because we live in a world that doesn’t care about something that’s broken or you don’t like anymore, we just throw it away and get another.
Female, 49
Qualitative conclusion
It seems that, in concordance with the results of the specific beauty and hygiene study in 2021, the best ways to make consumers stop and think remain issues around threats to their own health and harrowing images of child labour.
To note, in previous years, participants were asked to put together their own campaign ideas but as this year was an exercise in reinforcing the feedback on this specific set of campaigns, this was not included.
Large Scale Message Testing – Quantitative Stage
Overview of methodology
The learnings from the qualitative phase informed a second iteration of behaviour change campaign messages. Messages were tested with (n=1,538) respondents, aiming for quotas per counterfeit category of interest of 250+ and an even sex and age split. All were non-rejectors of purchasing counterfeit goods.
The final sample achieved across categories was as follows:
Beauty and hygiene (n=342)
Clothing, footwear and accessories (n=436)
Sports (n=284)
Toys (n=147)
Electricals (n=238)
Alcohol (n=167)
Respondents were shown a total of nine messages and asked how likely each would be to persuade them to stop purchasing various types of counterfeit products. All messages focus on the beauty and hygiene category and were shown to respondents whether they buy products in that category or not. Each message was shown accompanied by images which had been mocked up into a potential campaign by the IPO’s design team.
The exact options put to respondents about likelihood to prevent counterfeit purchasing were (This message would…):
a) definitely prevent me from purchasing counterfeit beauty and hygiene products
b) maybe prevent me from purchasing counterfeit beauty and hygiene products
c) be unlikely to prevent me from purchasing counterfeit beauty and hygiene products
d) definitely not prevent me from purchasing counterfeit beauty and hygiene products
In the following analysis, options ‘a.’ (definitely prevent me from purchasing) and ‘b.’ (maybe prevent me from purchasing) are combined into ‘NET’ likely to prevent purchasing in the future’.
Overview of messaging effectiveness
Overall, the same messages were most effective both at an overall level and among each of the subgroups tested (e.g. by sex, age, type of counterfeit purchaser).
Messages about Health and Safety performed best. This was closely followed by Societal messages about working conditions, with themes related to the environment proving to be the least effective.
In more concrete terms, the following messages dominated (i.e. were chosen most frequently as ‘definitely’ or ‘maybe likely’ to prevent them from purchasing these types of counterfeit goods):
Message 1 - Showing the after effects which can afflict users of counterfeit make-up (health and safety)
Message 3 - Showing the harmful elements that can be found in counterfeit beauty products (health and safety)
Message 4 - Showing the risks of counterfeit make up. Counterfeit make up can contain harmful chemicals, with risk of serious health consequences (health and safety)
The success of Messages 1, 3 and 4, all relating to Health and Safety, highlight the potential of a campaign centred around the idea that counterfeit Beauty & hygiene products do/can contain ingredients which are dangerous to the individual.
Message effectiveness
The top three messages most likely to prevent counterfeit purchasing at a NET level (i.e. ‘definitely’ or ‘maybe prevent’) were all related to health and safety.
The next four messages, in order of effectiveness, were closely ranked and were only separated by a 2% difference. Two of them were related to health and safety, while the other two pertained to the impact on society (e.g. such as child labour).
The two least effective messages both focused on the environment, although the message emphasising waste (message number 7) was more effective than the one on sustainability (message number 9).
Chart 27: Question. Whether you currently buy counterfeit beauty/hygiene products or not, to what extent do you think the following campaign would prevent you from purchasing counterfeit beauty and hygiene products if you saw it? (%)

Base: Total sample of non-rejectors of counterfeit purchasing (n=1,538)
Message effectiveness by sex
The messages that had the ‘most’ impact (i.e. respondents were ‘definitely’ likely to say it would prevent them from purchasing counterfeits) followed the same pattern for both male and female respondents as they did at an overall level. For each of these groups, messages related to health and safety were most likely to be the biggest deterrent to purchasing counterfeits.
There was a pattern evident across each message with female respondents more likely to say it would ‘definitely’ prevent them making a purchase when compared to male respondents.
Chart 28: Question. Whether you currently buy counterfeit beauty/hygiene products or not, to what extent do you think the following campaign would prevent you from purchasing counterfeit beauty and hygiene products if you saw it? Answered ‘definitely prevent’ (By sex)
Results for those who said it would ‘definitely’ prevent counterfeit purchases.
| Message | Female | Male |
|---|---|---|
| Message 1 | 73.5% | 63.9% |
| Message 2 | 62.2% | 50.4% |
| Message 3 | 70.6% | 60.8% |
| Message 4 | 65.5% | 56.0% |
| Message 5 | 65.5% | 52.0% |
| Message 6 | 61.1% | 51.8% |
| Message 7 | 53.5% | 46.5% |
| Message 8 | 67.9% | 55.7% |
| Message 9 | 36.5% | 30.0% |
Base: Non-rejectors of counterfeit purchasing who are male (n=752), female (n=785)
Message effectiveness by age
The messages that had the ‘most’ impact (i.e. respondents were ‘definitely’ likely to say it would prevent them from purchasing counterfeits) were broadly consistent across each age group, with the top two messages in each relating to health and safety.
Messages related to the societal impact of counterfeits (i.e. messages 6 and 2) were considered on par with the health and safety messaging (excluding message number 1) by those in the youngest two age groups (i.e. 18-24 and 25-34-year-olds). In older age groups (i.e. those aged 35+), there was often a significant gap, with the societal messaging not proving as effective as some or all of the health and safety messaging.
Each message had a greater impact on subsequently older age groups, so while the most effective message (message number 1) would definitely prevent 78% of those aged 55+, this figure was only 58% among 18-24-year-olds. The exception to this trend was observed in the 25-34 and 35-44 age groups, where there was little difference between them.
Chart 29: Question. Whether you currently buy counterfeit beauty/hygiene products or not, to what extent do you think the following campaign would prevent you from purchasing counterfeit beauty and hygiene products if you saw it? Answered ‘definitely prevent’ (By age group)
| Message | 18-24 | 25-34 | 35-44 | 45-54 | 55+ |
|---|---|---|---|---|---|
| Message 1 | 58.3% | 60.5% | 60.3% | 71.6% | 77.6% |
| Message 2 | 47.5% | 50.3% | 47.1% | 56.3% | 65.5% |
| Message 3 | 48.8% | 53.7% | 54.3% | 65.6% | 80.4% |
| Message 4 | 45.8% | 54.5% | 53.5% | 58.7% | 71.6% |
| Message 5 | 43.3% | 54.4% | 52.4% | 61.1% | 66.8% |
| Message 6 | 47.3% | 49.0% | 46.0% | 56.8% | 66.5% |
| Message 7 | 34.3% | 44.8% | 40.8% | 48.9% | 60.8% |
| Message 8 | 42.5% | 51.4% | 54.4% | 59.7% | 75.8% |
| Message 9 | 30.4% | 27.3% | 27.6% | 32.0% | 39.6% |
Base: Non-rejectors of counterfeit purchasing who are 18-24 (n=163), 25-34 (n=263),35-44 (n=247),45-54 (n=259),55+ (n=606)
Message effectiveness by type of counterfeit purchaser
The messages that had the ‘most’ impact (i.e. respondents were ‘definitely’ likely to say it would prevent them from purchasing counterfeits) were similar across different types of counterfeit purchasers, including current purchasers, lapsed purchasers, and those open to purchasing them in the future.
The top three messages all related to health and safety, with messaging generally proving less effective for those who currently make purchases compared to the other two groups.
Chart 30: Question. Whether you currently buy counterfeit beauty/hygiene products or not, to what extent do you think the following campaign would prevent you from purchasing counterfeit beauty and hygiene products if you saw it? Answered ‘definitely prevent’ (By type of counterfeit purchaser)
| Message | Currently purchases | Used to purchase | Would consider purchasing |
|---|---|---|---|
| Message 1 | 62.7% | 77.1% | 72.2% |
| Message 2 | 48.7% | 67.1% | 60.5% |
| Message 3 | 57.9% | 72.6% | 74.8% |
| Message 4 | 54.0% | 68.7% | 66.3% |
| Message 5 | 50.4% | 68.6% | 65.7% |
| Message 6 | 50.2% | 63.6% | 62.0% |
| Message 7 | 43.7% | 57.0% | 55.4% |
| Message 8 | 52.4% | 73.0% | 69.3% |
| Message 9 | 27.9% | 39.6% | 37.4% |
Base: Non-rejectors of counterfeit purchasing who currently purchases counterfeit products (n=762), used to purchase counterfeit products (n=430), would consider purchasing counterfeit products (n=346)
Message effectiveness by counterfeit category purchased
The messages that had the ‘most’ impact (i.e. respondents were ‘definitely’ likely to say it would prevent them from purchasing counterfeits) were similar for those who do and do not purchase counterfeit beauty and hygiene products, with the top two both relating to health and safety.
It is interesting to note that, for all messages, the impact was significantly less for those who purchase beauty and hygiene products.
Chart 31: Question. Whether you currently buy counterfeit beauty/hygiene products or not, to what extent do you think the following campaign would prevent you from purchasing counterfeit beauty and hygiene products if you saw it? Answered ‘definitely prevent’ (By counterfeit category purchased)
| Message | Counterfeit beauty and hygiene consumers | NOT counterfeit beauty and hygiene consumers |
|---|---|---|
| Message 1 | 62.6% | 70.6% |
| Message 2 | 50.3% | 58.3% |
| Message 3 | 56.9% | 68.4% |
| Message 4 | 50.9% | 63.7% |
| Message 5 | 48.9% | 61.8% |
| Message 6 | 53.3% | 57.5% |
| Message 7 | 45.2% | 51.4% |
| Message 8 | 50.2% | 65.3% |
| Message 9 | 30.5% | 34.1% |
Base: Have purchased counterfeit beauty and hygiene products (n=342), have not purchased counterfeit beauty and hygiene products (n=1,196)
Most effective messaging overview
Key learnings from both phases of message testing
Across both stages of qualitative and quantitative research, the following key findings emerged:
- messages about Health and Safety (i.e. the danger to individuals posed by ingredients and materials contained within counterfeit beauty and hygiene products) dominated in both the qualitative and quantitative stages of research, with these types of messages being the most commonly chosen as most effective in changing behaviour
- societal considerations (e.g. working conditions, use of child labour) also proved to be a deterrent; it was highlighted as one of the most effective pieces of messaging in the qualitative stage and were both said by 81% in the quantitative stage as messages that would ‘definitely’ or ‘maybe’ prevent them from making counterfeit purchases
- overall, the quantitative research this year showed that 91% of participants who saw the most effective piece of beauty and hygiene messaging, said it would ‘definitely’ or ‘maybe’ prevent them from purchasing counterfeits
7. Technical Appendix
Background
The Intellectual Property Office’s (IPO) remit is, broadly, to create an environment that encourages innovation which consequently leads to British industry and commerce flourishing at a national and global level. For the IPO, creating respect for Intellectual Property (IP) within society is fundamental to achieving this goal.
Intellectual Property relates to a range of products and industries. This particular project, which started in 2019 and is now in its fourth wave, focuses on the counterfeiting of physical goods, whereby a physical product infringes upon one or multiple types of intellectual property rights. Evidence shows that the counterfeiting of physical goods has considerable and wide-ranging negative consequences, for the brands/industries being targeted, individual consumers and for society as a whole. These include losses of billions of pounds to the global economy each year, lost revenues for brands/industries and potential reputational damage, and for consumers, some goods can be harmful to health (e.g. counterfeit medicines or alcohol). Furthermore, law-enforcement authorities highlight that revenues from counterfeiting often fund serious criminal activities and even terrorism.
Objectives
While considerable evidence exists, to enable the IPO to effectively achieve its aims, the organisation has identified a need for more consistent research on consumers in relation to the counterfeiting of physical goods. The IPO has been running a similar study, since 2012, looking at online copyright infringement and is seeking to establish a similar evidence-base for its decision-making in relation to physical goods.
This study seeks to track and monitor trends related to the purchasing counterfeit goods. The IPO is also seeking evidence that will help facilitate behaviour change in consumers, based on their specific needs. For example, through creating awareness of counterfeiting among those who are currently being deceived, and fostering greater respect for IP among those who are more actively seeking-out such goods.
Methodology
Based on the above objectives, the IPO commissioned AudienceNet to conduct a pilot study in 2019 to benchmark the level of counterfeit purchasing and to help facilitate behaviour change. This comprised a three-staged, mixed methodology, approach that incorporated quantitative and qualitative research. The process was designed to achieve robust measurement while also offering additional depth of insight.
Stage 1: Online Survey
- online data collection, with fieldwork taking place between 16/06/23 and 10/07/23
- 15 minute survey
- N=5,072
- nationally representative of UK +18 population
Stage 2: Ongoing Qualitative Engagement
- 5 day Online Community, with fieldwork taking place between 17/07/23 and 23/07/23
- mixture of research tasks, experimental conditions and discussion topics
- N=64
Stage 3: Communication testing
- online data collection, with fieldwork taking place between 28/07/23 and 08/08/23
- 10 minute survey
- N=1,538 (a fresh sample – i.e. those who did not take part in Stage 1)
- UK +18 population who are open to purchasing or receiving counterfeit goods
Recruitment
The survey samples were sourced through AudienceNet’s network of professionally managed, ESOMAR compliant, online UK consumer research panels. The sample was targeted using demographic information already held by the panel providers (e.g. age, region and sex).
To ensure that the survey samples were not self-selecting in any way, when invited to take part, respondents were not made aware of the specific focus on counterfeit purchasing. They were simply told that the study was about consumption habits. To encourage honesty, from the outset they were however assured that their responses would be anonymized and therefore untraceable to them.
An incentive was paid to each respondent who took part in the surveys and a further one was paid to those who took part in the Online Community.
Stage 1 - Online Survey
Quotas were set to ensure that the survey sample (N=5,072) was representative of the UK 18+ population, in terms of age, sex, region and social grade.
Once the survey instrument had been developed, it was rigorously tested to ensure that it yielded both reliable and valid data outputs. This consisted of thorough data verification checks and testing, as well as a pilot with a small sample of N=500.
The Stage 1 survey took, on average, 16 minutes and 49 seconds for respondents to complete. There was a dropout rate of 10%.
20 individual product categories were included in the research, which fell within six broad categories:
| Category | Products |
|---|---|
| Beauty & hygiene | Cosmetic and toiletry products Hygiene products |
| Clothing, footwear & accessories | Clothing excluding sportswear Footwear/shoes excluding sports footwear Accessories excluding watches Watches |
| Sports | Regular sportswear Sportswear from clubs/franchises Sports footwear (i.e. trainers) from sports or fashion brands Sports equipment including for home workout |
| Toys | Dolls/action figure toys Toy building sets Merchandise from TV/Film excluding dolls/action figures |
| Electricals | Beauty/hygiene related electricals Electrical accessories Electrical devices DVDs and Blu Rays |
| Alcohol | Bottles of wine/champagne Bottles of spirits (e.g. vodka) Bottles/cans of beer or cider |
There were some differences in terms of the type of information captured for some of the product categories. In most product categories respondents were asked about their favourite brands. In categories where there were a large number of products and no clear brand leaders they were instead asked about types of products. This was the case for:
- Bottles of spirits
- DVDs and Blu Rays
- Sportswear from clubs/franchises
Follow-up questions asking about purchasing behaviour were asked of those who indicated they had purchased individual product categories. This was the case for each of genuine, intentional counterfeit, and accidental counterfeit purchases. In some instances, due to small sample sizes of counterfeit goods in previous waves, follow-up questions were either not asked or were conducted at a grouped level:
- Toys and Electricals were both inquired about in terms of the broad category
- no follow-up questions were asked for Beauty/hygiene-related electricals and Electrical devices.
Stage 2 – Ongoing Qualitative Engagement
The primary aim of the Online Community was to investigate, in more depth, the drivers to purchasing counterfeit goods. It also sought to test and co-create communications messaging that could be used by the IPO to facilitate positive behaviour change. In this wave, there was a focus on testing beauty and hygiene messaging specifically.
Upon analysis of the data from the initial Online Survey, AudienceNet identified key population segments to focus on in the qualitative stage. A total of 64 representatives of these groups were then recruited into a 5-day Online Community. These respondents had all purchased counterfeit goods in specific categories within the last year. A mix of male and female respondents was recruited as well as a broad range of ages from 18 to 54, with a focus on 18-34-year-olds reflecting the higher incidence rate amongst this younger population.
In order to recruit for the Online Community, at the end of the Stage 1 survey, respondents were asked for their permission to be recontacted to take part in follow up research. While the opting-in element makes the sample for the Online Community self-selecting in some ways, we had a large pool (N=2,542) to select from. Further quality checks were also introduced to minimise bias:
- at the point of recruitment, those shortlisted were sent a follow-up survey to verify responses to key questions (i.e. around illegal activity)
- to gain their trust and encourage honesty, those taking part in the Community were given further assurance that their responses would be anonymous and that no action would be taken against anyone indicating that they purchase counterfeit items
For reasons of qualitative validity (i.e. convergence of insights), four of the broad product categories were focused on in-depth in the Community. The categories of Fashion and Sportswear were combined, given the crossover. The number of participants per category was reflective of the approximate proportion of the population buying these counterfeit products as indicated by the Online Survey.
Number of respondents (N=64):
Fashion and Sportswear (N=37) including:
- clothing, footwear & accessories (including watches) (N=24)
- sports clothing, sports footwear and sports clothing from clubs/franchises (N=13)
Beauty and hygiene (N=13)
Electrical (N=14)
Stage 3 – Communication testing
Nine pieces of behaviour change messaging that were tested in the qualitative stage were then tested in quantitative research. These fell within one of three broad categories (i.e. health and safety, environmental and societal).
The messages were tested over in online survey with non-rejectors of counterfeits (i.e. those who either had or were open to purchasing or receiving counterfeit goods). The survey explored how effective these messages were likely to be in preventing respondents from purchasing counterfeit goods in future.
Once the survey instrument had been developed, it was rigorously tested to ensure that it yielded both reliable and valid data outputs. This consisted of data verification checks and testing with an initial pilot of 100 respondents.
In total, N=1,538 completed the survey. The survey took, on average, 9 minutes and 9 seconds for respondents to complete. There was a dropout rate of 8%.
Data collection - pros and cons
Data was collected online and via online suppliers of representative samples of the UK 18+ population. There are a number of benefits to this approach:
- it is possible, through our network of accredited online sample providers, to reach a representative population of the target audience (across all of the 18+ age categories), therefore removing the need to supplement via other more time and cost-intensive means
- online data collection allows us to achieve significant cost efficiencies compared with other methods (e.g. CATI)
It is, however important to highlight that there are some limitations:
- for cost and time efficiency reasons, all respondents had internet access (i.e. the offline population was not included). It is also possible that those with lower levels of online engagement are less well represented in this research, compared with approaches that use offline methods to specifically target them (e.g. CATI, CAPI)
- the sample is comprised of people who have opted in to take part in research
Definitions
Respondents in the survey were provided with the following definition which was intended to minimise any confusion over what was meant by “counterfeit” products:
We now have some questions about “fake” or counterfeit products. By this we mean:
- items that look identical to the official product but are not made by the brand itself
- they might copy the brand’s logo and use the exact name of the original brand
- they are often of lower quality and often sold for cheaper.
The following would count as fakes or counterfeits:
e.g. A handbag of identical design to a “Chanel” handbag, either with or without a copy of Chanel’s logo but not actually made by Chanel and sold for much less
e.g. A perfume with the same design, branding and name/logo as the original but not sold by the brand itself and sold for much less
Throughout the rest of the survey, counterfeits are referred to as “‘fake’ or counterfeit products”.
Please note: whilst previous waves of research included this definition, in Wave 4 the phrase “‘fake’ or ‘replica’” items was replaced with “‘fake’ or counterfeit items”.
Analysis
Significance testing was carried out at a 95% level. In this report, variations between groups are only noted if they are statistically significant. Although some differences that are not statistically significant have been mentioned, appropriate disclaimers have been included to clarify such instances.
Outliers were removed from questions which involved entering numerical values (e.g. number of items purchased, amount spent on items). Values were removed on the basis of any that were greater than the mean plus three standard deviations.
Weighting
Our samples for Stage 1 and Stage 3 surveys were weighted by sex, age and region to ensure they were representative of the UK 18+ population and avoided any imbalances. They have a weighting efficiency of 97% and 90% respectively.
Achieved sample
For the Stage 1 survey, the sample achieved was:
Sex
- Male - 53%
- Female - 47%
- Other - 0%
Age
- 18 - 24 - 11%
- 25 - 34 - 17%
- 35 - 44 - 16%
- 45 - 54 - 17%
- 55 - 64 - 16%
- 65 - 74 - 13%
- 75 + - 11%
Location
- North East - 4%
- North West - 11%
- Yorkshire and The Humber - 8%
- East Midlands - 7%
- West Midlands - 9%
- East - 8%
- London - 12%
- South East - 14%
- South West - 9%
- Wales - 5%
- Scotland - 8%
- Northern Ireland - 3%
For the four Stage 3 surveys, the final sample achieved was:
Sex
- Male - 52%
- Female - 48%
- Other - 0%
Age
- 18 - 24 - 9%
- 25 - 34 - 18%
- 35 - 44 - 17%
- 45 - 54 - 18%
- 55 - 64 - 17%
- 65 - 74 - 14%
- 75 + - 7%
Location
- North East - 5%
- North West - 11%
- Yorkshire and The Humber - 10%
- East Midlands - 9%
- West Midlands - 9%
- East - 7%
- London - 12%
- South East - 14%
- South West - 7%
- Wales - 4%
- Scotland - 8%
- Northern Ireland - 3%
This research was delivered by AudienceNet on behalf of the IPO. Findings and opinions are those of the researchers, not necessarily the views of the IPO or the government.