Section 4 - Policy Costing
Published 23 April 2020

© Crown copyright 2020
This publication is licensed under the terms of the Open Government Licence v3.0 except where otherwise stated. To view this licence, visit nationalarchives.gov.uk/doc/open-government-licence/version/3 or write to the Information Policy Team, The National Archives, Kew, London TW9 4DU, or email: psi@nationalarchives.gov.uk.
Where we have identified any third party copyright information you will need to obtain permission from the copyright holders concerned.
This publication is available at https://www.gov.uk/government/publications/independent-loan-charge-review-summary-of-evidence/section-4-policy-costing
Scorecard yield
A package of measures to tackle employment DR schemes was announced at Budget 2016. The package included changes to the anti-avoidance rules introduced in 2011 to discourage individuals from entering into DR avoidance, and the loan charge to tackle historical use. The package was estimated at that time to raise over £2.5 billion up to 2020 to 2021.
At Autumn Statement 2016, a similar package was announced to tackle self-employed DR schemes, which was estimated to raise £630 million up to 2021 to 2022.
When the government refers to the loan charge yield, both measures are combined to get to around £3.2 billion. The costings for the measures were certified by the Office of Budget Responsibility (OBR) at Budget 2016 and Autumn Statement 2016. The published figures for both measures are set out in Table 22 below.
| 2016 to 2017 | 2017 to 2018 | 2018 to 2019 | 2019 to 2020 | 2020 to 2021 | 2021 to 2022 | Total | |
|---|---|---|---|---|---|---|---|
| Budget 2016 | £100m | £335m | £645m | £1,235m | £215m | - | £2,530 |
| Autumn Statement 2016 | £10m | £25m | £180m | £310m | £40m | £65m | £630m |
| Total | £110m | £360m | £825m | £1,545m | £255m | £65m | £3,160m |
Scorecard methodology
The costing for the DR measure is estimated by firstly determining the value of the tax base. The tax base consists of historic tax due from use of DR avoidance schemes and use anticipated in the future in the absence of a policy change for individuals and employers. The costing accounts for people being unable to pay, as well as those who move to other forms of tax avoidance. It also accounts for a small proportion of previously unidentified cases coming forward.
The costing excludes revenue that has been scored under the Accelerated Payments measure from Budget 2014. It is anticipated that some cases that have previously been included in the Accelerated Payments measure might end up settling, paying the loan charge or deterred from engaging in future avoidance. The yield from these cases have therefore been excluded in the DR costing to avoid double counting.
The costing methodology for the DR measures is set out in more details in the diagrams
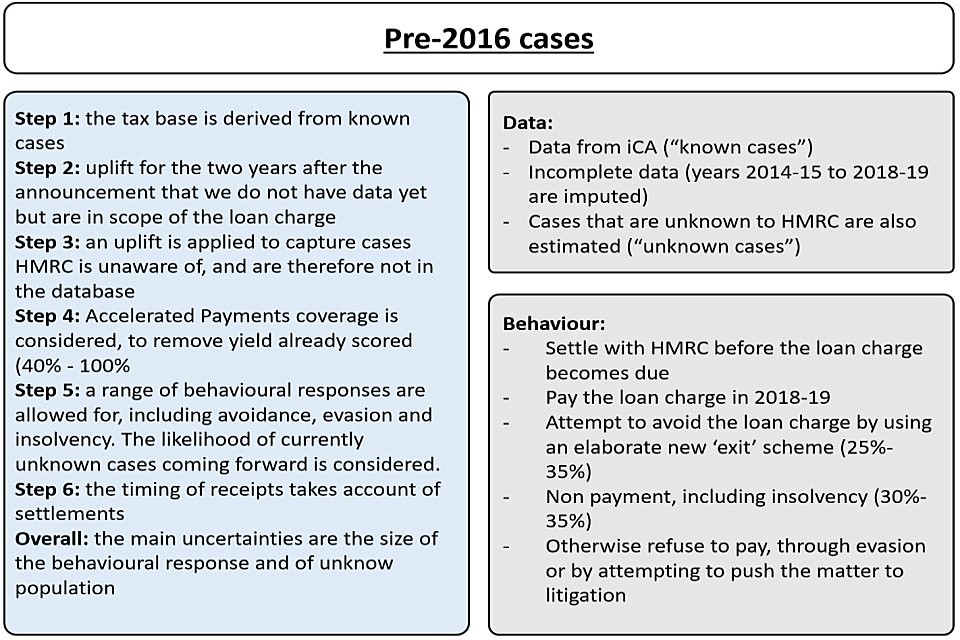
Diagram of pre-2016 cases.
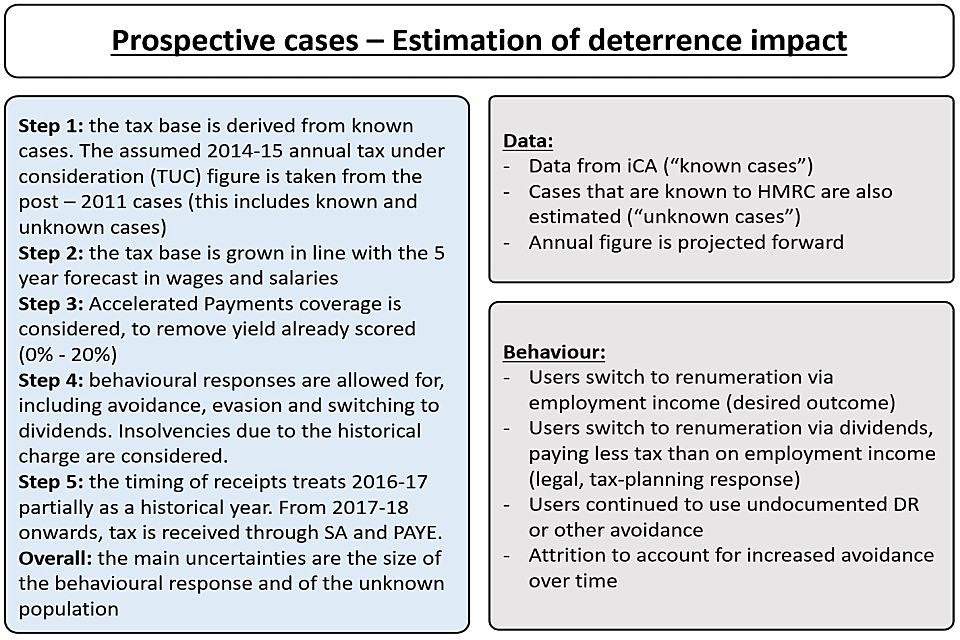
Diagram of prospective cases.
A breakdown of the original costings by settlement, loan charge and deterrence (behavioural yield) for employers and individuals is set out in Table 23 below
| Employers | Individuals | Total | ||||
|---|---|---|---|---|---|---|
| Original costing in 2016 | £m | Percentage of total | £m | Percentage of total | £m | Percentage of overall total |
| Settlement | 245 | 74% | 90 | 26% | 335 | 11% |
| Loan charge | 880 | 72% | 345 | 28% | 1,225 | 39% |
| Deterrence | 1,110 | 69% | 500 | 31% | 1,610 | 51% |
| Overall total | 2,240 | 71% | 930 | 29% | 3,170 | 100% |
As shown in the above table, about 74% and 72% of the estimated yield from settlement and loan charge respectively are from employers in our original forecasts. The estimate for settlements and loan charge combined is around 72%.
When setting out the proportion of yield from employers publicly, we have rounded the estimate to 75% to account for additional settlement yield (c£100m) from large corporate employers that were not included in our original costing to ensure our estimate best reflects the overall position of the DR measures.
Updates since Budget 2016
The forecasts for the DR measures have been re-costed in previous fiscal events to reflect latest operational data and outturn on DR cases. The forecasts have also been updated to include a payment profile to better reflect the profile of exchequer receipts. These changes and latest scorecards have been shared and agreed with the OBR in each of the six fiscal events since Budget 2016.
A breakdown of the re-costings from Spring Statement 2019 is set out in Table 24 below. This reflects the overall impact of the DR measures across years.
| Employers | Individuals | Total | ||||
|---|---|---|---|---|---|---|
| Re-costing from Spring Statement 2019 | £m | Percentage of total | £m | Percentage of total | £m | Percentage of overall total |
| Settlement | 555 | 74% | 195 | 26% | 750 | 22% |
| Loan charge | 425 | 50% | 425 | 50% | 850 | 25% |
| Deterrence | 1,265 | 72% | 500 | 28% | 1,760 | 52% |
| Overall total | 2,245 | 67% | 1,115 | 33% | 3,365 | 100% |
The settlement amounts in the scorecard are not comparable with those set out in the settlements section of this publication because the scorecard is net of amounts scored under Accelerated Payments.
Table 25 below shows the changes between Budget 2016 and Spring Statement 2019:
| Variance between Budget 2016 and Spring Statement 2019 (£m) | Employers | Individuals | Total |
|---|---|---|---|
| Settlement | 310 | 105 | 415 |
| Loan charge | -455 | 80 | -375 |
| Deterrence | 155 | 0 | 150 |
| Overall total | 5 | 185 | 195 |
At Budget 2016, the government published its policy costings for the employment DR measures.
At the Autumn Statement 2016, the government published its policy costings for the self-employment measures and the Corporation Tax changes.
In January 2016, the Office of Budget Responsibility (OBR) published its evaluation of recent anti-avoidance measures, which includes the 2011 DR legislation. They found that the measure brought in £3.9 billion, £100 million more than expected.
One of the key assumptions that affects the Exchequer yield is the interaction with the Accelerated Payments (AP) measure. Table 26 below shows the 2016 costings breakdown after the AP interaction has been taken into consideration.
| Employers | Individuals | Total | ||||
|---|---|---|---|---|---|---|
| £m | Percentage of total | £m | Percentage of total | £m | Percentage of total | |
| Settlement forecast | 245 | 74% | 90 | 27% | 335 | 11% |
| Loan charge forecast | 880 | 72% | 345 | 28% | 1,225 | 39% |
| Deterrence forecast | 1,110 | 69% | 500 | 31% | 1,610 | 51% |
| Overall total forecast | 2,240 | 71% | 930 | 29% | 3,170 | 100% |
Table 27 below removes the AP interaction. These AP adjustments are simply for the purposes of the avoiding double counting, and do not reflect the expected overall impact on individuals and employers affected by the DR measures.
| Employers | Individuals | Total | ||||
|---|---|---|---|---|---|---|
| £m | Percentage of total | £m | Percentage of total | £m | Percentage of total | |
| Settlement forecast | 380 | 76% | 120 | 24% | 500 | 12% |
| Loan charge forecast | 1,635 | 77% | 500 | 23% | 2,130 | 50% |
| Deterrence forecast | 1,160 | 70% | 505 | 30% | 1,665 | 39% |
| Overall total forecast | 3,180 | 74% | 1,120 | 26% | 4,300 | 100% |
The deterrence forecast is not relevant to the loan charge as it is about the behavioural impact of changes to 2011 DR rules. We believe that this is a more meaningful basis for looking at the share of revenues from the DR measures is to use the settlement plus loan charge forecasts. If the deterrence is removed, the proportions coming from employers and individuals are as follows in Table 28.
| Employers | Individuals | Total | ||||
|---|---|---|---|---|---|---|
| £m | Percentage of total | £m | Percentage of total | £m | Percentage of total | |
| Settlement and loan charge forecast | 2,105 | 77% | 615 | 23% | 2,630 | 61% |
2019 Costings
As part of the routine Budget 2019 forecast process, we have been updating the DR costing, which has been shared with the OBR.
Table 29 below shows the current Budget 2019 forecast including the AP interaction.
| Employers | Individuals | Total | ||||
|---|---|---|---|---|---|---|
| £m | Percentage of total | £m | Percentage of total | £m | Percentage of total | |
| Settlement forecast | 930 | 76% | 295 | 24% | 1,230 | 35% |
| Loan charge forecast | 130 | 30% | 305 | 70% | 440 | 12% |
| Deterrence forecast | 1,200 | 64% | 675 | 36% | 1,880 | 39% |
| Overall total forecast | 2,265 | 64% | 1,280 | 36% | 3,545 | 100% |
Table 30 below shows the current Budget 2019 forecast excluding the AP interaction.
| Employers | Individuals | Total | ||||
|---|---|---|---|---|---|---|
| £m | Percentage of total | £m | Percentage of total | £m | Percentage of total | |
| Settlement forecast | 1,690 | 79% | 455 | 21% | 2,150 | 45% |
| Loan charge forecast | 275 | 37% | 475 | 63% | 745 | 16% |
| Deterrence forecast | 1,200 | 64% | 675 | 36% | 1,880 | 39% |
| Overall total forecast | 3,165 | 66% | 1,610 | 34% | 4,770 | 100% |
Table 31 below shows the deterrence forecast removed.
| Employers | Individuals | Total | ||||
|---|---|---|---|---|---|---|
| £m | Percentage of total | £m | Percentage of total | £m | Percentage of total | |
| Settlement and loan charge forecast | 1,965 | 68% | 930 | 32% | 2,895 | 61% |
The changes to the employer/individual breakdown since 2016 is due to more up to date information becoming available on the amount of tax avoided by individuals.
The changes since the 2016 costing are summarised in Table 32 below .
| Employers | Individuals | Total | |
|---|---|---|---|
| £m | £m | £m | |
| Settlement forecast | 1,310 | 335 | 1,650 |
| Loan charge forecast | -1,360 | -25 | -1,385 |
| Deterrence forecast | 40 | 170 | 215 |
| Overall total forecast | -15 | 490 | 470 |
| Settlement and loan charge forecast | -50 | 315 | 265 |
The changes are caused by a better understanding of the tax base, the value of settlements, the interaction with the AP measure and to update the payment profile to better reflect the profile of Exchequer receipts.
As with any other costing, there is always a degree of uncertainty with any forecast estimates. We will continue to review and update the forecasts and modelling assumptions going forward. In particular, we will undertake a comprehensive look at the assumptions once we know the outcomes from the review and how many have included the loan charge in their 2018 to 2019 Self Assessment.
Go to section 5: Challenges to the loan charge.