Section 1 - Use of Disguised Remuneration avoidance schemes over time
Published 23 April 2020

© Crown copyright 2020
This publication is licensed under the terms of the Open Government Licence v3.0 except where otherwise stated. To view this licence, visit nationalarchives.gov.uk/doc/open-government-licence/version/3 or write to the Information Policy Team, The National Archives, Kew, London TW9 4DU, or email: psi@nationalarchives.gov.uk.
Where we have identified any third party copyright information you will need to obtain permission from the copyright holders concerned.
This publication is available at https://www.gov.uk/government/publications/independent-loan-charge-review-summary-of-evidence/section-1-use-of-disguised-remuneration-avoidance-schemes-over-time
Use of Disguised Remuneration avoidance schemes over time
In 2013, Her Majesty’s Revenue and Customs (HMRC) formed the Counter Avoidance Directorate to bring all of our resources tackling avoidance into one place. Prior to that anti-avoidance work was undertaken across various directorates across HMRC, each with their own system and method of recording management data.
Since 2013, we have collated our information on all avoidance schemes, including Disguised Remuneration (DR), into Counter Avoidance. This resulted in the creation of the iCA database which holds records of open and closed enquiries into all avoidance schemes. We use this to keep track of how many enquiries we have open and how many we have resolved. It contains information common to all avoidance enquiries, such as the tax we expect to collect. We record tax we expect to collect when we have sufficient knowledge to know or estimate this.
There will inevitably be some scheme enquiries and settlements not updated on iCA at any given time because there will be a time difference between colleagues opening and closing enquiries and data being uploaded to iCA. The iCA data is the best centrally managed data we have about the number of open and closed enquiries into avoidance scheme use.
There is a period of time between HMRC finding out about a scheme and knowing which individuals and employers have used it. We may identify a scheme through a DOTAS disclosure or because we can see an offshore employer paying all their employees below the Income Tax personal allowance. We are then reliant on our investigations, or a disclosure on a Self Assessment return, to identify, or corroborate, an individual using a DR scheme.
Chart 1 below shows the number of DR scheme usages by individuals per year based on information from the iCA database as at 3 July 2019. A scheme usage is defined as an instance of a scheme being used by an individual during the tax year. Where an individual uses the same scheme more than once during the year it is recorded only once.
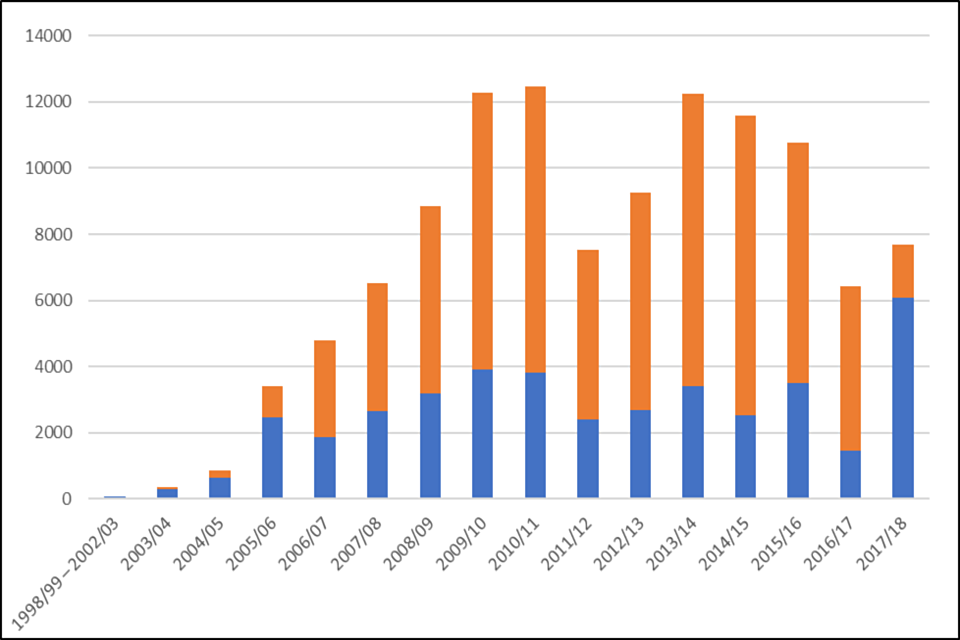
Chart showing the number of DR scheme usages by individuals per year. Source: Analysis provided by Knowledge, Analysis & Intelligence (KAI) directorate using data from Counter Avoidance Operational database
The blue bars indicate the total number of individuals entering DR for the first time in that year. The orange bars indicate the total number of usages by individuals who either had entered into a DR scheme in a previous year or entered into more than one DR scheme in their first year. We have grouped years 1998 to 1999 to 2002 to 2003 as the total number of users is very small.
This includes settled cases and does not take into consideration whether HMRC opened an enquiry into that year.
Chart 2 shows the same data for employers:
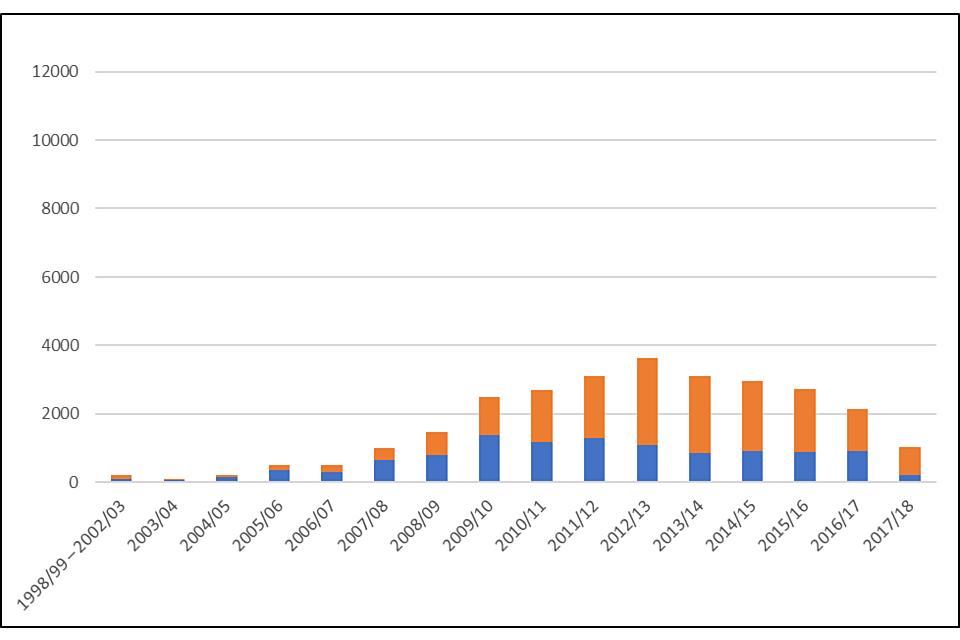
Chart showing the number of DR scheme usages by employers per year. Source: Analysis provided by KAI using data from Counter Avoidance Operational database
Tables 1 and 2 below show the underlying data for these charts, up to and including 2017 to 2018.
| Individuals | Frequency of 1st avoidance scheme usage | Frequency of subsequent avoidance scheme usage |
|---|---|---|
| 1998 to 1999 – 2002 to 2003 | 60 | <10 |
| 2003 to 2004 | 300 | 50 |
| 2004 to 2005 | 650 | 210 |
| 2005 to 2006 | 2,470 | 930 |
| 2006 to 2007 | 1,870 | 2,930 |
| 2007 to 2008 | 2,640 | 3,880 |
| 2008 to 2009 | 3,190 | 5,660 |
| 2009 to 2010 | 3,910 | 8,360 |
| 2010 to 2011 | 3,830 | 8,640 |
| 2011 to 2012 | 2,400 | 5,130 |
| 2012 to 2013 | 2,690 | 6,580 |
| 2013 to 2014 | 3,420 | 8,840 |
| 2014 to 2015 | 2,510 | 9,080 |
| 2015 to 2016 | 3,490 | 7,270 |
| 2016 to 2017 | 1,450 | 4,970 |
| 2017 to 2018 | 6,080 | 1,620 |
| Employers | Frequency of 1st avoidance scheme usage | Frequency of subsequent avoidance scheme usage |
|---|---|---|
| 1998 to 1999 – 2002 to 2003 | 110 | 90 |
| 2003 to 2004 | 70 | 40 |
| 2004 to 2005 | 150 | 70 |
| 2005 to 2006 | 370 | 140 |
| 2006 to 2007 | 290 | 220 |
| 2007 to 2008 | 650 | 360 |
| 2008 to 2009 | 800 | 660 |
| 2009 to 2010 | 1,370 | 1,120 |
| 2010 to 2011 | 1,180 | 1,530 |
| 2011 to 2012 | 1,290 | 1,820 |
| 2012 to 2013 | 1,080 | 2,540 |
| 2013 to 2014 | 850 | 2,250 |
| 2014 to 2015 | 930 | 2,020 |
| 2015 to 2016 | 890 | 1,850 |
| 2016 to 2017 | 910 | 1,240 |
| 2017 to 2018 | 220 | 820 |
Source: Analysis provided by KAI using data from Counter Avoidance Operational database
*All numbers rounded to the nearest 10, where the underlying data shows that the actual value is less than 10, then we have supressed it to ‘<10’ to prevent disclosure of potentially sensitive information.
The government introduced an additional information reporting requirement for all individuals, including employees of employers, within scope of the loan charge. They need to provide details of all their DR loans and any repayments by 30 September 2019.
We have an estimate of the tax at risk which will take into consideration the Income Tax rates and thresholds in the relevant year. The tax at risk is an important number for HMRC performance monitoring, targets and allocating resource.
Chart 3 shows the tax at risk for individuals per year, also from the iCA database as at 3 July 2019. Where we do not have a direct estimate of how much tax an individual might owe, we use an estimate based on known information. Depending on the circumstances, this could be based on a scheme average or how much an individual has put through a DR scheme previously.
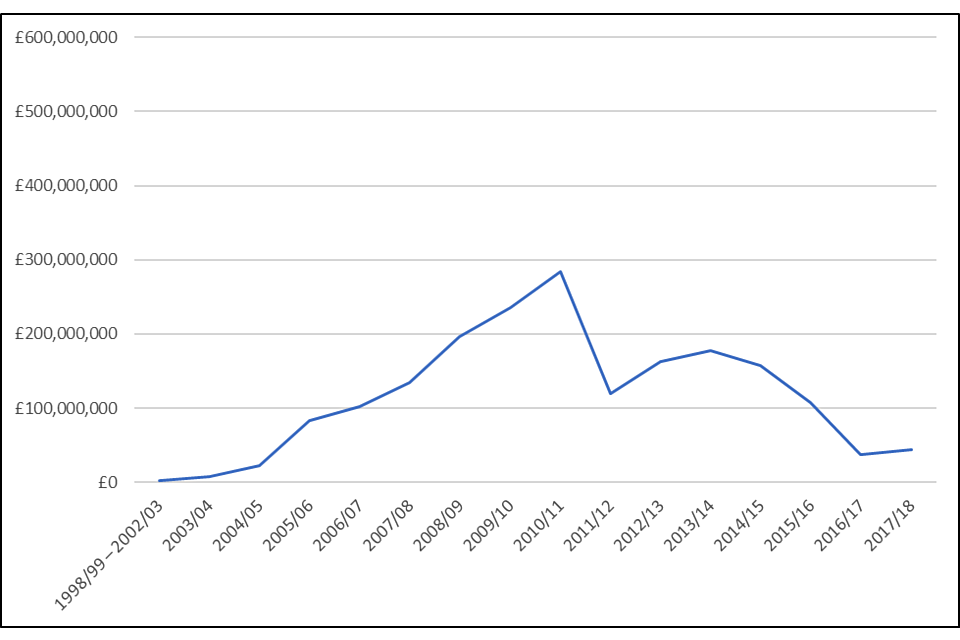
Source: Analysis provided by KAI using data from Counter-Avoidance Operational database
Chart 4 shows the same data for employers:
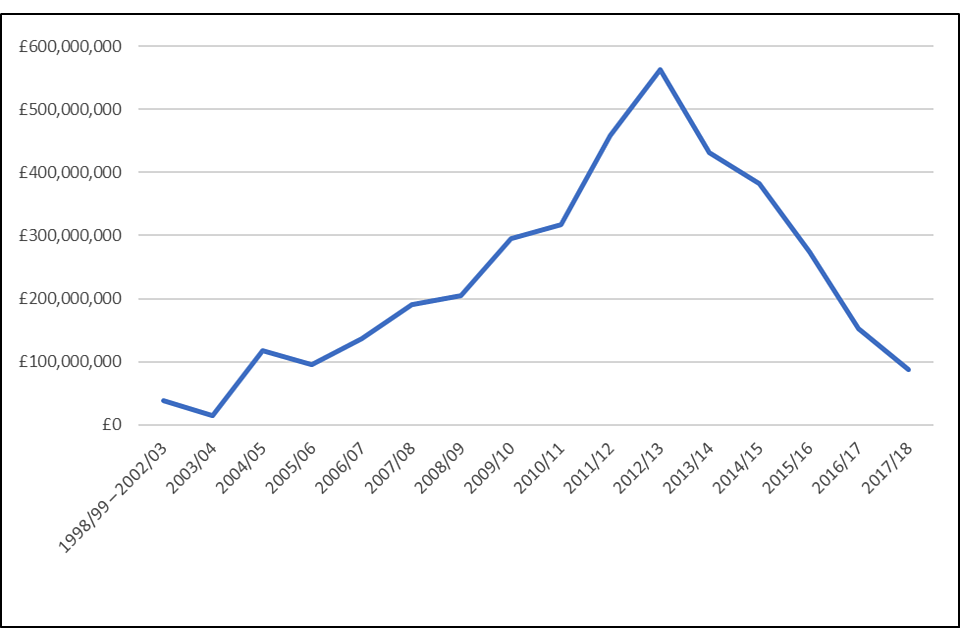
Source: Analysis provided by KAI using data from Counter-Avoidance Operational database
The underlying data for Charts 3 and 4 is available in Table 3 below, up to and including 2017 to 2018.
| | Individuals tax at risk | Employer tax at risk |
|---|---|---|
| 1998 to 1999 – 2002 2003 | £2,000,000 | £38,000,000 |
| 2003 to 2004 | £8,000,000 | £14,000,000 |
| 2004 to 2005 | £23,000,000 | £118,000,000 |
| 2005 to 2006 | £83,000,000 | £96,000,000 |
| 2006 to 2007 | £102,000,000 | £137,000,000 |
| 2007 to 2008 | £135,000,000 | £191,000,000 |
| 2008 to 2009 | £197,000,000 | £205,000,000 |
| 2009 to 2010 | £235,000,000 | £295,000,000 |
| 2010 to 2011 | £284,000,000 | £317,000,000 |
| 2011 to 2012 | £119,000,000 | £459,000,000 |
| 2012 to 2013 | £163,000,000 | £563,000,000 |
| 2013 to 2014 | £177,000,000 | £431,000,000 |
| 2014 to 2015 | £158,000,000 | £383,000,000 |
| 2015 to 2016 | £108,000,000 | £274,000,000 |
| 2016 to 2017 | £37,000,000 | £152,000,000 |
| 2017 to 2018 | £44,000,000 | £88,000,000 |
A protected year is where HMRC has notified the customer that it disputes the amount of tax paid and has a formal route to collect additional tax from that year. Protected years are sometimes referred to as open years. The processes are different for employers and individuals, which are set out in more detail below.
An unprotected year is where HMRC has no power to enforce collection of additional tax for that year, and is the absence of protection. Unprotected years are sometimes referred to as closed years.
Employers
Where we believe an employer has failed to deduct and pay the right amount of Income Tax from employment income we can issue a regulation 80 determination or assessment. This determination sets out how much additional tax we believe is due from that year.
The determination must be issued within the assessing time limits, which are as follows:
- 4 years from the end of tax year
- 6 years from the end of the tax year where the employer was careless in not paying the right amount of tax
- 20 years from the end of the tax year where the employer deliberately did not pay the right amount of tax
There is a different power covering the issue of a determination for National Insurance contributions and it has slightly different assessing time limits.
Individuals
Where an individual files a Self Assessment tax return and makes a full disclosure of their affairs we have 12 months from the date of receipt of the return if it is filed on time to open an enquiry or compliance check.
If the individual does not file a return, or they file a return and do not make a full disclosure, and we identify at a later point they have underpaid tax we can issue a discovery assessment. The time limits for issuing these are the same as the time limits set out above.
Type, number and value of unprotected years
As set out previously, iCA is used for all forms of avoidance and not just DR. Therefore, its functionality is designed to cover the common data points across all avoidance, which are the ones required for performance monitoring, such as tax at risk and when enquiries are opened. Unprotected years are not relevant for other forms of avoidance, or for monitoring performance, and therefore the iCA database does not tell us whether a year is protected or not.
We have to review the contract settlements individually for settled cases to identify if they have paid voluntary restitution for any years.
We have undertaken some stratified sampling of around 1,600 individual and 300 employer settlements to identify the number and value of unprotected years.
Unprotected years have been defined within this sample of data as years that are not under formal enquiry by HMRC, are not subject to formal assessments raised by HMRC and the statutory time limits for opening a formal enquiry or raising assessment have expired.
Table 4 below sets out the output of that analysis for schemes used since 6 April 2011.
| Individuals | Employers | |
|---|---|---|
| Proportion of years that are unprotected | 10-15% | 10-25% |
| Proportion of users with at least one unprotected year | 15-20% | 15-30% |
| Proportion of tax at risk that is unprotected | 15-20% | 15-20% |
Who has used disguised remuneration avoidance schemes
There are three broad groups who have used disguised remuneration (DR) avoidance schemes:
- Large corporate employers;
- Employers; and
- Individuals.
Large corporate employers
Large corporate employers are typically multi-national firms, historically in the financial services sector. They usually set up a bespoke arrangement to benefit the majority of their employees. They generally stopped entering DR schemes after anti-avoidance rules were introduced in 2011. The vast majority settled their use of DR schemes prior to the loan charge being enacted.
Therefore, large corporate employers and their employees do not form a material element of the population within scope of the loan charge and our responses to your information requests do not focus on them. Any references to employers do not include large corporate employers unless specified.
Employers
These employers are small and medium sized companies of varying sizes. Typically, they are close companies with turnover of low millions of pounds and profits of hundreds of thousands of pounds. They are likely to have been introduced to a DR scheme by their accountant or agent, or by an enabler selling the scheme on behalf of the promoter. The owner-directors will have decided to use the DR scheme at a board of directors meeting and chosen to use it to remunerate themselves. Each time they used a DR scheme they will have set up a new arrangement.
The vast majority of employers are close companies because external investors are unlikely to allow owner-directors to remunerate themselves in this way. Anecdotally, one of the drivers for settlement is often when the employer is purchased by a larger company, which requires all tax disputes to be settled. We are exploring whether we can extract empirical analysis of the number of employers who are close companies from our data.
Individuals
Individuals who use DR schemes typically consider themselves to be self-employed, freelancers or contractors.
We have analysed available trade, or business sector, information recorded on individual Self Assessment tax returns. This shows individuals mostly work in business management sectors, such as IT, but this group also includes medical professionals. The sector breakdown is set out in Table 5 below:
| Sector | Percentage of individuals |
|---|---|
| Business Services | 65% |
| Construction | 10% |
| Engineering | 4% |
| Medical and education services | 3% |
| Accountancy | 2% |
| Dentistry | 2% |
| Retail distribution | 2% |
| Other professional and technical services | 2% |
| Social and community services | <2% |
| Recreational services | <2% |
| Other financial activities | <2% |
| Other transport and storage | <2% |
Source: Analysis provided by KAI using HMRC administrative data
These individual workers will have provided their services to end clients or engagers via a recruitment agency. Until the DR rules took effect in April 2011, they were usually employed by an offshore employer set up for the purposes of the scheme, which invoices the agency, and ultimately end client, for the contract value. From that contract value, the offshore employer deducts their fee, pays a small salary to the individual and puts the balance through a DR scheme.
The precise structure of these schemes changed over time, with the development of self-employed, partnership and onshore employer schemes after 2011. Individuals can use the same scheme for several years.
Go to section 2: Who is liable to the loan charge.