Imperial College London: Evaluating England’s roadmap out of lockdown, 30 March 2021
Updated 13 May 2022

© Crown copyright 2022
This publication is licensed under the terms of the Open Government Licence v3.0 except where otherwise stated. To view this licence, visit nationalarchives.gov.uk/doc/open-government-licence/version/3 or write to the Information Policy Team, The National Archives, Kew, London TW9 4DU, or email: psi@nationalarchives.gov.uk.
Where we have identified any third party copyright information you will need to obtain permission from the copyright holders concerned.
This publication is available at https://www.gov.uk/government/publications/imperial-college-london-evaluating-englands-roadmap-out-of-lockdown-30-march-2021/imperial-college-london-evaluating-englands-roadmap-out-of-lockdown-30-march-2021
Lilith K Whittles, Natsuko Imai, Raphael Sonabend, Edward S Knock, Pablo N Perez-Guzman, Tara Mangal, Alexandra B Hogan, Azra Ghani, Neil M Ferguson, Marc Baguelin, Anne Cori
We evaluated the successive easing of non-pharmaceutical interventions as set out in the UK government’s Roadmap out of Lockdown for England. Detailed/specific policy changes cannot be modelled. Instead, Table 1 shows the increase in transmissibility, accounting for the considerable uncertainty associated with each step in our estimates of R. Vaccine roll out schedules (Table 3) were pre-specified. Our latest estimate of the current levels of transmissibility for England are Reff (including immunity)=0.85 (translating to Rexcl_immunity =1.30) with an estimated 34% (95%CI:26-44%) of the population currently protected via prior infection- and/or vaccine-induced immunity). Table 4 shows vaccine efficacy assumptions against severe disease, symptomatic disease and infection after each dose (Pfizer and AstraZeneca). We assumed an age-dependent vaccine uptake (Table 5). Six sensitivity analyses were run, using 1) slower vaccine roll out; 2) pessimistic vaccine efficacy; 3) impact of vaccine on infectiousness; 4) higher R after full NPI lifting (such as lower adherence to NPI measures retained); 5) no seasonality in transmission; 6) lower vaccine uptake in <50 years.
Summary
1. Due to eligibility, vaccine hesitancy, and the high transmissibility of the circulating variant, vaccination alone will not be sufficient to keep the epidemic under control.
2. Current Reff has increased and is close to 1 at 0.85 (with large uncertainty). This reflects the increasing transmissibility since school reopening on 8 March. With further relaxation of measures starting 29 March, continuous monitoring and evaluation of the roadmap is critical.
3. Assuming optimistic vaccine efficacy, even if 2.7M vaccine doses/week are given up to 1 August (2.0M thereafter), only 44.6% of the population will be protected against severe disease (due to vaccination) by 21 June ‘21 when NPIs are due to be lifted (Fig 2A).
4. Under the current “not before” timings of the roadmap and a slower vaccine roll out than assumed previously, peak hospital occupancy will be lower than the current wave but with considerable additional deaths by June ’22 (15,700; 95%CrI:4,800-26,800) (Fig 2E-F).
5. Remaining at step 2 beyond 12 April ‘21 would maintain the effective reproduction number around 1 and keep hospitalisations and deaths at very low levels (Fig 2E-F). However, these results assume compliance to high levels of restrictions for a prolonged period of time.
6. The projected epidemic trajectories vary across regions, with regions where the estimated cumulative incidence to date is high (for example London or the North West, Fig S5) projected to experience fewer cases, hospitalisations, and deaths than other regions. Particularly, the South West could experience a future wave of hospitalisations and deaths similar to or worse than the winter one (Fig S3).
7. Our results are highly dependent on the assumed (optimistic) vaccine efficacy, uptake, and roll- out speed. Due to the uncertainty surrounding these assumptions, it is critical to continuously assess the true effectiveness of vaccination within the population as it may be lower than clinical efficacy reported in trial settings, especially as and if variants of concern (VOC) are imported or emerge in England.
8. We assume no loss of infection- or vaccine-induced immunity on the time horizon of the analysis. Characterising the duration of vaccine-immunity is critical.
9. Lower vaccine efficacy and higher R after full NPI lifting had the greatest impact on potential hospitalisations and deaths (Fig 3-B4/C4 & B2/C2) with an additional 34,800 (95%CrI:20,000- 52,300) and 40,000 (95%CrI:30,000-50,000) deaths by June 2022 respectively.
10. Whilst the impact of Test Trace Isolate (TTI), mask wearing, hand hygiene, and COVID security on R is difficult to quantify, it will be vital to emphasise the importance of normalising and ensuring adherence to all measures even after “full lifting” is achieved.
11. Given the many uncertainties detailed above, it remains critical to assess the impact of each relaxation stage before committing to the next.
Table 1: Summary of two NPI easing scenarios where some restrictions are eased on specific dates resulting in an increase in transmissibility. The average and 95% quantiles of transmissibility at each stage are shown. For the overall transmissibility and associated uncertainty see Table 2.
Date of NPI release (“full lift” still retains some baseline NPI measures such as TTI and hand hygiene)
| Part 1. | 29 March 2021 | 12 April 2021 |
|---|---|---|
| Step 1b (Tier 4-like) | Step 2 (Tier 3-like) | |
| Average R (95% probability interval)* | Schools closed: 1.30 (1.16-1.45) Schools open: 1.80 (1.61-2.00) | Schools closed: 1.40 (1.21-1.61) Schools open: 1.90 (1.62-2.21) |
| Part 2 | 29 March 2021 | 12 April 2021 | 17 May 2021 | 21 June 2021 |
|---|---|---|---|---|
| Level of NPI lifting | Step 1b (Tier 4-like) | Step 2 (Tier 3-like) | Step 3 (Tier 2-like) | Step 4 (Full lift) |
| Average R (95% probability interval)* | Schools closed: 1.30 (1.16-1.45) Schools open: 1.80 (1.61-2.00) | Schools closed: 1.40 (1.21-1.61) Schools open: 1.90 (1.62-2.21) | Schools closed: 1.70 (1.42-2.01) Schools open: 2.20 (1.83-2.62) | Full lift Schools closed: 2.50 (2.05-3.02) Schools open: 3.00 (2.33 – 3.80) Higher R after full NPI lifting Schools closed: 3.50 (3.04-4.02) Schools open: 4.00 (3.32 – 4.78) |
*Here R denotes the reproduction number in the absence of immunity R_excl_immunity, see methods ‘Definitions of the reproduction number’ for definitions. The 95% probability interval is given as the 2.5 and 97.5 percentiles of a lognormal distribution, see Table 2. School holidays as set out in: City of Westminster school term and holiday dates. Easter: 1 April – 19 April 2021, half-term: 29 May – 7 Jun ’21; Summer: 24 July – 31 August 2021
Table 2: Overview of transmissibility and uncertainty associated with each release step, excluding immunity (Rexcl_immunity) (see Methods ‘Definitions of the reproduction number’), assuming 66% of the population in England is currently susceptible to infection after accounting for infection-induced and vaccine-induced population immunity.
| Rexcl_immunity: mean (95% CI) | sd | meanlog | sdlog | |
|---|---|---|---|---|
| School reopening (Step 1a - current level) | 1.30 (1.01-1.98) | 0.22 | - | - |
| Step 1b Schools closed | 1.30 (1.16-1.45) | 0.075 | 0.261 | 0.058 |
| Schools open | 1.80 (1.61-2.00) | 0.1 | 0.586 | 0.056 |
| Step 2 Schools closed | 1.40 (1.21-1.61) | 0.1 | 0.334 | 0.071 |
| Schools open | 1.90 (1.62-2.21) | 0.15 | 0.639 | 0.079 |
| Step 3 Schools closed | 1.70 (1.42-2.01) | 0.15 | 0.530 | 0.088 |
| Schools open | 2.20 (1.83-2.62) | 0.2 | 0.784 | 0.091 |
| Step 4 (full lift)^ Schools closed | 2.50 (2.05-3.02) (moderate baseline NPIs retained) | 0.250 | 0.911 | 0.100 |
| 3.50 (3.04-4.02) (higher R after full NPI lifting**) | 0.250 | 1.250 | 0.071 | |
| Schools open | 3.00 (2.33-3.80) (moderate baseline NPIs retained) | 0.375 | 1.090 | 0.125 |
| 4.00 (3.32-4.78) (higher R after full NPI lifting**) | 0.375 | 1.380 | 0.094 |
**Higher R after full NPI lifting or “Lower adherence to baseline NPIs” values were used for sensitivity analyses only. ^Assumes some control such as TTI and hand hygiene continue.
Figure 1: Distributions of transmissibility (Rexcl_immunity) associated with each step of NPI lifting. Values of R excl immunity were constrained so they could only increase over time except during school holidays when R excl immunity was decreased on average by -0.5. (For full details see Table 2).
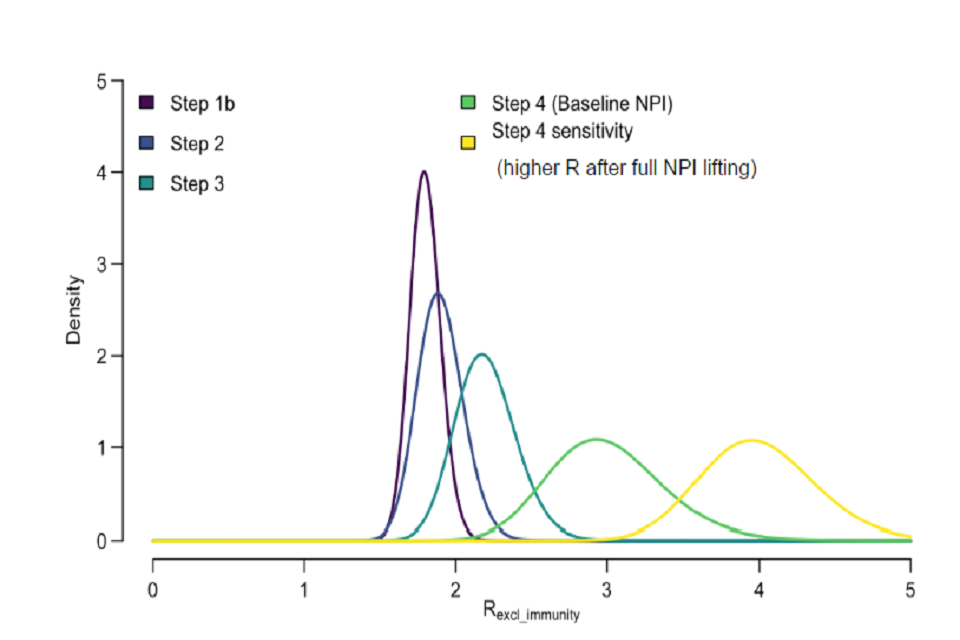
Graph displaying distributions of transmissibility associated with lifting various NPIs. Different colours represent different steps. Step 1b: maroon. Step 2: navy. Step 3: teal. Step 4: green. Step 4 (with full NPI lifting): yellow.
Table 3: Pre-specified vaccination schedule (million doses per week)
| Weeks commencing | England doses / week Central (main analysis) | Slower roll out (sensitivity analysis) |
|---|---|---|
| 29-March to 26-July | Average 2.7 M | Average 2.5 M |
| 2-Aug onwards | 2.0 M | 2.0 M |
Table 4: Vaccine efficacy assumptions for AstraZeneca (AZ, assumed to be 80% of the vaccine doses distributed) and Pfizer (PF, assumed to be 20% of the vaccine doses distributed).
Efficacy against severe disease
| Vaccine | Central (Main analysis) | Pessimistic vaccine efficacy* | Impact of vaccine on infectiousness* | Reference |
|---|---|---|---|---|
| AZ (1 dose) | 80% | 70% | As central | Voysey et al [footnote 1] Bernal et al [footnote 2] |
| AZ (2 doses) | 80% | 70% | As central | As above |
| PF (1 dose) | 80% | 55% | As central | Bernal et al [footnote 2] PHE [footnote 6] Amit et al [footnote 3] |
| PF (2 doses) | 98% | 90% | As central | Hall et al[footnote 4] PHE [footnote 6] Polack et al [footnote 5] |
Efficacy against disease
| Vaccine | Central (Main analysis) | Pessimistic vaccine efficacy* | Impact of vaccine on infectiousness* | Reference |
|---|---|---|---|---|
| AZ (1 dose) | 63% | 50% | As central | Voysey et al [footnote 1] |
| AZ (2 doses) | 63% | 50% | As central | As above |
| PF (1 dose) | 65% | 55% | As central | PHE [footnote 6] |
| PF (2 doses) | 94% | 90% | As central | Polack et al [footnote 5] |
Efficacy against infection
| Vaccine | Central (Main analysis) | Pessimistic vaccine efficacy* | Impact of vaccine on infectiousness* | Reference |
|---|---|---|---|---|
| AZ (1 dose) | 63% | 50% | As central | See above “efficacy against disease” |
| AZ (2 doses) | 63% | 50% | As central | See above “efficacy against disease |
| PF (1 dose) | 65% | 55% | As central | See above “efficacy against disease |
| PF (2 doses) | 94% | 90% | As central | See above “efficacy against disease |
Efficacy against infectiousness
| Vaccine | Central (Main analysis) | Pessimistic vaccine efficacy* | Impact of vaccine on infectiousness* | Reference |
|---|---|---|---|---|
| AZ/PF (1 dose) | 0% | As central | 0% | - |
| AZ/PF (2 doses) | 0% | As central | 30% | Shah et al [footnote 7] |
*These values were used for sensitivity analyses only.
Table 5: Vaccine uptake assumptions by group or age. Uptake was assumed to be the same for vaccine doses 1 and 2.
| Group | Uptake (main analysis) | Sensitivity analysis |
|---|---|---|
| Care home residents (CHR) | 95% | 95% |
| Care home workers (CHW) | 85% | 85% |
| 80+ years* | 95% | 95% |
| 50-80 years* | 95% | 95% |
| <50 years* | 90% | 80% |
*not working or residing in a care home.
Caveats and key assumptions
1. We assume no loss of infection-induced or vaccine-induced immunity over the time horizon of the analysis (optimistic).
2. We assume that vaccine roll out pace of 2.0M doses per week from 2 August 2021 onwards can be maintained (unclear). Note that this roll out speed is much slower than assumed previously for informing the “Roadmap out of lockdown”.
3. We assume high vaccine uptake across all age groups (optimistic) and further assume that uptake is homogeneous within and across regions.
4. We assume the vaccines provide some protection against infection in addition to protection from severe disease and death (optimistic).
5. We assume the vaccines prevents to a certain extent, an infected person who is vaccinated from transmitting the virus (optimistic, although only assumed in 1 sensitivity analysis).
6. The gradual lifting of NPIs has been modelled as a step-wise increase in R. We do not model any specific policy change, rather an assumed change in the corresponding level of transmission. Note that there is considerable uncertainty around these assumptions (unclear).
7. We assume that mixing patterns under each Tier are the same as in autumn 2020 and these levels are fixed (unclear).
8. We model school holidays by assuming an average decrease in R_excl_immunity of 0.5 whilst schools are closed (unclear).
9. We do not model school holidays beyond September 2021 when evaluating outcomes up to June 2022 under Part 2 releases (pessimistic/unclear).
10. We assume no correlation between vaccine uptake and risk of severe infection. If uptake were to be lower in groups at higher risk of severe disease (for example ethnic groups), our results would be too optimistic in terms of hospitalisations and deaths (optimistic).
11. We do not model differential infectivity or susceptibility by age (unclear).
12. We assume no dynamic replenishment of the care-home population (optimistic).
13. We assume that some level of transmission control remains even after “fully lifting” NPIs (Table 1) through measures such as TTI and hand hygiene (optimistic).
14. We only capture cases, hospitalisations and deaths occurring up to 5 July 2021 for Part 1 scenarios where no further release steps are taken after 12 April 2021.
15. Note that not all scenarios under “Part 2” have reached an equilibrium with respect to the number of additional deaths by June 2022.
16. We do not model the potential establishment and transmission of other VOC such as immune escape variants (optimistic).
Results
With the central vaccine roll-out set out in Table 3, and the uptake assumed (see Table 5), the proportion of the population protected against severe disease through vaccination will stabilise and plateau around 61% in late summer 2021 (Figure 2A). This relatively low value stems from 1) not vaccinating the <18-year-olds, and imperfect vaccine 2) efficacy (see Table 4) and 3) uptake (see Table 5). [78.6% population eligible for vaccination x average 93.5% uptake amongst those eligible x 83.6% (“central”) efficacy against severe disease with 2 doses = 61%]. Note that this leaves a large pool of children (<18 years) who are not eligible for vaccination and who contribute to transmission.
Figure 2B shows, for our central assumptions, the extent to which the population will be protected over time, through a combination of vaccination and natural infection. This illustrates that vaccination alone is not sufficient to bring the epidemic under control, particularly with the slower vaccine roll out to that assumed previously.
Strategies which lift NPIs very gradually (Part 1, where no further NPIs are released after 12 April 2021) are able to maintain the effective reproduction number around 1 (Figure 2D), keeping cases, hospitalisations, and deaths low. However, this relies on a high level of restrictions for an extended period of time.
The current roadmap where NPIs will be released sequentially including after 12 April 2021 (Table 1, part 2) will lead to another wave of hospitalisations although on a smaller scale to that recently experienced. However, this will still result in a substantial number of additional deaths (15,700, 95%CrI:4,800, 26,800) by 1 June 2022. Note that the number of additional deaths under this and other scenarios have not yet plateaued by June 2022 and so further COVID-19 deaths beyond this date are probable. The total deaths estimated is lower than predicted in one of our previous reports due to the much higher vaccine uptake assumed.
Current Reff is already close to 1 at 0.85 (with large uncertainty). This is higher than last week’s estimate and likely reflects increasing transmissibility since school reopening on 8 March. With further relaxation of measures starting 29 March, continuous monitoring and evaluation of the roadmap is critical.
The projected epidemic trajectories vary across regions (Figures S3 main scenario and S4 higher R after full NPI lifting sensitivity analysis). Regions which were worst hit by the epidemic so far, for example London or the North West, where we estimate 39% (95% CrI 31%-46%) and 31% (95% CrI: 26%-38%) of individuals have been infected to date (Figure S5) are projected to experience much fewer cases, hospitalisations, and deaths than other regions. However, we make the optimistic assumption of infection-acquired (and vaccine-acquired) immunity lasting longer than the time horizon of this analysis. This may be unrealistic particularly if new immune escape variants emerge in England. These results also assume high vaccine uptake in these regions as outlined in Table 5. Conversely, the South West, where only 15% (95% CrI:12%-19%) of the population is estimated to have been infected to date, could experience a future wave of hospitalisations and deaths similar to or worse than the winter one.
Our results are highly dependent on the underlying assumptions about vaccine roll out, transmissibility after NPI lifting (see Table 2) and vaccine efficacy (Figure 3). Assuming a return to higher values of R after full NPI lifting (respectively pessimistic vaccine efficacy) would lead to a third wave of hospitalisations and deaths similar in magnitude to (respectively slightly smaller than) the most recent wave (Figures 3 & S1-2). Even in London, which in our central analysis is projected to experience very few additional deaths, a higher R after full NPI lifting would lead to a third wave of infection, hospitalisations and deaths, albeit of a much smaller magnitude compared to the past winter wave (Figure S4).
If vaccines reduce the risk of onward transmission from a vaccinated individual who becomes infected (optimistic), then the number of deaths is similar at 1,200 (95% CrI: 800, 2,000) under Part 1 releases up to 5 July 2021 (compared to 1,400 deaths (95%CrI:800, 2,500) assuming no impact of vaccine on onward transmission). For the full roadmap (Part 2) there is a greater effect with the efficacy against onward transmission reducing the number of deaths to 9,300 (95% CrI: 2,200, 16,000) by 1 June 2022. A lower vaccine uptake of 80% (compared to 90% in the main analysis) amongst the <50 years did not significantly increase the peak hospital occupancy or total estimated deaths by June 2022 (Table 6, Figure 3-A7 & B7). Seasonality in transmission did not substantially affect the results but reduced and broadened the peak of hospitalisations compared to a scenario with no seasonality (Figures 3 & S1-2). In some regions, for example the North West, seasonality did affect the timing of the peak of the projected future wave, with a later peak projected with seasonality than without (figure not shown).
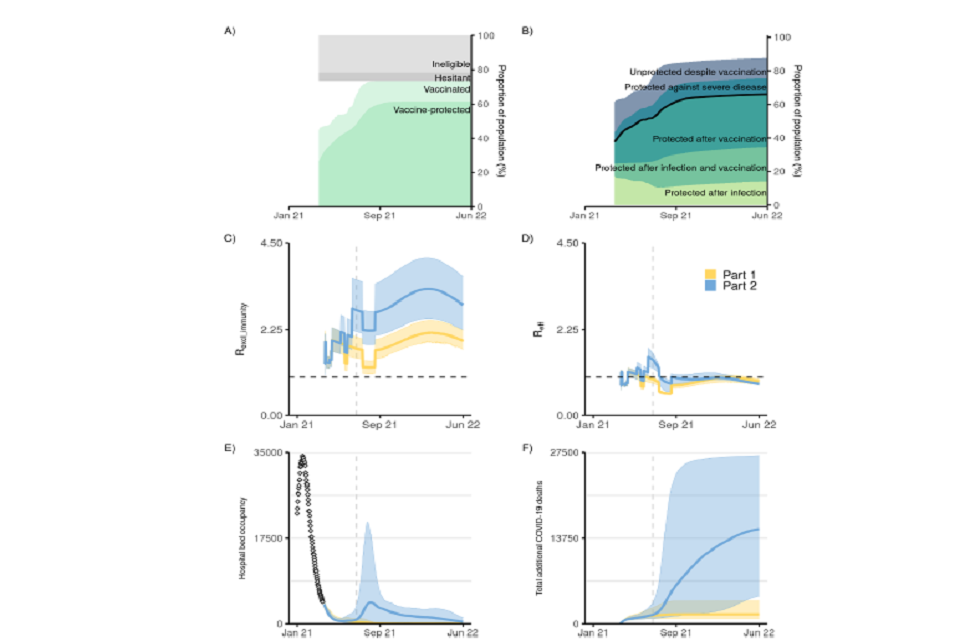
6 graphs labelled A to F (left to right top to bottom). X-axis plots Jan 2021 to June 2022. A: percent of vaccinated pop. B: pop immunity as percentages. C and D: transmissibility exc and inc immunity, respectively. E: hospital bed occupancy. F: cumulative COVID-deaths
Figure 2: Impact of vaccine roll-out and NPI lifting on the epidemic dynamic in England.
(A) Proportion of the population in England protected against severe disease through vaccination over time (dark green shading) and vaccinated (having received one dose) over time (light green shading) (Table 4). The grey shaded areas show the proportion of the population ineligible for vaccination (such as <18 years, light grey) and those who are vaccine hesitant and not taking the vaccine (dark grey) (see Table 5).
(B) Proportion of the population protected (from bottom to top): after natural infection, after natural infection and vaccination, after vaccination, against severe disease (but not against infection) after vaccination, and those unprotected despite vaccination over time.
(C) Increase in mixing (measured as R_excl_immunity, coloured lines) under different release strategies over time and
(D) Effective reproduction number over time under the two release scenarios explored.
(E) COVID-19 hospital occupancy (general wards and ICU)
(F) Cumulative COVID-19 deaths (counted from 26 Mar 2021) under the two release strategies. In panel E, the points at the start (Jan 21) show the recent reported data. The release strategies considered are Step Part1 (yellow) and Part 2 (blue) as set out in Table 1. In panels C-D the coloured lines show the mean; in panels E-F the coloured lines show the median. In panels C-F the shaded areas show the 95% credible intervals. This figure shows results assuming moderate baseline measures are retained after NPI lifting (see Table 2), “central” vaccine efficacy, vaccine roll-out and uptake described in Tables 3 and 5, and a small effect of seasonality (+/-10% relative change in transmissibility throughout the year. See methods for definitions of Reff and Rexcl_immunity and seasonality. The vertical dashed line denotes 5 July 2021, 12 weeks after the Step 2 release date.
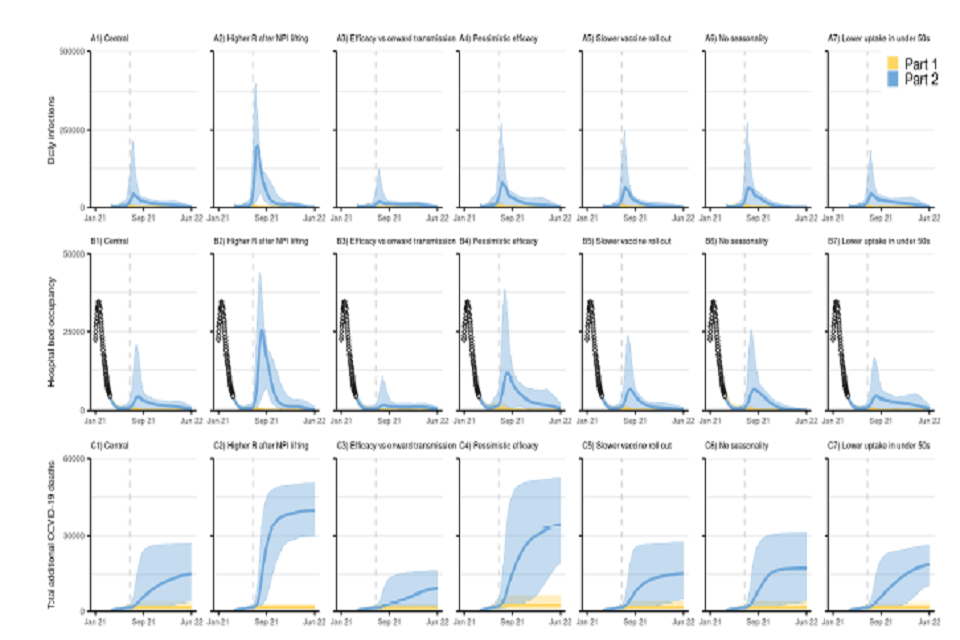
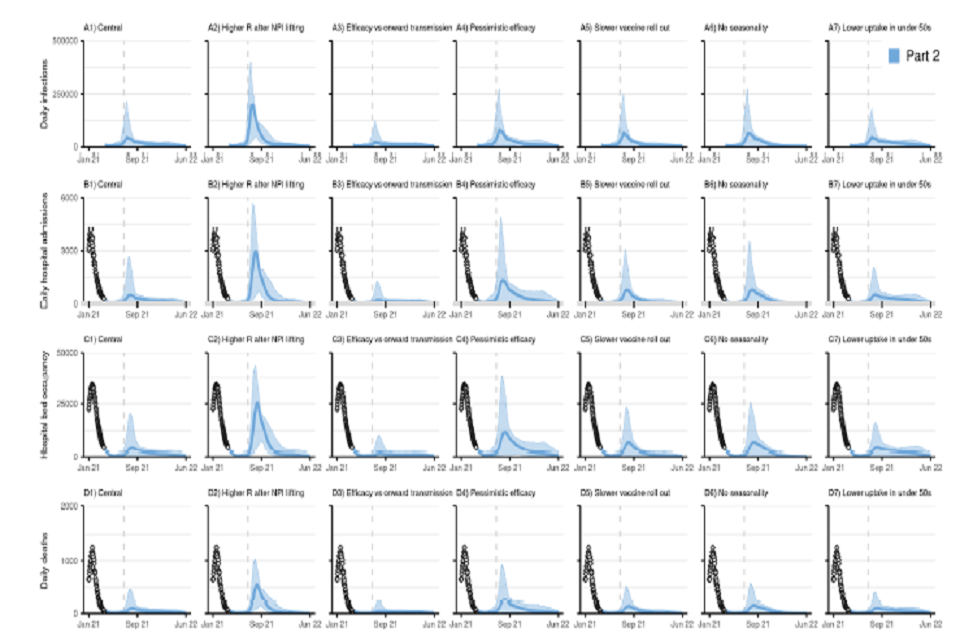
21 graphs, shown in a 7 by 3 grid. All have x-axes tracking from January 2021 to June 2022. Rows show daily infections (top), hospital bed occupancy (middle) and cumulative COVID-deaths (bottom). Columns present varying scenario conditions.
Figure 3: Sensitivity analyses.
England COVID-19 (top: A1-A7) daily infections, (middle: B1-B7) hospital bed occupancy (general wards and ICU) and (bottom: C1-C7): cumulative deaths (counted from 26 Mar 2021) assuming part 1 (yellow) and part 2 (blue) release of NPIs over time as set out in Table 1, with vaccine roll out and uptake assumptions as in Tables 3 and 5 respectively. A1-C1 show our main analysis with a “central” transmissibility after NPI lifting where moderate baseline NPIs are retained (see Table 2), “central” vaccine efficacy (see Table 4), central vaccine roll-out and uptake described in Tables 3 and 5, and accounts for seasonality in transmission. A2-C2 assume a higher R after NPIs are “fully” lifted (lower adherence to baseline NPIs) (Rexcl_immunity = 4) as shown in Table 2. A3-D3 assume vaccine efficacy against onwards transmission. A4-D4 assuming a “pessimistic” vaccine efficacy as set out in Table 4. A5-C5 assume a slower vaccine roll out as set out in Table 3. A6-C6 assume no effect of seasonality in transmission. A7-C7 assume lower vaccine uptake in <50 years (Table 5). The points at the start of panels B1-B7 (Jan-Mar 21) show the recent reported data. The coloured lines show the median and the shaded areas the 95% credible intervals. Note the y-axis scale is different to that in Figure 2E-F. The vertical dashed line denotes 5 July 2021, 12 weeks after the Step 2 release date.
Table 6: Cumulative deaths, cumulative hospital admissions, cumulative incidence and peak hospital occupancy (mean (95% CrI), nearest 100) between 26 Mar 2021 and 5 Jul 2021 for Part 1 and between 26 Mar 2021 and 1 Jun 2022 for Part 2 under different vaccination scenarios considered. Unless otherwise specified in “Analysis Type”, results assume “central” values of vaccine efficacy, vaccine roll out, return to baseline NPIs of Rexcl_immunity = 3 (when schools are open), and account for seasonality.
Up to 5 July 2021
| Analysis type | NPI lifting scenario | Cumulative deaths (95%CrI) | Cumulative hospital admissions (95%CrI) | Cumulative incidence (95%CrI) | Peak hospital occupancy^ (95%CrI) |
|---|---|---|---|---|---|
| Main analysis | Part 1 (no further lifting after 12 April) | 1,400 (800, 2,500) | 6,200 (3,000, 12,200) | 357,200 (114,800, 880,200) | 4,000 (3,500, 4,700) |
| Higher R after full NPI lifting* (Rexcl_immunity=4) | Part 1 (no further lifting after 12 April) | 1,400 (800, 2,500) | 6,200 (3,000, 12,200) | 357,200 (114,800, 880,200) | 4,000 (3,500, 4,700) |
| Lower vaccine efficacy** | Part 1 (no further lifting after 12 April) | 2,000 (1,000, 4,000) | 9,500 (3,600, 20,800) | 496,600 (127,000, 1,273,900) | 4,000 (3,500, 4,900) |
| Slower vaccine roll out*** | Part 1 (no further lifting after 12 April) | 1,400 (800, 2,500) | 6,600 (3,100, 12,300) | 387,900 (125,000, 918,900) | 4,000 (3,400, 4,600) |
| Efficacy against onwards transmission** | Part 1 (no further lifting after 12 April) | 1,200 (800, 2,000) | 5,000 (2,400, 10,100) | 258,900 (82,600, 677,800) | 4,000 (3,500, 4,800) |
| Without seasonality | Part 1 (no further lifting after 12 April) | 1,300 (800, 2,700) | 5,500 (2,600, 14,100) | 306,800 (91,000, 1,002,000) | 4,100 (3,500, 5,500) |
| Lower (80%) vaccine uptake in <50 yrs | Part 1 (no further lifting after 12 April) | 1,400 (900, 2,500) | 6,300 (2,900, 12,900) | 357,400 (114,100, 69,600) | 4,000 (3,500, 4,800) |
Up to 1 June 2022
| Analysis type | NPI lifting scenario | Cumulative deaths (95%CrI) | Cumulative hospital admissions (95%CrI) | Cumulative incidence (95%CrI) | Peak hospital occupancy^ (95%CrI) |
|---|---|---|---|---|---|
| Main analysis | Part 2 (full lift 21 June) | 15,700 (4,800, 26,800) | 79,400 (30,800, 138,100) | 5,642,800 (2,234,300, 9,408,500) | 6,800 (3,700, 20,500) |
| Higher R after full NPI lifting* (Rexcl_immunity=4) | Part 2 (full lift 21 June) | 40,000 (30,000, 50,000) | 204,300 (166,000, 246,600) | 12,590,000 (10,029,900, 15,355,900) | 26,700 (13,700, 43,900) |
| Lower vaccine efficacy** | Part 2 (full lift 21 June) | 34,800 (20,000, 52,300) | 168,000 (96,300, 248,900) | 8,319,400 (4,874,300, 12,406,400) | 14,600 (4,600, 38,600) |
| Slower vaccine roll out*** | Part 2 (full lift 21 June) | 16,000 (5,500, 26,900) | 83,000 (27,300, 141,300) | 5,813,700 (1,941,600, 10,191,200) | 8,700 (3,600, 22,800) |
| Efficacy against onwards transmission** | Part 2 (full lift 21 June) | 9,300 (2,200, 16,000) | 47,200 (8,300, 76,900) | 3,818,500 (599,000, 6,336,100) | 4,500 (3,500, 9,700) |
| Without seasonality | Part 2 (full lift 21 June) | 17,600 (4,300, 30,300) | 88,300 (27,100, 154,300) | 6,150,200 (2,022,500, 10,595,900) | 9,200 (3,800, 25,600) |
| Lower (80%) vaccine uptake in <50 yrs | Part 2 (full lift 21 June) | 19,000 (10,800, 26,200) | 97,200 (59,800, 130,700) | 6,597,600 (4,273,200, 9,295,200) | 6,600 (3,800, 16,400) |
*R_excl_immunity used after NPI relaxation (see Tables 1 and 2 and text for detail). **See Table 4 for details.
***See Table 3 for details. ^Peak hospital occupancy was calculated as the maximum hospital occupancy over the horizon considered (26 March 2021 to 5 July 2021 for Part 1 and 26 March 2021 to 1 June 2022 for Part 2); when hospital occupancy was predicted to decrease (for example for Part 1 scenario) peak hospital occupancy reflects current occupancy (on 26 March 2021).
Supplementary results
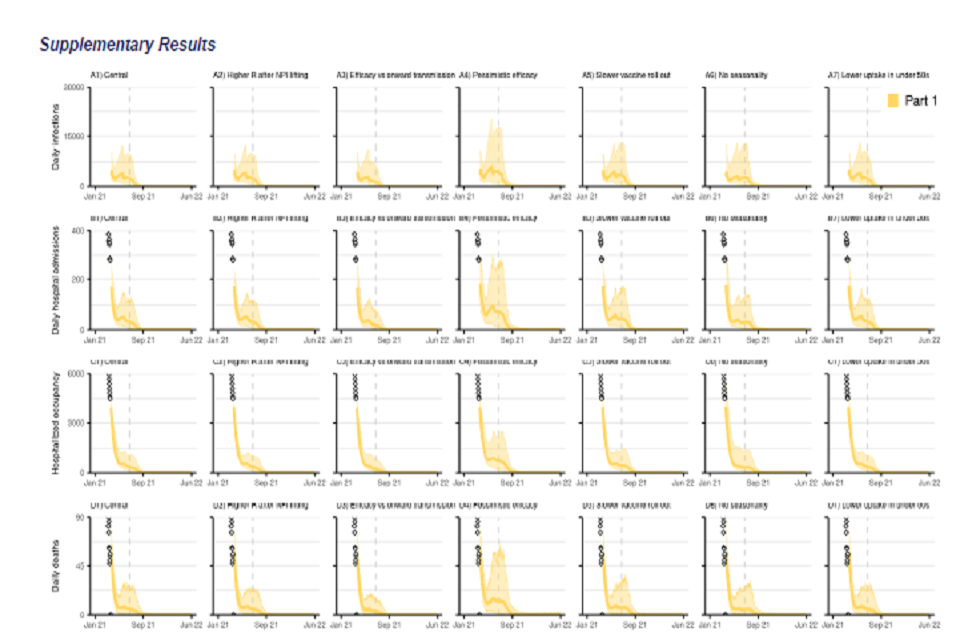
28 graphs, in a 7 by 4 grid. All x-axes track from January 2021 to June 2022. Rows show: daily infections (top); daily hospital admissions (second row); hospital bed occupancy (third row); daily deaths (bottom). Columns present various scenarios.
Figure S1: England COVID-19 daily (A1-A7) infections, (B1-B7) hospital admissions, (C1-C7) hospital bed occupancy, and (D1-D7) deaths assuming part 1 (yellow) release of NPIs over time as set out in Table 1. A1-D1 show our main analysis with a “central” transmissibility after NPI lifting where moderate baseline NPIs are retained (see Table 2), “central” vaccine efficacy (see Table 4), and central vaccine roll-out and uptake described in Tables 3 and 5. A2-D2 show sensitivity analyses assuming a higher R after NPIs are “fully” lifted with lower adherence to baseline NPIs (Rexcl_immunity = 4) as shown in Table 2. A3-D3 assume vaccine efficacy against onwards transmission. A4-D4 assuming a “pessimistic” vaccine efficacy as set out in Table 4. A5-D5 show results with a slower vaccine roll out as set out in Table 3. A6-D6 show sensitivity analyses without seasonality in transmission. A7-D7 assume lower vaccine uptake amongst <50 yrs. The points at the start of the panels B, C and D (Jan-Mar 21) show the recent reported data. The coloured lines show the median and the shaded areas the 95% credible intervals. Note the y-axis scale is different to that in Figure 2E-F and differs for each row. The vertical dashed line denotes 5 July 2021, 12 weeks after the Step 2 release date.
28 graphs, in a 7 by 4 grid. All x-axes track from January 2021 to June 2022. Rows show: daily infections (top); daily hospital admissions (second row); hospital bed occupancy (third row); daily deaths (bottom). Columns present various scenarios.
Figure S2: England COVID-19 daily (A1-A7) infections, (B1-B7) hospital admissions, (C1-C7) hospital bed occupancy, and (D1-D7) daily deaths assuming part 2 (blue) release of NPIs over time as set out in Table 1. A1-D1 show our main analysis with a “central” transmissibility after NPI lifting where moderate baseline NPIs are retained (see Table 2), “central” vaccine efficacy (see Table 4), and central vaccine roll-out and uptake described in Tables 3 and 5. A2-D2 show sensitivity analyses assuming a higher R after NPIs are “fully” lifted with lower adherence to baseline NPIs (Rexcl_immunity = 4) as shown in Table 2. A3-D3 show sensitivity analyses assuming vaccine efficacy against onwards transmission. A4-D4 show sensitivity analyses assuming a “pessimistic” vaccine efficacy as set out in Table 4. A5-D5 show results with a slower vaccine roll out as set out in Table 3. A6-D6 show sensitivity analyses without seasonality in transmission. A7-D7 assume lower vaccine uptake in <50 yrs. The points at the start of the panels B, C and D (Jan-Mar 21) show the recent reported data. The coloured lines show the median and the shaded areas the 95% credible intervals. Note the y-axis scale is different to that in Figure 2E-F and differs for each row. The vertical dashed line denotes 5 July 2021, 12 weeks after the Step 2 release date.
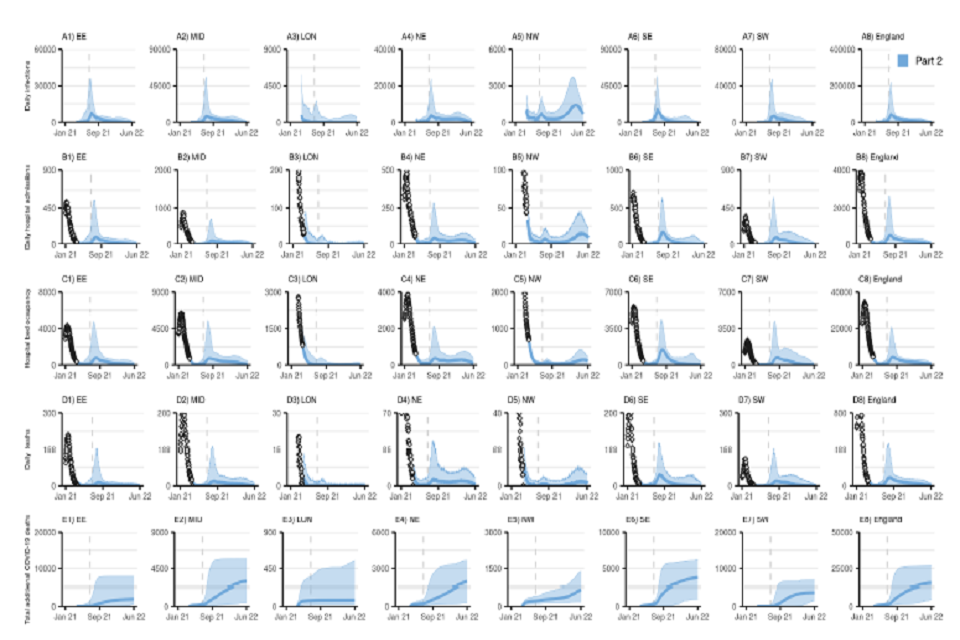
40 graphs, in an 8 by 5 grid. All x-axes track from January 2021 to June 2022. Rows from top to bottom: daily infections; daily hospital admissions; hospital bed occupancy; daily deaths and cumulative COVID-deaths. Columns show regions in England.
Figure S3: NHS England Regional and England COVID-19 (A1-A8) daily infections, (B1-B8) daily hospital admissions, (C1-C8) daily hospital bed occupancy, (D1-D8) daily deaths, and (E1-E8) cumulative deaths (counted from 26 March 2021) assuming part 2 (blue) release of NPIs over time as set out in Table 1. Plots show our main analysis at regional level with a “central” transmissibility after NPI lifting where moderate baseline NPIs are retained (see Table 2), “central” vaccine efficacy (see Table 4), and central vaccine roll-out and uptake described in Tables 3 and 5. EE=East of England, MID=Midlands, LON=London, NE=North East and Yorkshire, NW=North West, SE=South East, SW=South West. Note the y-axis limit is different in each panel.
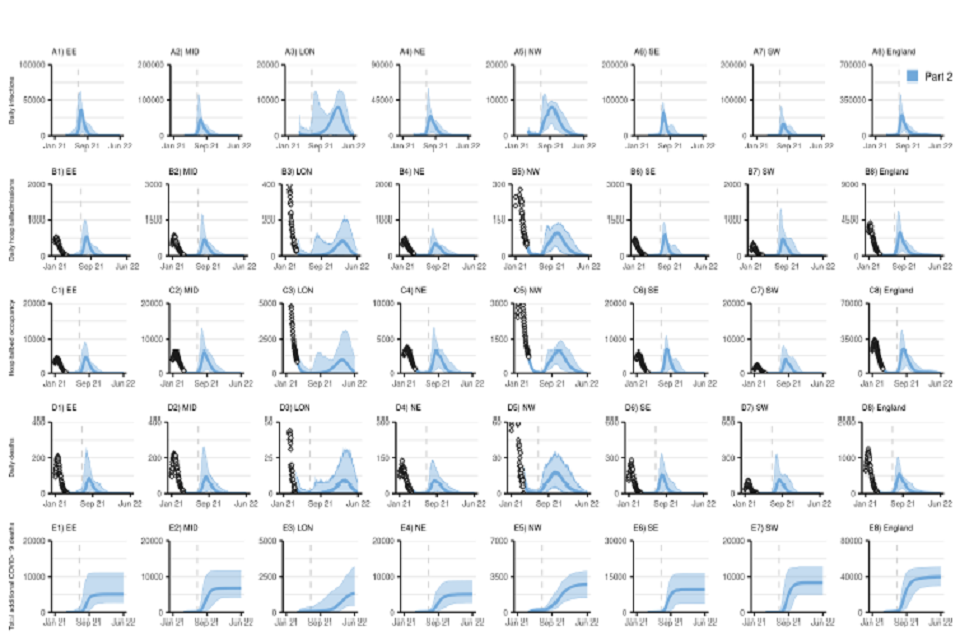
40 graphs, in an 8 by 5 grid. All x-axes track from January 2021 to June 2022. Rows from top to bottom: daily infections; daily hospital admissions; hospital bed occupancy; daily deaths and cumulative COVID-deaths. Columns show regions in England.
Figure S4 (Sensitivity): NHS England Regional and England COVID-19 daily (A1-A8) daily infections, (B1-B8) daily hospital admissions, (C1-C8) daily hospital bed occupancy, (D1-D8) daily deaths, and (E1-E8) cumulative deaths (counted from 26 March 2021) assuming part 2 (blue) release of NPIs over time as set out in Table 1. Plots show our sensitivity analysis at regional level with a return to higher R after NPI lifting (see Table 2), “central” vaccine efficacy (see Table 4), and central vaccine roll-out and uptake described in Tables 3 and 5. EE=East of England, MID=Midlands, LON=London, NE=North East and Yorkshire, NW=North West, SE=South East, SW=South West. Note the y-axis limit is different in each panel.
Estimated cumulative proportion of the population infected up to 26 March 2021
| Region | Mean | 95%CrI |
|---|---|---|
| East of England (EE) | 20.8% | 17.9-24.3% |
| Midlands (MID) | 21.9% | 19.7-23.9% |
| London (LON) | 39.0% | 30.5-45.7% |
| North East and Yorkshire (NE) | 25.5% | 21.8-29.7% |
| North West (NW) | 31.3% | 25.7-38.4% |
| South East (SE) | 19.9% | 17.0-23.9% |
| South West (SW) | 15.1% | 11.9-18.9% |
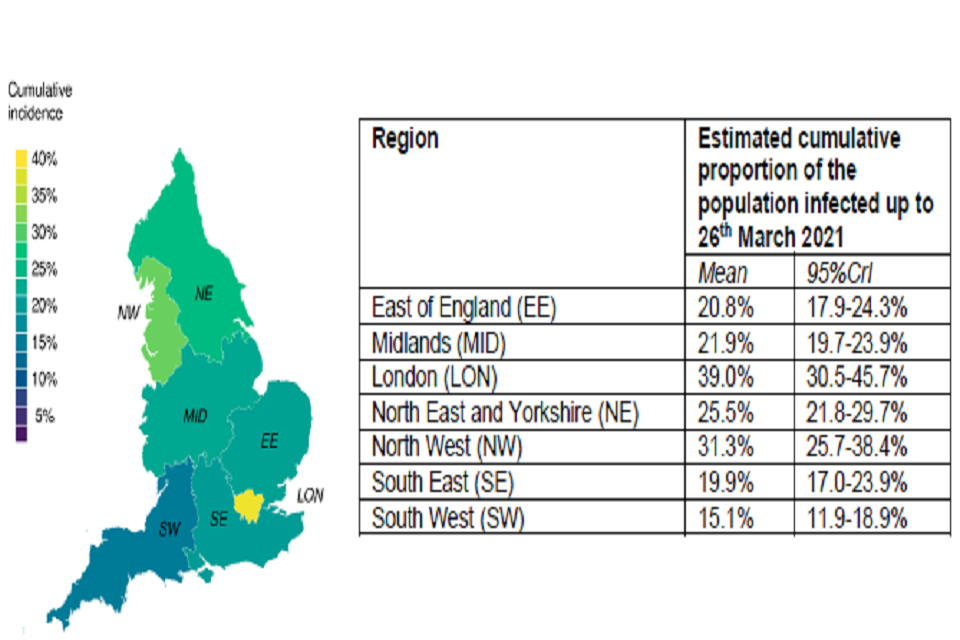
Left: Spatial colour map of UK showing cumulative infection incidence. High incidence represented by lighter colours; highest shown in yellow, roughly 40 per cent. Right: table of estimated cumulative proportion of infected population, divided by region.
Figure S5: Estimated cumulative proportion of the population infected by NHS England Region up to 26th March 2021. The map shows the mean; the table shows the mean and 95% credible intervals.
Methods
We used a stochastic compartmental model of SARS-CoV-2 transmission fitted to multiple data streams from each NHS region in England. The model is stratified into 17 five-year age groups (0-4, 5-9, …, 75-79, 80+), a group of care home residents (CHR) and a group of care home workers (CHW). The model has been described in detail elsewhere (https://www.medrxiv.org/content/10.1101/2021.01.11.21249564v1). The model was extended to include vaccination where each compartment in the model is further stratified to account for vaccination status. We used parameter values calibrated to data from 26 March 2021. The model was fitted with vaccination (both first and second doses) as reported by DHSC to SPI-M.
Definitions of the reproduction number
Throughout, we consider two definitions of the reproduction number:
- The reproduction number in the absence of immunity, Rexcl_immunity, defined as the average number of secondary infections that an infected individual would generate in a large population with no immunity. Rexcl_immunity depends on the virulence of the pathogen and the contact patterns in the population, but not the level of population immunity. We use different values of Rexcl_immunity to reflect different levels of mixing associated with different levels of restrictions, irrespective of the level of immunity in the population (see next section).
- The effective reproduction number, Reff, defined as the average number of secondary infections that an infected individual will generate with current levels of population immunity. Reff depends on the virulence of the pathogen, the contact patterns in the population and the level of immunity in the population. We use Reff to characterise the extent to which the epidemic is under control, with Reff > 1 in a growing epidemic and Reff < 1 in a declining epidemic.
Rexcl_immunity and Reff are linked through the proportion of the population who are immune (because of infection- or vaccine-induced immunity) pimmune, with Reff = Rexcl_immunity * (1-pimmune).
Transmissibility associated with re-opening steps
We modelled 5 levels of restrictions in line with the reopening steps set out in the roadmap [footnote 8]. These have been matched as closely as possible to what has been implemented in the past during this pandemic. While we cite policies in place during the Tier system implemented last autumn, we do not model any specific policy change but instead an assumed change in the corresponding level of transmission.
- Step 1a: All schools re-open;
- Step 1b: Similar to the autumn lockdown, such as measures of level 4 plus non-essential shops being closed, some outdoor mixing allowed;
- Step 2: Intermediate between tier 2 and 3 (tier 3 + outdoor hospitality);
- Step 3: Similar to tier 1, such as rule of six in place, working from home when possible, hospitality curfew;
- Step 4: Baseline NPIs with TTI, hand washing & masks and some COVID-secure measures in places such as public transport and crowded indoor spaces.
The reproduction number for step 1a is set to the latest estimated value of the reproduction number based on data up to 26 March 2021 (see Tables 1, 2, S2).
The impact of Step 1b is difficult to quantify but is likely to be small, and we assume an average increase of +0.5 in R_excl_immunity from step 1a.
We modelled step 2 as an intermediate between tier 2 and tier 3, with an average R_excl_immunity taken as the mean of the values used for levels 3 and 5 in the previous report [footnote 9].
Lastly, the final baseline transmissibility once all NPIs are lifted is assumed to be on average R_excl_immunity = 3, consistent with an increased in transmissibility due to B.1.1.7 but with a slightly lower level of transmission due to baseline NPIs. Due to the uncertainty in predicting the behaviour of individuals after the lifting of most of the restrictions, we also consider a baseline R_excl_immunity of 4 as a sensitivity analysis.
There is substantial uncertainty around the level of transmissibility associated with specific policy changes. To capture this uncertainty, we assumed R_excl_immunity under each level of restrictions was distributed around the mean values described above, using lognormal distributions with parameters shown in Table 2 and Figure 1. The reproduction numbers assumed in all five steps above are assuming schools are opened. In addition, we assumed that closing schools, for example during school holidays, will decrease R_excl_immunity by an average -0.5. This is based on the consensus value from SPI-M accounting for the increase in transmission due to the B.1.1.7 variant. As some of the “not before” dates for the next step of NPI release overlap with school holidays, we adjusted the assumed transmissibility during this time accordingly with an average -0.5 in R_excl_immunity when schools are closed.
For each NPI lifting scenario, we sampled from the relevant distributions of R_excl_immunity at each step of lifting (including school holidays) and generated sampled trajectories of R_excl_immunity over time by matching the ranked values obtained for each step. This constraint was added to ensure that R_excl_immunity could only increase over time except for the time period when schools were closed. The resulting distributions of R over time (shown in
Figure 2C) may therefore differ slightly from those shown in Table 2 and Figure 1 because of this additional constraint.
Seasonality in transmissibility
In our main analyses we assumed a slight seasonal trend in SARS-CoV-2 transmissibility throughout the year in the UK with 20% relative peak to trough variation. We computed a daily multiplier for transmissibility which was:
- Maximal at 1.1 in mid-February of each year (10% relative increase compared to the mean transmissibility)
- Minimal at 0.9 on in mid-August (day 228) of each year (10% relative decrease compared to the mean transmissibility)
We then applied this daily seasonal multiplier (Figure S4) to Rexcl_immunity in each phase (see Table 2).
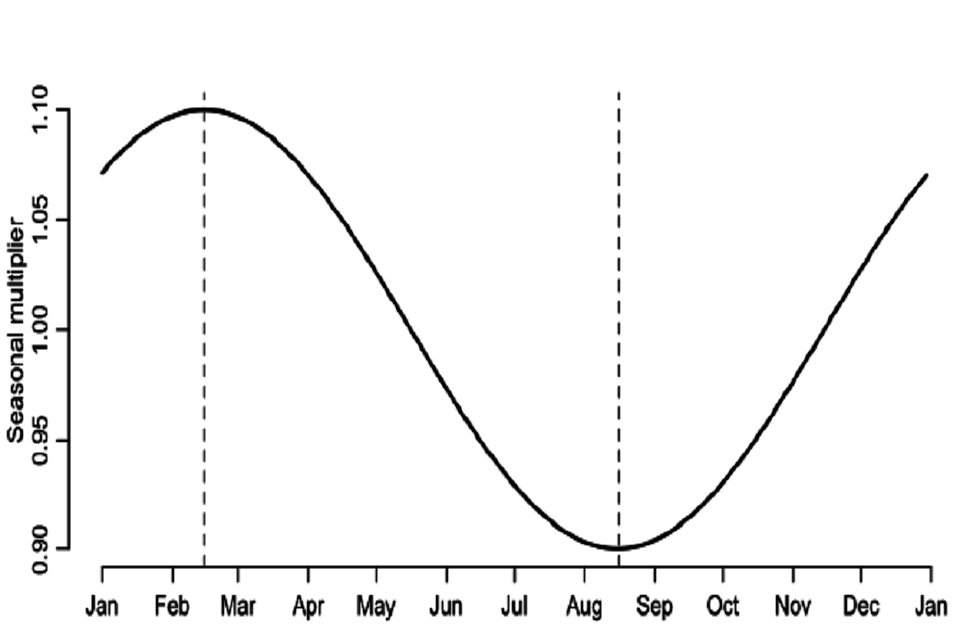
Continuous line graph. Seasonal multiplier (y-axis) plotted from January to January (x-axis). Two vertical dashed lines: between February and March; and between August and September. These dashed lines mark minimum and maximum values, respectively.
Figure S4: Seasonal daily multiplier for transmissibility (Rexcl_immunity) applied to each phase (Table S2). We also performed a sensitivity analysis where we assumed no seasonal patterns of transmission.
1st dose vaccine roll-out
We assume first doses were delivered in England between 8 December 2020 and 26 March 2021 as reported in data received from PHE and DHSC via SPI-M. We then assume a vaccine dose roll out as in Table 3. To account for second doses, we assumed that the number of available first doses on a given day is given by the total available doses on that day and subtract the number of first doses administered 77 days (11 weeks) prior. If the resulting value was negative, this was set to 0. From 26 March onwards, we assumed first doses are split between NHS regions in proportion of their population size. We assumed a constant mixture of 20% of Pfizer and 80% of AstraZeneca vaccine doses are distributed, with no difference between age groups or care home workers and residents being modelled.
We assume doses are distributed following the JCVI priority list such as to:
- Care home workers and residents
- Individuals 50 or over by decreasing 5-year age band priority as well as health care workers (we assume a fraction of the working age population to be within this group) and vulnerable individuals (also modelled as a fraction of the population)
- Individuals under 50
Children under 18 years are not vaccinated. As our model is stratified using 5-year age classes, we model the vaccination of individuals aged 18-19 by assuming the uptake in the 15-19 age group is 2/5 of the uptake in other groups under 50 years old.
2nd dose vaccine roll-out and vaccine efficacy after each dose
We assume degree-type protection from vaccination: all vaccinees have their likelihood of acquiring infection reduced by a factor of (1 – vaccine efficacy), see section on vaccine efficacy below for more detail.
For each compartment in the model, 4 successive vaccination stages (duration of each stage and efficacy of vaccine in each stage are shown on Figure S5):
- Unvaccinated
- Vaccinated with 1st dose before onset of vaccine efficacy
- Vaccinated with 1st dose with full efficacy from 1st dose – this includes individuals having received the second dose before the onset of efficacy of the second dose
- Vaccinated with 2nd dose with full efficacy from 2nd dose
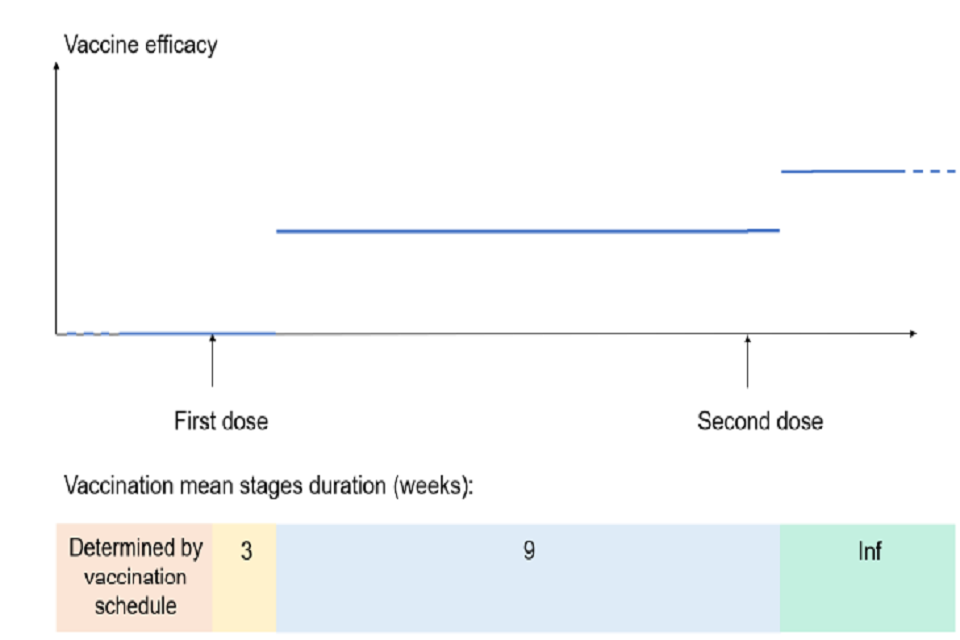
Bottom: coloured time bar showing mean duration of vaccination stages in weeks. Above is a line graph: first and second dose shown on x-axis; y-axis shows vaccine efficacy. Three horizontal lines display varying efficacy dependent on vaccination dose.
Figure S5: Vaccination stage duration and associated vaccine efficacy. The lower panel depicts mean duration of vaccination stages in weeks (numbers denote number of weeks in each stage). The top panel shows the associated vaccine efficacy and delays to protection over time.
Vaccine efficacy after first and second dose was varied across scenarios (see Table 4), but we assume:
- No efficacy in the 21 days following the first dose
- No efficacy of the second dose for the 7 days following dose 2
Phase 2 PF and AZ vaccine trial results indicated substantial increase in immunogenicity only after 2 to 3 weeks post-dose 1, and one-week post-dose 2 [footnote 10] ,[footnote 11]. We therefore assumed a 21-day (respectively 7-day) delay between receiving the first (respectively second) dose and the onset of dose-specific efficacy.
Vaccine efficacy
We assumed that the vaccine has 4 effects (Table 4):
- Efficacy against infection, einf: Reducing the risk of infection in vaccinated individuals, compared to those not vaccinated.
- Efficacy against symptoms conditional on infection, esympt inf: Reducing the risk of symptoms in vaccinated individual who become infected, compared to those non vaccinated who become infected.
- Efficacy against severe symptoms requiring hospitalisation, conditional on symptomatic infection, ehosp sympt: Reducing the risk of severe symptoms requiring hospitalisation in a vaccinated individual who becomes infected and symptomatic, compared to those non vaccinated who become infected and symptomatic.
- Efficacy against onward transmission conditional on infection etransmit inf: Reducing the risk of onward transmission from a vaccinated individual who became infected, compared to those non vaccinated who became infected (used in sensitivity analysis only)
The first two effects combined reduce the risk of symptomatic infection (“Efficacy against symptomatic infection, esympt“, non-conditional on infection) in vaccinated individuals, compared to those not vaccinated. The three effects combined reduce the risk of severe infection (“Efficacy against severe infection, ehosp“, non-conditional on symptomatic infection) in vaccinated individuals, compared to those not vaccinated.
Assumed values of efficacy for einf , and esympt and ehosp are shown in Table 4. The reduction in the risk of being symptomatically infected (esympt), as reported in clinical trials, is determined by both the reduction in the risk of being infected (einf) and the reduction in the risk of becoming symptomatic if infected (esympt | inf) as follows:
esympt = einf + (1 – einf) * esympt | inf
Similarly, the reduction in the risk of being severely infected (ehosp), as reported in some clinical trials, is determined by the reduction in the risk of being infected (einf), the reduction in the risk of becoming symptomatic if infected (esympt | inf), and the reduction in the risk of developing severe symptoms if infected and symptomatic (ehosp | sympt) as follows:
ehosp = einf + (1 – einf) * esympt | inf + (1 – einf) * (1 – esympt | inf) * ehosp | sympt
Vaccine uptake
We assume vaccine uptake was age dependant, as shown in Table 5. We assumed every individual having received their first dose would go on to also receive a second dose.
-
PHE Monitoring of the early impact and effectiveness of COVID-19 vaccination in England, 22 Feb 2021. ↩ ↩2 ↩3
-
Imperial College London: Unlocking roadmap scenarios for England, 18 February 2021 ↩