Returns
Published 23 February 2017

© Crown copyright 2017
This publication is licensed under the terms of the Open Government Licence v3.0 except where otherwise stated. To view this licence, visit nationalarchives.gov.uk/doc/open-government-licence/version/3 or write to the Information Policy Team, The National Archives, Kew, London TW9 4DU, or email: psi@nationalarchives.gov.uk.
Where we have identified any third party copyright information you will need to obtain permission from the copyright holders concerned.
This publication is available at https://www.gov.uk/government/statistics/immigration-statistics-october-to-december-2016/returns
Valid: 23 February 2017 to 24 May 2017
Data relate to 2016 and all comparisons are with 2015, unless indicated otherwise.
Back to Immigration statistics October to December 2016 content page.
This is not the latest release. View latest release.
1. Key facts
Enforced returns from the UK decreased by 11% to 12,193 in 2016 compared with 13,690 in 2015. This includes 10,706 enforced removals and 1,487 other returns from detention. For more information see the user guide.
In 2016, there were 24,202 voluntary returns (excluding returns from detention) compared to 28,189 in the previous year.
The number of passengers refused entry at port and who subsequently departed has been mainly increasing since 2012, but fell by 1% in 2016 to 17,395 from 17,636 in 2015.
In 2016, provisional data show there were 5,705 returns of foreign national offenders (FNOs), using enforcement powers or via deportation. This is the one of the highest numbers since the series began in 2009 and reflects increasing use of other forms of FNO returns, including those where an offence was committed outside the UK.
2. Returns by type
| Year | Total enforced returns (1) | of which: Total enforced removals (2) | of which: Other returns from detention (3) | Total voluntary returns (excludes returns from detention) (4) | Total refused entry at port and subsequently departed |
|---|---|---|---|---|---|
| 2014 | 14,395 | 12,627 | 1,768 | 25,784 | 15,993 |
| 2015 | 13,690 | 12,111 | 1,579 | 28,189 | 17,636 |
| 2016 | 12,193 | 10,706 | 1,487 | 24,202 | 17,395 |
| Change: latest year | -1,497 | -1,405 | -92 | - | -241 |
| Percentage change | -11% | -12% | -6% | - | -1% |
2.1 Table notes
Source: Home Office, Immigration Statistics October to December 2016, Returns table rt 01 (Returns volume 1).
(1) Total enforced returns covers enforced removals from detention, non-detained enforced removals and other returns from detention where the Home Office will have been required to facilitate or monitor the return. This new grouping has been created to reflect the likely level of enforcement activity that led to these returns.
(2) Enforced removals include enforced removals from detention and non-detained enforced removals.
(3) Other returns from detention relate to those returns occurring either from detention or up to 2 days after leaving detention AND where it had been established that a person has breached UK immigration laws and/or have no valid leave to remain in the UK.
(4) The figures for total voluntary returns (excludes returns from detention) are particularly subject to upward revision as matching checks are made on travellers after departure, so comparisons with the previous 12 months have not been included here due to the retrospective nature of data-matching exercises. These figures will be subject to upward revision in future releases.
Of the 12,193 enforced returns in 2016, 9,919 (81%) were non-asylum cases, down from 10,073 in the previous year. Of these enforced returns, 11,114 (91%) were returned home, 787 (6%) were returned to a European Union (EU) member state, and 292 (2%) to other and destination unknown. In the same period, there were 2,274 enforced returns of people who had previously sought asylum, down 37% from the previous year (3,617).
In 2016, there were 24,202 voluntary returns (excluding returns from detention) of which 1,172 were voluntary returns of people who had previously sought asylum. These figures include individuals who had been identified as having overstayed their leave and subsequently left the UK without informing the Home Office. This identification process enables the Home Office to better focus its resources on those who remain in the UK. Due to the retrospective nature of data-matching exercises, the data on voluntary returns are particularly subject to upward revision as additional checks are made on travellers after departure. Of the 24,202 voluntary returns (excluding returns from detention), 18,425 (76%) were returned home, 1,715 (7%) were returned to another EU member state and 4,062 (17%) were returned to other and unknown destination.
In 2016, there were 17,395 people refused entry at port and subsequently departed, of which 5,754 (33%) were returned home, 10,078 (58%) were returned to an EU member state, and 1,563 (9%) to other and destination unknown. The number has been lower in recent years compared to when the current data series began in 2004. There was a sharp decrease to 13,789 in the year ending December 2012 from 31,859 in the year ending June 2009. There is no single cause identified for this fall, but it will partly reflect the differing mix in arrivals. For example, one-fifth (21%) of the decrease was due to 3,720 fewer Afghanistan nationals being refused entry and subsequently removed. The overall falls are likely to be due to a combination of factors, including tighter screening of passengers prior to travel, increased use of voluntary return, and changes in visa processes and regimes; for example, South African nationals have been required to have a visa for any length or type of visit to the UK since July 2009.
3. Long-term trends in returns by type, by rolling year
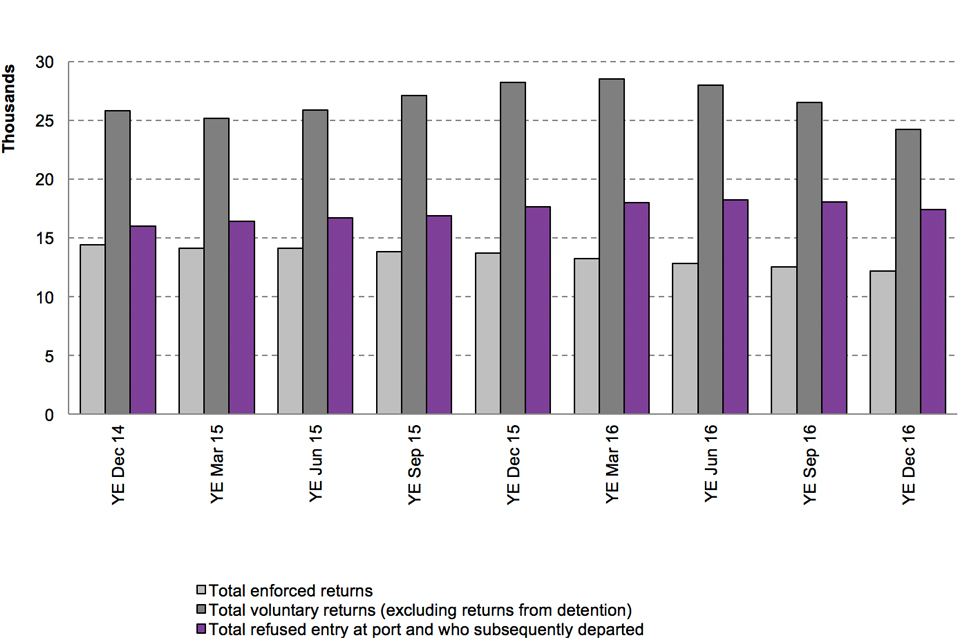
The chart shows the number of enforced returns, voluntary returns (excludes returns from detention) and refused entry at port and subsequently departed from 2014 to the latest rolling year. Data are available in Table rv01q.
3.1 Chart notes
Source: Home Office, Immigration Statistics October to December 2016, Table rv 01 q Returns table rt 01q (Returns volume 1).
The figures for total voluntary returns (excludes returns from detention) are particularly subject to upward revision as matching checks are made on travellers after departure, so comparisons with the previous 12 months should be treated with caution at this stage.
4. Returns by nationality
The highest number of enforced returns in 2016 was for Albanian nationals (1,626 or 13% of the total), of which 1,560 (96%) were returned home. The second highest number were Romanian nationals (1,589 or 13% of the total), of which 1,495 (94%) were also returned home; Romanian nationals have also shown the largest increase (503 or 46%) compared to 2015. Some of these returns may be due to specific enforcement activity related to specific groups of individuals from these countries.
The highest number of voluntary returns (excludes returns from detention) in 2016 was for Indian nationals (5,365 or 22% of the total), of which 4,793 (89%) were returned home. The second highest number were Pakistani nationals (2,801 or 12% of the total), of which 2,275 (81%) were also returned home.
The largest number of passengers refused entry at port and subsequently departed were United States (US) nationals (1,609 or 9% of the total), of which 1,007 (63%) were returned home. The second largest number was Brazilian nationals (1,210 or 7% of the total) who were also the nationality recording the largest increase compared with the previous year (333 or 38%). Of the 1,210 Brazilian nationals, 625 (52%) were returned home. US and Brazilian nationals, who are not coming to the UK for work or for 6 months or longer, do not need to apply for, and be issued with, a visa prior to arrival; therefore, the first time that they can be refused entry will be on arrival in the UK.
There were 22% more enforced returns (4,684) of EU nationals in 2016 compared with 2015 (3,848), and 21% more were refused entry at port and who subsequently departed (2,323 compared to 1,918).
5. Returns by type, nationals of EU
| Year | Total enforced returns (1) | of which: Total enforced removals (2) | of which: Other returns from detention (3) | Total voluntary returns (excludes returns from detention) (4) | Total refused entry at port and subsequently departed |
|---|---|---|---|---|---|
| 2014 | 3,158 | 3,128 | 30 | 433 | 1,409 |
| 2015 | 3,848 | 3,766 | 82 | 669 | 1,918 |
| 2016 | 4,684 | 4,533 | 151 | 648 | 2,323 |
| Change: latest year | +836 | +767 | +69 | - | +405 |
| Percentage change | +22% | +20% | +84% | - | +21% |
5.1 Table notes
Source: Home Office, Immigration Statistics October to December 2016, Returns table rt 02 (Returns volume 1).
(1) Total enforced returns covers enforced removals from detention, non-detained enforced removals and other returns from detention where the Home Office will have been required to facilitate or monitor the return. This new grouping has been created to reflect the likely level of enforcement activity that led to these returns.
(2) Enforced removals include enforced removals from detention and non-detained enforced removals.
(3) Other returns from detention relate to those returns occurring either from detention or up to two days after leaving detention AND where it had been established that a person has breached UK immigration laws and/or have no valid leave to remain in the UK.
(4) The figures for total voluntary returns (excludes returns from detention) are particularly subject to upward revision as matching checks are made on travellers after departure, so comparisons with the previous 12 months have not been included here due to the retrospective nature of data-matching exercises. These figures will be subject to upward revision in future releases.
6. Returns by ‘harm’ assessment
A harm matrix was introduced in 2007 to assess whether the Home Office was removing the most harmful people; ‘higher harm’ assessments include people who have committed serious criminal and immigration offences. More information on the harm matrix is available in the user guide.
In 2016, 23% (2,464) of the 10,706 enforced removals were assessed as ‘highest harm’, compared with 19% (2,349) in the preceding year. In the same period, only 1% (175) out of the 25,689 voluntary removals (including returns from detention) were assessed as ‘highest harm’.
7. Foreign national offenders
The Home Office also removes FNOs using enforcement powers or via deportation. In 2016, provisional data show that 5,705 FNOs were returned compared to 5,768 in 2015 (down 1%) and 5,286 in 2014 (up 8%). This is the one of the highest numbers since the series began in 2009 and reflects increasing use of other forms of FNO returns, including those where an offence was committed outside the UK.
8. Data tables:
Data referred to here can be found in the following tables:
Returns vol. 1: tables rt 01 to rt 02 q
The following tables are included in this volume:
rt 01 Returns by type and asylum/non-asylum
rt 01 q Returns by type and asylum/non-asylum
rt 02 Returns by country of nationality and type
rt 02 q Returns by country of nationality and type
Returns vol. 2: table rt 03
The following table is included in this volume:
rt 03 Returns by country of nationality, age and sex
Returns vol. 3: table rt 04
The following table is included in this volume: rt 04 Returns by country of nationality and destination
Returns vol. 4: table rt 04_q
The following table is included in this volume:
rt 04 q Returns by country of nationality and destination
Returns vol. 5: tables rt 05 to rt 07_q
The following tables are included in this volume:
rt 05 Returns by country of destination and type
rt 05 q Returns by country of destination and type
rt 06 q Returns of foreign national offenders
rt 07 Returns by harm assessment category
rt 07 q Returns by harm assessment category
9. Background information
The figures in this section relate to numbers of people, including dependants, leaving the UK either voluntarily when they no longer had a right to stay in the UK or where the Home Office has sought to return them to their own country, an EU Member State, or a third country where they are permanently admissible. While individuals refused entry at port and who subsequently departed have not necessarily entered the country, their return requires action by the UK Border Force and Home Office, such as being placed on a flight, and is therefore included above.
As a result of feedback from users, Home Office statisticians have revised the existing terminology and category groupings and a number of new categories have been devised in August 2016, backdated to Q1 2014 (see table footnotes for further information). The underlying statistics collected have not been changed as a result of these clarifications.
9.1 Migration transparency data webpage
A range of key input and impact indicators are currently published by the Home Office on the Migration transparency data webpage.