Citizenship
Published 23 February 2017

© Crown copyright 2017
This publication is licensed under the terms of the Open Government Licence v3.0 except where otherwise stated. To view this licence, visit nationalarchives.gov.uk/doc/open-government-licence/version/3 or write to the Information Policy Team, The National Archives, Kew, London TW9 4DU, or email: psi@nationalarchives.gov.uk.
Where we have identified any third party copyright information you will need to obtain permission from the copyright holders concerned.
This publication is available at https://www.gov.uk/government/statistics/immigration-statistics-october-to-december-2016/citizenship
Valid: 23 February 2017 to 24 May 2017
Data relate to the calendar year 2016 and all comparisons are with the calendar year 2015, unless indicated otherwise.
Back to Immigration statistics October to December 2016 content page.
This is not the latest release. View latest release.
1. Key facts
Applications for British citizenship fell by 20,161 (13%) to 130,646 in 2016, compared to 2015 and 44% (101,616) lower than the peak in 2013 (232,262).
There were 163,350 British citizenship decisions in 2016, 26% more than in 2015 (129,132). Grants of British citizenship increased by 31,404 (27%) to 149,457, while refusals and withdrawals rose by 2,814 (25%) to 13,893. Higher numbers were refused or withdrawn, following the introduction of enhanced checks on cases requiring higher levels of assurance in April 2015, for example those cases with previous asylum refusals and cases with adverse immigration histories.
The 31,404 increase in grants of British citizenship reflects increases in numbers of people granted citizenship in all broad categories (residence, marriage, as children).
Grants on ‘Other grounds’ almost doubled to 8,146 mostly due to increases in decisions under section 1(4) of the British Nationality Act 1981 relating to persons who had spent the first 10 years of their life in the UK, and section 4G (implemented in April 2015), which refers to persons born before 1 July 2006 to a British father, where their parents were unmarried at the time of their birth. See the user guide and the Policy and Legislative Changes Timeline for more details.
Variations in numbers of decisions can be affected by changes in resources and the mix of cases, as well as policy changes and application levels in earlier periods.
2. Grants and refusals of citizenship
| Year | Total decisions | Total grants | On basis of residence | On basis of marriage | As children | Other grounds | Refusals and withdrawals |
|---|---|---|---|---|---|---|---|
| 2012 | 201,087 | 194,209 | 107,102 | 39,122 | 42,964 | 5,021 | 6,878 |
| 2013 | 215,258 | 207,989 | 113,339 | 46,301 | 44,275 | 4,074 | 7,269 |
| 2014 | 131,827 | 125,653 | 62,511 | 26,185 | 32,298 | 4,659 | 6,174 |
| 2015 | 129,132 | 118,053 | 60,762 | 24,434 | 28,724 | 4,133 | 11,079 |
| 2016 | 163,350 | 149,457 | 77,664 | 26,786 | 36,861 | 8,146 | 13,893 |
| Change: latest year | +34,218 | +31,404 | +16,902 | +2,352 | +8,137 | +4,013 | +2,814 |
| Percentage change | +26% | +27% | +28% | +10% | +28% | +97% | +25% |
2.1 Table notes
Source: Home Office, Immigration Statistics October to December 2016, Citizenship tables cz 01 q and cz 02 q.
‘Other grounds’ includes Entitlement and Discretionary registration as an adult, Entitlement and Discretionary registration on other grounds, and registration under Section 5 of the British Nationality Act 1981. See Citizenship table cz 07 and the user guide for more detail.
3. Long-term trends in applications for citizenship and grants and refusals
The chart below illustrates longer-term trends in applications for citizenship and grants and refusals.
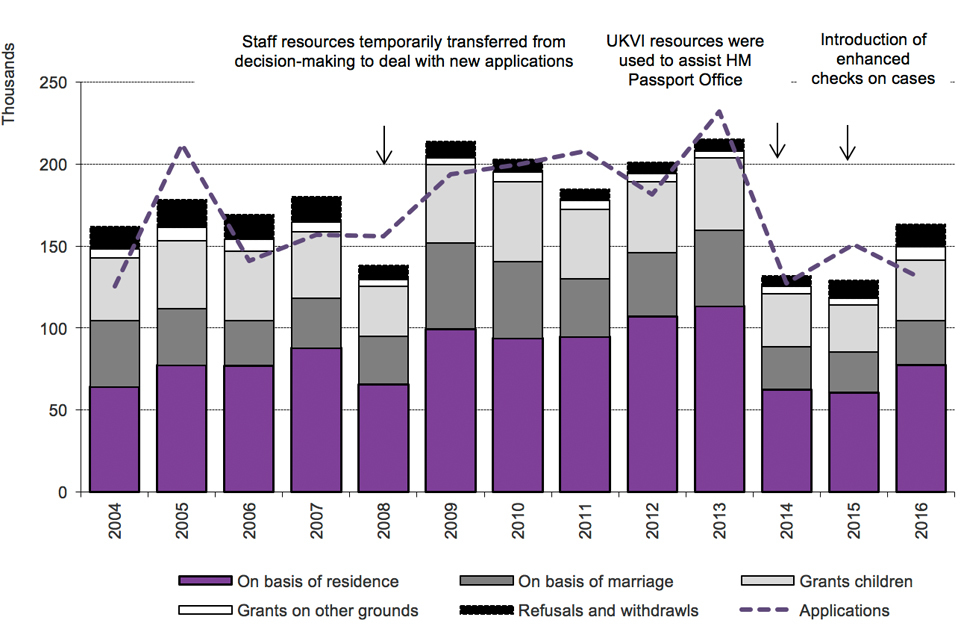
The chart shows the number of applications for grants and refusals of British citizenship between 2004 and the latest calendar year. The data are available in Tables cz 02 and cz 03.
3.1 Chart notes
Source: Home Office, Immigration Statistics October to December 2016, Citizenship tables cz 02 and cz 03. In 2008 staff resources were temporarily transferred from decision-making to deal with new applications. In 2014 UK Visas and Immigration (UKVI) resources were used to assist HM Passport Office. In 2015 enhanced checks on cases were introduced.
The increase in applications received during 2005 may have reflected people anticipating the introduction of the Life in the UK test on 1 November that year. Between 2009 and 2013 there was a general increase in applications and grants, which is likely in part to reflect the rise in non-European Economic Area (EEA) migration and increased grants of permission to stay permanently (known as ‘settlement’) in the period up to 2010. After a period of residence, those granted settlement become eligible to apply for citizenship. The peak in 2013, when there were 232,262 applications, may have been partly due to some people anticipating the rule change to the English language element of the Life in the UK test as of 28 October 2013. See the Policy and Legislative Changes Timeline for further information. The number of applications was substantially lower in 2014, 2015 and 2016, returning to levels seen in 2004.
Applications for British citizenship made in 2016 fell by 13% (20,161) to 130,646 from 2015, due to lower numbers of applications in the second half of 2016. Within this total, applications from both non-EU and EU nationals fell by 17,904 and 2,257 respectively. As a proportion of total applications for citizenship, EU nationals have grown from 3% of the total in 2008 to 11% in 2016. Increases in applications from EU nationals in recent years are likely to reflect immigration in earlier years rather than recent events.
3.2 Applications for citizenship, EU and non- EU nationals
| Total applications | Non-EU | EU nationals | EU nationals as % of total | |
|---|---|---|---|---|
| 2008 | 156,016 | 151,145 | 4,871 | 3% |
| 2009 | 193,810 | 186,742 | 7,068 | 4% |
| 2010 | 199,767 | 190,779 | 8,988 | 4% |
| 2011 | 207,797 | 198,954 | 8,843 | 4% |
| 2012 | 181,410 | 170,972 | 10,438 | 6% |
| 2013 | 232,262 | 210,586 | 21,676 | 9% |
| 2014 | 127,259 | 115,688 | 11,571 | 9% |
| 2015 | 150,807 | 133,649 | 17,158 | 11% |
| 2016 | 130,646 | 115,745 | 14,901 | 11% |
| Change: latest year | -20,161 | -17,904 | -2,257 | |
| Percentage change | -13% | -13% | -13% |
Table notes
Source: Home Office, Immigration Statistics October to December 2016, Citizenship table cz 01 q a.
Series are based on current EU membership, ie Croatians included in EU total throughout.
See Citizenship table cz 01 q a and the user guide for more details.
Applications received from nationals of most EU states increased in the latter half of 2015, particularly in the fourth quarter of 2015, possibly due to people anticipating a change in the rules. After 12 November 2015, a person applying for citizenship who is claiming to have permanent residence as an EEA national or the family member of an EEA national has been required to provide a permanent residence card or a document certifying permanent residence as evidence that they meet the requirement to be free of immigration time restrictions, and this may reduce numbers eligible to apply immediately. Applications from EU nationals rose again in the last 3 quarters of 2016, although numbers are lower than in the previous year, whereas applications from non-EU nationals fell.
3.3 Applications for citizenship, EU national groups and all other nationalities
| Geographical region | 2015 Q3 | 2015 Q4 | 2016 Q1 | 2016 Q2 | 2016 Q3 | 2016 Q4 |
|---|---|---|---|---|---|---|
| Total EU | 4,183 | 5,347 | 2,833 | 3,138 | 3,964 | 4,966 |
| EU 14 | 1,528 | 1,659 | 1,044 | 1,303 | 1,929 | 2,209 |
| EU 2 | 779 | 1,140 | 605 | 565 | 630 | 859 |
| EU 8 | 1,807 | 2,473 | 1,148 | 1,214 | 1,352 | 1,826 |
| EU Other | 69 | 75 | 36 | 56 | 53 | 72 |
| Non-EU | 30,190 | 35,651 | 38,221 | 27,436 | 25,271 | 24,817 |
| Total all regions | 34,373 | 40,998 | 41,054 | 30,574 | 29,235 | 29,783 |
Table notes
Source: Home Office, Immigration Statistics October to December 2016, Citizenship table cz 01 q a.
3.4 Grants of citizenship, by previous nationality
The chart below shows the top 5 previous nationalities granted citizenship.
(Total number of grants in 2016 was 149,457.)
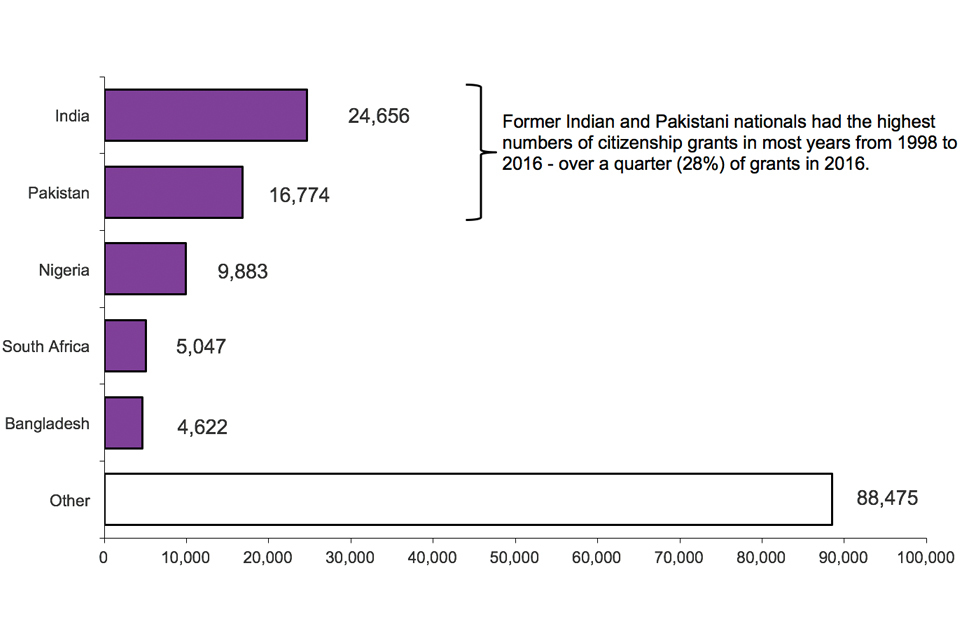
The chart shows grants of citizenship by previous nationality in 2016. The chart is based on data in Table cz 06 q.
Chart notes
Source: Home Office, Immigration Statistics October to December 2016, Citizenship table cz 06 q. Former Indian and Pakistani nationals had the highest numbers of citizenship grants in most years from 1998 to 2016, over a quarter (28%) of grants in 2016.
4. Data tables
Further data on British citizenship are available in Citizenship tables cz 01 to cz 10.
In addition to applications and detailed breakdowns of decisions, these include information on refusals, citizenship ceremonies attended and renunciations of citizenship.
5. Background information
The figures in this section relate to the number of people who are granted or refused British citizenship.
The numbers of decisions made are not always fully comparable over time. This is because, as well as reflecting changes in the levels of those settling in the UK, the figures are influenced by policy and legislative changes; for example, when changes are made to English language requirements or the Life in the UK test. In addition, the level of decisions made may be affected by the resources available in the Home Office.
5.1 Migration transparency data webpage
A range of key input and impact indicators are currently published by the Home Office on the Migration transparency data webpage.