How many people come to the UK each year?
Published 30 November 2017

© Crown copyright 2017
This publication is licensed under the terms of the Open Government Licence v3.0 except where otherwise stated. To view this licence, visit nationalarchives.gov.uk/doc/open-government-licence/version/3 or write to the Information Policy Team, The National Archives, Kew, London TW9 4DU, or email: psi@nationalarchives.gov.uk.
Where we have identified any third party copyright information you will need to obtain permission from the copyright holders concerned.
This publication is available at https://www.gov.uk/government/statistics/immigration-statistics-july-to-september-2017/how-many-people-come-to-the-uk-each-year
Back to Immigration statistics July to September 2017 content page.
This is not the latest release. View latest release.
This section relates to:
- the number of arrivals by people entering the UK (where an individual enters the country more than once, each arrival is counted); for non-European Economic Area (EEA) nationals who are subject to immigration control, more detailed information is available on their nationality and purpose of their journey
- grants of entry clearance visas to individuals outside the UK; including dependants but excluding visitor and transit visas unless stated otherwise
In line with our plan to provide users annually with a more detailed commentary, a more detailed discussion of the figures was included in the Immigration Statistics April to June 2017 release How many people come to the UK each year? Topic.
1. Key facts
There were 134.3 million passenger arrivals in the year ending September 2017, including returning UK residents; a record number and an increase of 6.2 million compared to the year ending September 2016. This increase was divided between 3.5 million (+3% to 115.8 million) more arrivals by British, other EEA and Swiss nationals and 2.7 million by non-EEA nationals (+17% to 18.5 million). These numbers represent the number of occasions when a person entered the UK, not the number of distinct individuals.
In addition, there were over 2.6 million visas granted in the year ending September 2017. Of these, just over 2 million (77%) were to visit and 8% were for study.
Long-term trends in passenger arrivals
The chart below illustrates longer-term trends in passengers entering the UK by year.
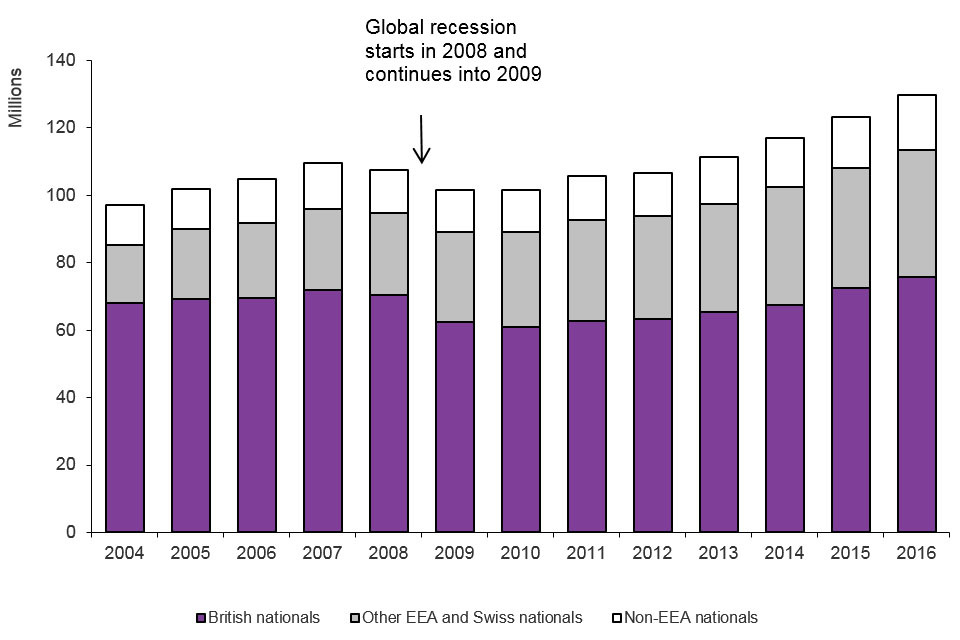
The chart shows the total number of arrivals made into the UK by broad nationality between 2004 and the latest calendar year available. Global recession starts in 2008 and continues into 2009. The data are available in Admissions table ad 01.
Chart notes
Source: Home Office, Immigration Statistics July to September 2017, Admissions table ad 01.
2. Visas
The following diagram illustrates the type and volume of visas granted in the year ending September 2017. The volume of visas granted is much lower than non-EEA arrivals as some nationalities do not need a visa (for a visit of 6 months or less) to enter the UK.

The chart shows the number and type of visas granted for the latest year available. The data are available in Visas tables vi 01 q and vi 06 q o.
Chart notes
Source: Home Office, Immigration Statistics July to September 2017, Visas table vi 01 q (Visa volume 1) and Visas table vi 06 q o (Visas volume 3).
(1) Dependants joining or accompanying.
3. Data tables
Further data on arrivals are available in Admissions tables ad 01 to ad 04.
Further data on entry clearance visas and sponsored visa applications for the work, study and family routes (described further in the Work topic, Study topic and Family topic) can be found in the following tables:
Visas tables volume 1
Visas tables volume 2
Visas tables volume 3
Sponsorship tables