Admissions
Published 26 November 2015

© Crown copyright 2015
This publication is licensed under the terms of the Open Government Licence v3.0 except where otherwise stated. To view this licence, visit nationalarchives.gov.uk/doc/open-government-licence/version/3 or write to the Information Policy Team, The National Archives, Kew, London TW9 4DU, or email: psi@nationalarchives.gov.uk.
Where we have identified any third party copyright information you will need to obtain permission from the copyright holders concerned.
This publication is available at https://www.gov.uk/government/statistics/immigration-statistics-july-to-september-2015/admissions
Valid: 26 November 2015 to 24 February 2016
Total passenger admissions data are available up to the year ending September 2015; data on the purpose of journey (e.g. visit, work, study) and for individual nationalities are available up to the end of 2014.
Back to ‘Immigration statistics July to September 2015’ content page.
This is not the latest release. View latest release.
1. Key facts
The total number of journeys increased by 6% to a record 122.3 million in the year ending September 2015 (+7.0 million). This increase was accounted for by 6.7 million more journeys by British, other EEA and Swiss nationals (up 7%) and 0.3 million more journeys by non-EEA nationals (up 2%), compared with the year ending September 2014.
For non-EEA nationals, more detailed data by category are less up to date than the totals. There were 14.6 million journeys in 2014, 5% more than in the previous 12 months, and the highest number since the data series began. There were increases in the work (+4%; +6,140) and student visitor (+6%; +16,300) categories along with falls for the study (-4%; -8,080), and family (-6%; -1,390) categories. The number of visitors increased by 5% (+0.5 million).
The number of passengers refused entry at port rose by 1% to 17,811 in the year ending September 2015 (+224).
2. Admissions by purpose of journey: non-EEA nationals
| Year | Total admissions (Millions) | Work | Study | Student visitors (1) | Family | Visitors (Millions) | Other (Millions) |
|---|---|---|---|---|---|---|---|
| 2010 | 12.5 | 163,000 | 296,000 | 240,000 | 43,400 | 7.0 | 4.7 |
| 2011 | 13.3 | 149,000 | 267,000 | 262,000 | 37,700 | 7.9 | 4.7 |
| 2012 | 12.9 | 143,000 | 211,000 | 299,000 | 31,700 | 7.7 | 4.5 |
| 2013 | 14.0 | 156,000 | 199,000 | 263,000 | 23,100 | 8.7 | 4.7 |
| 2014 | 14.6 | 163,000 | 191,000 | 279,000 | 21,700 | 9.2 | 4.8 |
| Change: latest year | +0.6 | +6,140 | -8,080 | +16,300 | -1,390 | +0.5 | +0.2 |
| Percentage change | +5% | +4% | -4% | +6% | -6% | +5% | +4% |
Table notes
Source: Home Office, Immigration Statistics July to September 2015, Admissions table ad 02 q.
(1) Student visitors are allowed to come to the UK for 6 months (or 11 months if they will be studying an English Language course) and cannot extend their stay. The student visitor category was introduced in 2007 and may include individuals previously recorded as visitors, so for consistency and comparability over time they have been excluded from study-related totals. For further discussion of study and student visitors, see the Study section. For both visitors and student visitors, non-visa nationals do not require a visa for visits of up to 6 months, so total figures for admissions are not directly comparable with total visitor or student visitor visas.
3. Long-term trends in admissions
The chart below illustrates longer-term trends in passengers entering the UK by calendar year.
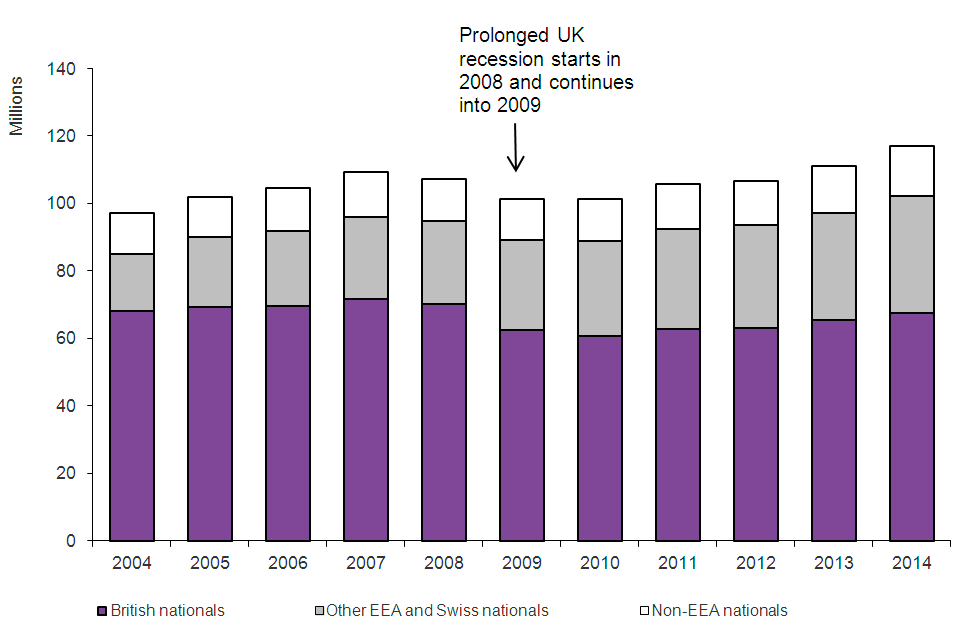
The chart shows the total number of journeys made into the UK by broad nationality between 2004 and the latest calendar year available. Prolonged UK recession starts in 2008 and continues into 2009. The data are available in Table ad 01.
Chart notes
Source: Home Office, Immigration Statistics July to September 2015, Admissions table ad 01.
4. Top 5 non-EEA nationalities admitted, 2014
(Total number of admissions: 14.6 million)
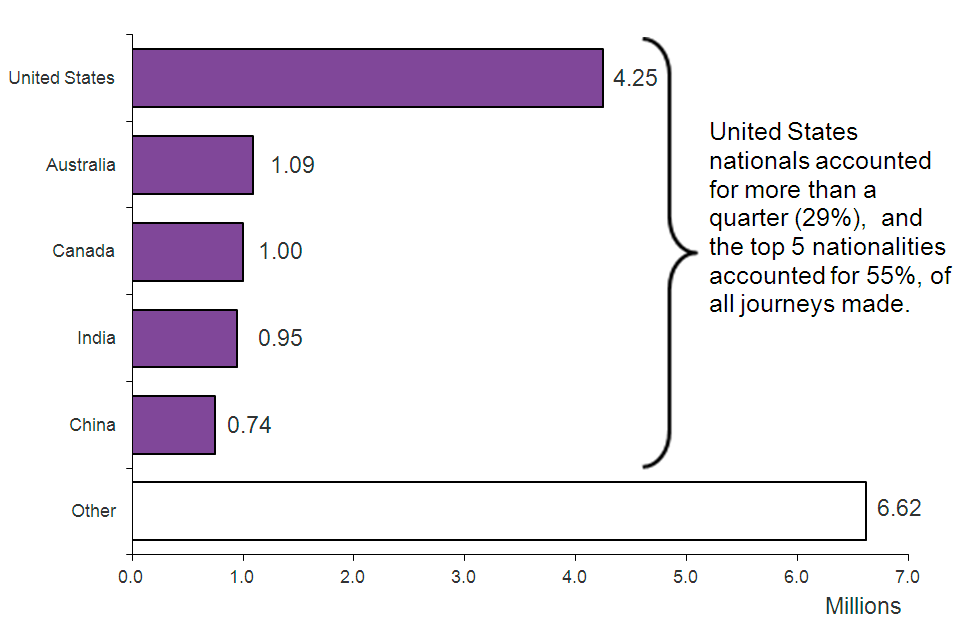
The chart shows admissions by nationality in 2014. Top 5 nationalities account for over half (55%) of all journeys made. The chart is based on data in Table ad 03.
Chart notes
Source: Home Office, Immigration Statistics July to September 2015, Admissions table ad 03.
5. Data tables
Further data on admissions and passengers refused entry at port are available in Admissions tables ad 01 to ad 04.
6. Background information
The figures in this section relate to the number of journeys made by people entering the UK. Where an individual enters the country more than once, each arrival is counted. For non-EEA nationals who are subject to immigration control, more detailed information is available on their nationality and purpose of their journey.