Asylum
Published 27 August 2015

© Crown copyright 2015
This publication is licensed under the terms of the Open Government Licence v3.0 except where otherwise stated. To view this licence, visit nationalarchives.gov.uk/doc/open-government-licence/version/3 or write to the Information Policy Team, The National Archives, Kew, London TW9 4DU, or email: psi@nationalarchives.gov.uk.
Where we have identified any third party copyright information you will need to obtain permission from the copyright holders concerned.
This publication is available at https://www.gov.uk/government/statistics/immigration-statistics-april-to-june-2015/asylum
Valid: 27 August 2015 to 25 November 2015
Back to ‘Immigration statistics April to June 2015’ content page.
This is not the latest release. View latest release.
This section covers asylum applications, initial decisions, appeals, unaccompanied asylum-seeking children (UASCs), age disputes, support, resettlement and international comparisons.
All data below relate to the year ending June 2015 and all comparisons are with the year ending June 2014, unless indicated otherwise.
1. Key facts
There were 25,771 asylum applications from main applicants in the year ending June 2015, an increase of 10% compared with the previous year (23,515). The number of applications remains low relative to the peak number of applications in 2002 (84,132).
In the year ending June 2015, the largest number of applications for asylum came from nationals of Eritrea (3,568), followed by Pakistan (2,302) and Syria (2,204). Grant rates for asylum, humanitarian protection, discretionary leave or other grants of stay vary between nationalities. For example, 87% of the initial decisions made for nationals of Syria were grants, compared with 73% for Eritrean nationals and 22% for Pakistani nationals.
Most applications for asylum are made by those already in the country (90% of applications) rather than by people at their time of arriving in the UK at a port. Applicants tend to be young and male.
In the year ending June 2015, the number of initial decisions on asylum applications more than doubled to 28,538.
Of these initial decisions, 41% (11,600) were grants either of asylum or an alternative form of protection, compared with 37% (5,120) in the previous year, and this is the highest number of grants since the year ending December 2003 (11,074). The Home Office has worked to ensure that straightforward asylum applications made before 1 April 2014 received initial decisions by 31 March 2015. This is reflected in the 107% rise in the number of initial decisions.
The HM Courts and Tribunals Service received 13,034 asylum appeals from main applicants in the year ending June 2015, a rise of 96% compared with the previous 12 months (6,637) reflecting the higher number of decisions in this period.
The overall proportion of applications either granted asylum or a form of temporary protection at initial decision or after having an appeal allowed by the courts was estimated to be 43% in 2014, having risen over the past decade from only 26% in 2004.
Estimated figures show the UK had the seventh highest number (33,000) of asylum applications within the EU in the year ending June 2015, including dependants. Germany (259,000), Hungary (93,000) and Sweden (78,000) were the top 3 receiving countries. The mix of nationalities claiming asylum, and the resultant numbers granted protection, varies considerably between EU member states. According to the latest published Eurostat report, in January to March 2015 Germany received 21,000 applications from Kosovans, 14,000 from Syrians, with the next largest numbers of applications coming from Albania (6,000) and Serbia (6,000).
In addition to those asylum seekers who apply in the UK, resettlement schemes are offered. In the year ending June 2015, a total of 809 were resettled in the UK. Of these, 166 (216 since the scheme began) were granted humanitarian protection under the Syrian Vulnerable Persons Relocation Scheme.
Asylum applications and initial decisions for main applicants
| Year | Total applications | Total initial decisions | Granted (1) | Granted as a % of initial decisions | Refused | Refused as a % of initial decisions |
|---|---|---|---|---|---|---|
| Year ending June 2011 | 18,823 | 18,935 | 5,365 | 28% | 13,570 | 72% |
| Year ending June 2012 | 19,996 | 16,644 | 5,803 | 35% | 10,841 | 65% |
| Year ending June 2013 | 23,523 | 18,712 | 7,105 | 38% | 11,607 | 62% |
| Year ending June 2014 | 23,515 | 13,795 | 5,120 | 37% | 8,675 | 63% |
| Year ending June 2015 | 25,771 | 28,538 | 11,600 | 41% | 16,938 | 59% |
| Change: latest year | +2,256 | +14,743 | +6,480 | - | +8,263 | - |
| Percentage change | +10% | +107% | +127% | - | +95% | - |
Table notes
Source: Home Office, Immigration Statistics April to June 2015, Asylum table as 01 q.
(1) Granted includes grants of asylum, humanitarian protection, discretionary leave, leave to remain under family life or private life rules, leave outside the rules and UASC leave.
Long-term trends in asylum applications for main applicants
The chart below shows the annual number of asylum applications made since 2001.
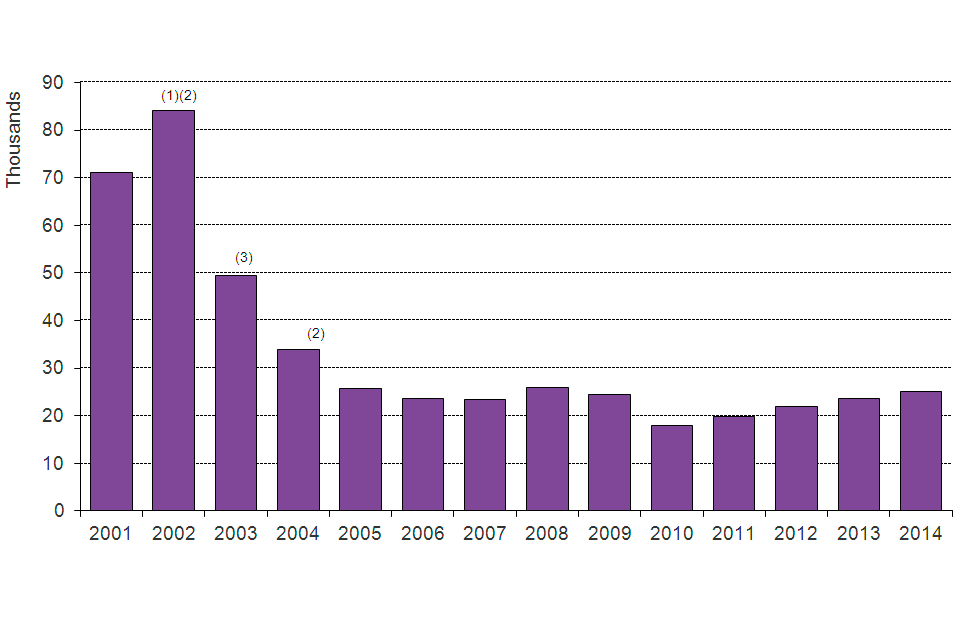
The chart shows the number of asylum applications made between 2001 and the latest calendar year. The data are available in Table as 01.
Chart notes
Source: Home Office, Immigration Statistics April to June 2015, Asylum table as 01.
(1) A process preventing certain nationalities from appealing a decision while in the country (non-suspensive appeals process) was introduced in 2002.
(2) Full overseas immigration controls operated by UK immigration officers (juxtaposed controls) were opened in France and Belgium in 2002 and 2004 respectively.
(3) Fast-track facilities for asylum applications were introduced in 2003.
Falls in asylum applications since 2002 coincide with: the introduction of a process preventing certain nationalities from appealing a decision while in the country in 2002; the opening of UK border controls (often termed ‘juxtaposed’ controls) in France and Belgium in 2002 and 2004 respectively; and the introduction of fast-track facilities for asylum applications in 2003. Asylum applications have, however, been increasing each year since 2010.
2. Nationalities applying for asylum
In the year ending June 2015, the largest number of applications for asylum came from nationals of Eritrea (3,568) followed by Pakistan (2,302) and Syria (2,204). In the same period, the number of asylum applications from Sudanese nationals almost doubled to 1,799, from 938 in the year ending June 2014.
World events have an effect on which nationals apply for asylum at any particular time. For example, the number of applicants from Syria increased sharply following the outbreak of the Syrian civil war in early 2011. In the year ending June 2015, including dependants, there were 2,475 asylum applications from Syrian nationals, compared to 186 in the year ending June 2011. In addition, increasing numbers of people have sought asylum from Eritrea mirroring the increased international concern over human rights within that country. In the year ending June 2015, including dependants, there were 3,624 asylum applications from nationals of Eritrea compared to 834 in the year ending June 2011. In contrast, applications from Zimbabwean nationals have fallen by more than two-thirds (-69%) since year ending June 2011, from 913 to 279 in the year ending June 2015.
Grant rates for asylum, humanitarian protection, discretionary leave or other grants of stay vary considerably. For example, 87% of the total decisions made for nationals of Syria were grants, compared with 73% for Eritrean nationals and 22% for Pakistani nationals.
Top 5 nationalities applying for asylum, year ending June 2015 compared with year ending June 2014
| Ranking year ending June 2015 (Year ending June 2014) | Nationality | Year ending June 2014 | Year ending June 2015 | Grant rates based on initial decisions (1) |
|---|---|---|---|---|
| 1 (2) | Eritrea | 2,113 | 3,568 | 73% |
| 2 (1) | Pakistan | 3,088 | 2,302 | 22% |
| 3 (4) | Syria | 1,688 | 2,204 | 87% |
| 4 (3) | Iran | 2,033 | 2,049 | 57% |
| 5 (8) | Sudan | 938 | 1,799 | 83% |
Table notes
Source: Home Office, Immigration Statistics April to June 2015, Asylum table as 01 q.
(1) Grant rates relate to the number of grants for asylum, humanitarian protection, discretionary leave or other grants of stay as a proportion of all initial decisions made in the year ending June 2015. Asylum grants are based on initial decisions and they do not necessarily relate to applications made in the same period.
3. Outcome of asylum applications
The most recent data will report on initial decisions made on asylum applications. However, some initial decisions will be overturned following appeal to the HM Courts and Tribunals Service (HMCTS), an executive agency of the Ministry of Justice, which considers appeals against asylum decisions made by the Home Office.
The Home Office has produced an analysis of applications for whole year cohorts of asylum seekers to establish the overall success rates following appeal. For the latest years, some cases will still be outstanding and so this cohort analysis is not able to provide a complete picture for the latest applications but for most years will provide the most complete description of the outcome for asylum seekers. The analysis of the outcomes of asylum applications are the recorded outcomes of the group (or cohort) of applicants in any one year, at a particular time. This dataset is updated, in full, annually and is currently available up to 2014.
3.1 Outcome of applications made between 2011 and 2013
As the proportion of applications awaiting the outcome of an initial decision or an appeal will inherently be higher in earlier years, as there has been longer for the case to be processed than those from more recent years, the figures presented in this section relate to applications made in the years 2011 to 2013, inclusive, to give a more complete picture of asylum outcomes in recent years.
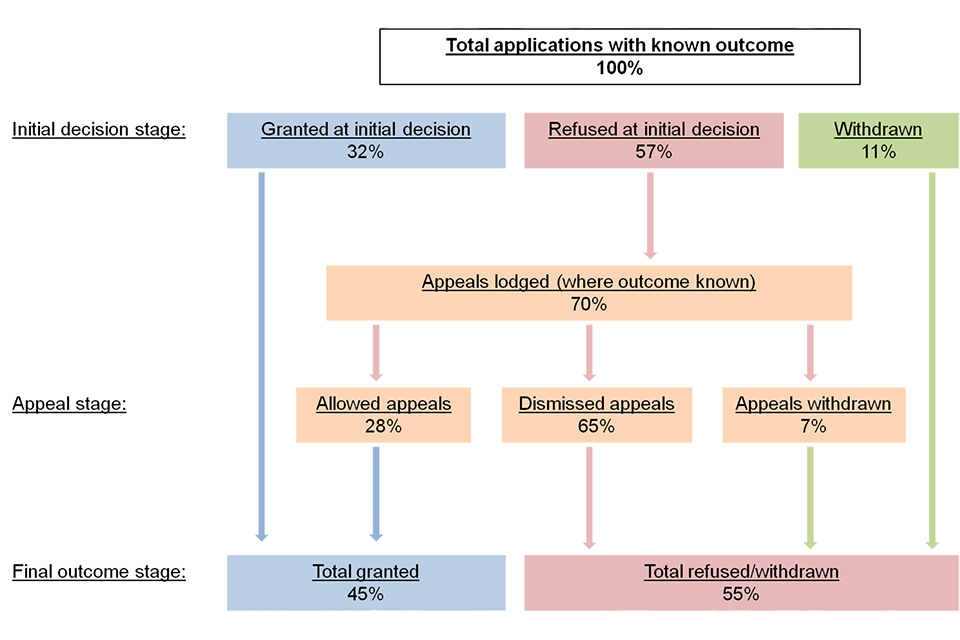
The following chart gives an illustration of outcomes in the asylum system in the UK between 2011 and 2013, where the outcome was known.
Indicative flows through the UK asylum system, where outcomes known, 2011-2013 data
No alternative text provided.
Chart notes
(1) Assumes all appeals lodged are as a result of a refused application. Latest data shows 70% of all refusals resulted in an appeal being lodged.
(2) Figures are derived by combining data from the 2011, 2012 and 2013 cohort data from Table as 06.
(3) Cases where initial decision or appeal outcomes are unknown are not included in this analysis.
3.2 Currently recorded outcomes for 2014 applications
Of the 25,033 applications made in 2014, 20,585 initial decisions had been made as at August 2015 when the statistics were compiled, including 9,230 grants and 11,355 refusals.
Of the applications made in 2014, 8,436 resulted in an appeal being lodged against the decision made on the application. Following these appeals, 42% (3,553) were dismissed, 19% (1,635) were granted asylum or another form of protection and 38% were withdrawn or the outcome was unknown at the time the statistics were compiled. The outcomes for the 2014 cohort, as with previous years, will be updated in subsequent annual reports.
Due to the large variety of routes that an asylum application can take to a final asylum outcome, the analysis of the outcomes of asylum applications in any one year requires interpretation for a small percentage of cases. The proportions and underlying figures for final outcomes of the analysis of applications for the group (or cohort) of applicants in any one year will therefore include a small amount of estimation to account for complex cases. However, the figures show that, of the 25,033 main applicants who applied for asylum in 2014, as at August 2015 when the statistics were compiled, 10,865 (43%) had been granted asylum, humanitarian protection or discretionary leave at either initial decision or after appeal; 8,634 (34%) cases had been refused; and around a fifth (22%; 5,534) were awaiting confirmation of an initial decision.
The overall proportion of applications either granted asylum or a form of temporary protection at initial decision or after having an appeal allowed, was estimated to be 26% in 2004; and the proportion has gradually increased to 43% of the cases which have been concluded in 2014, as shown in the chart below.
Outcome of asylum applications, by year of application
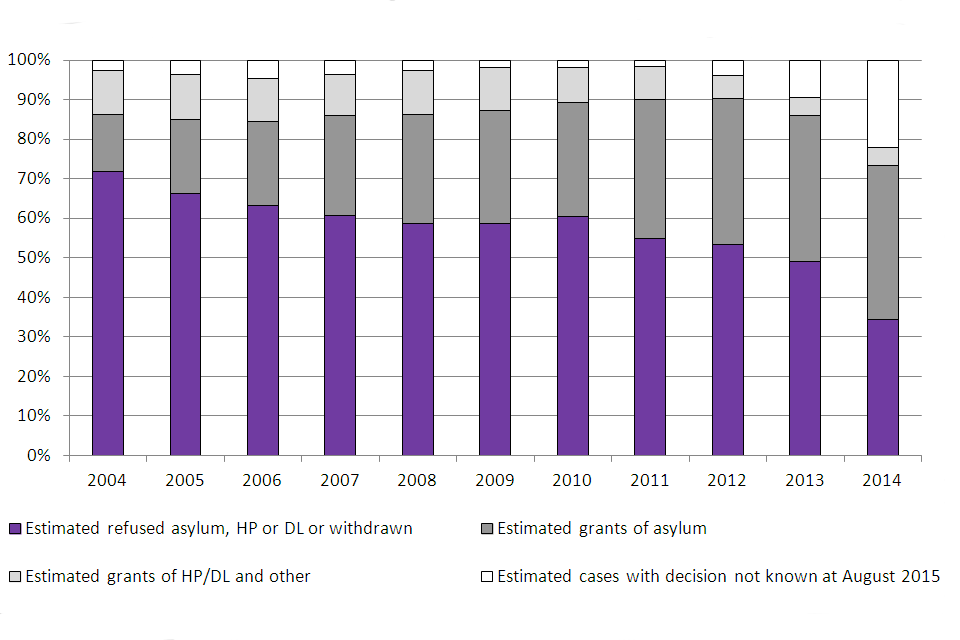
The chart shows the outcome of asylum applications made between 2004 and the latest calendar year as at August 2015. The data are available in Table as.06.
Chart notes
Source: Home Office, immigration statistics April to June 2015, Asylum table as 06.
(1) Chart shows the proportion of recorded outcomes of applications made in 2014, as at August 2015.
(2) Due to the large variety of routes that an asylum application can take to a final asylum outcome, the analysis of the outcomes of asylum applications in any one year requires interpretation for a small percentage of cases. The proportions and underlying figures for final outcomes of the analysis of applications for the group (or cohort) of applicants in any one year, are therefore estimated.
(3) The proportion of applications awaiting the outcome of an initial decision or an appeal will inherently be higher in earlier years as there has been longer for the case to be processed than those from more recent years.
In addition, the outcome analysis estimates that the grant rate varies by country of nationality. For example, in 2014, 78% of Eritrean nationals applying in 2014 were granted asylum or another form of protection, compared with 25% of Pakistani applicants.
4. Applications pending
At the end of June 2015, 21,604 of the applications received since April 2006 from main applicants were pending a decision (initial decision, appeal or further review), 2% more than at the end of June 2014 (21,104). Despite the small overall increase, there was a 5,741 rise in the number of pending further review (from 3,495 to 9,236), but this was balanced by a 6,223 fall in the number pending an initial decision for more than 6 months (from 9,829 to 3,606).
The number of decisions outstanding increased during recent periods due to a decrease in staffing levels following a restructure initiated by the UK Border Agency. Since January 2014, the Home Office has taken steps to reallocate resources to this area. This is reflected in the 107% (14,743) rise in the number of initial decisions on asylum applications for the year ending June 2015, and currently the number of decisions is greater than the number of applications received.
5. Asylum appeals
The HM Courts and Tribunals Service received 13,034 asylum appeals from main applicants in the year ending June 2015, a 96% rise compared with the year ending June 2014 (6,637) reflecting the higher number of decisions in this period.
Appeal determinations have increased from 7,115 in the year ending June 2014 to 7,688 in the year ending June 2015. This remains below the peaks in the number of appeals (16,560) and the number of determinations (16,032) in the year ending June 2010. In the year ending June 2015, the proportion of determined appeals that were dismissed was 64%, while 30% of appeals were allowed and 5% were withdrawn.
6. Unaccompanied asylum-seeking children (UASC)
There were 2,168 asylum applications from UASC in the year ending June 2015, an increase of 46% from the previous year (1,488). These applications represented 8% of all main applications for asylum in the year ending June 2015. Despite the recent increase in UASC applications, they remain below the peak of 3,976 in 2008.
There were 1,965 initial decisions for UASC in the year ending June 2015, 154% higher than in the year ending June 2014 (774). Overall, there was a fall in the proportion of decisions that were grants, from 72% of decisions in the year ending June 2014 to 67% in the year ending June 2015.
7. Age disputes
Some asylum applicants claim to be children but there can be doubt as to whether this is in fact the case. In the year ending June 2015, 404 asylum applicants had their age disputed and there were 488 recorded as having an age assessment. Of those who completed age assessments in the year ending June 2015, 58% had a date of birth showing that they were over 18 despite claiming to be a child when the age dispute was raised.
8. Dependants
Including dependants, the number of asylum applications increased from 30,250 in the year ending June 2014 to 32,508 in the year ending June 2015, an increase of 7% and an average of 1 dependant for every 4 main applicants. In the same period, 9,835 initial decisions were made relating to dependants. Of these 2,796 (28%) were granted asylum, or a form of temporary protection or other type of grant, and 7,039 (72%) were refused.
9. Support provided to asylum seekers
At the end of June 2015, 30,457 asylum seekers and their dependants were being supported under Section 95, compared with 26,720 at the end of June 2014. This is similar to the figure at the end of March 2015 (30,476) and is considerably below that for the end of 2003 (the start of the published data series), when there were 80,123 asylum seekers in receipt of Section 95.
There were 4,657 failed asylum seekers and their dependants receiving support (under Section 4) at the end of June 2015. Failed asylum seekers (main applicants only) receiving support under Section 4 peaked at the end of September 2009 (12,019).
10. Resettlement
In addition to those asylum seekers who apply in the UK, resettlement schemes are offered to those who have been referred to the Home Office by UNHCR (the UN agency for refugees). In the year ending June 2015, a total of 809 were resettled in the UK through this process and of these, 166 (216 since the scheme began) were also granted Humanitarian Protection under the Syrian Vulnerable Persons Relocation Scheme.
11.International comparisons
Figures in this section are based on data supplied by the individual countries to the Intergovernmental Consultations on Migration, Asylum and Refugees (IGC), UNHCR and Eurostat. Not all countries provide the latest data in time for each release of these Immigration Statistics. Where a figure is unavailable for a given month, we estimate it using the average of the last 3 months available, unless the time series is erratic, when we use the average of the last 12 months.
Including dependants, the estimated total number of asylum applications to the European Union in the year ending June 2015 was an estimated 755,000, an increase of 65% compared with the previous 12 months (456,000).
Top EU countries receiving asylum applications, year ending June 2015
(Total number of applications 755,000 including dependants; some estimated data)
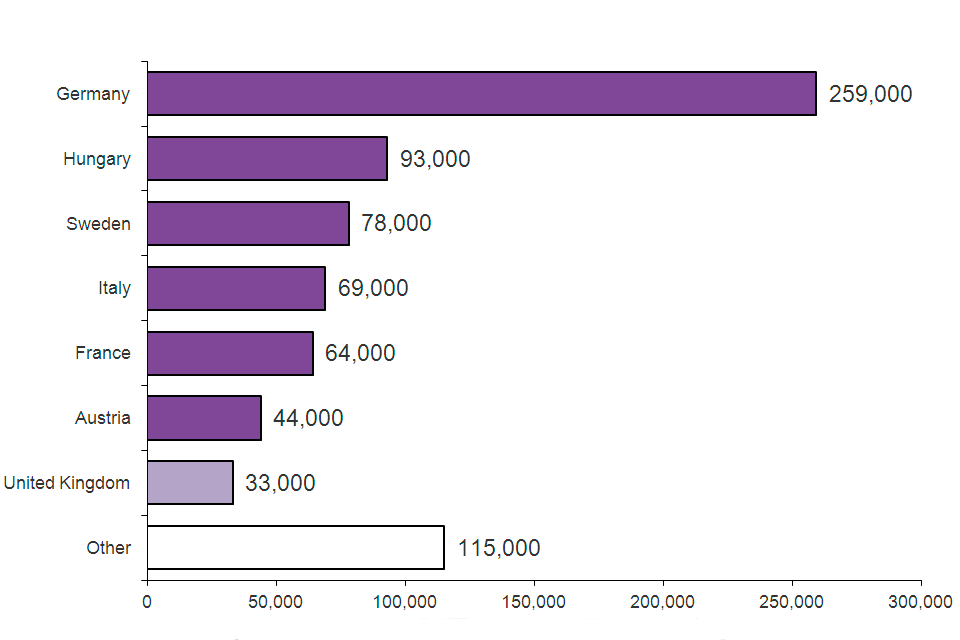
The chart shows the top 5 EU countries receiving asylum applications in the year ending June 2015. The data are available in Table as 07 q.
Chart notes
Source: Home Office, Immigration Statistics April to June 2015, Asylum table as 07 q.
(1) Figures are rounded to the nearest 1,000 and so may not add up to the total.
(2) The estimated figures in this chart are based on data supplied to IGC and UNHCR.
The UK had the seventh highest number of asylum applications within the EU in the year ending June 2015 (compared with the fifth highest in the previous 12 months). Germany had nearly 8 times as many applications as the UK. Hungary had the second highest number of applications in the year ending June 2015 after being the ninth during the previous 12 months.
Quarterly and annual statistics for asylum applications for the EU Member States are also published by Eurostat (the European statistical organisation). The latest provisional Eurostat data, relating to the first quarter of 2015, show that the top 3 nationalities of those seeking asylum in the EU as a whole were Kosovo, Syria and Afghanistan. The highest number of first-time asylum applicants in the first quarter of 2015 were registered in Germany (73,100 applicants in the first 3 months of 2015, or 40% of total applicants in the EU), Hungary (32,800; 18%) and Italy (15,300; 8%). The UK had 7,335 first time applicants; 4% of the EU total.
The different countries of origin of asylum applicants will affect the numbers who are accepted as refugees. Provisional Eurostat figures for the January to March 2015 show that Germany received 21,000 applications from Kosovans and 14,000 from Syrians. The next highest numbers of applications came from Albanians (6,000) and Serbians (6,000).
In 2014, the proportion of positive asylum decisions (for all nationalities) in Germany was 42%, compared with 39% in the UK and just 9% in Hungary (where the number includes a large number of Kosovans, very few of whom are accepted as refugees). In Germany, the nationalities with the highest numbers of grants in 2014 were Syria (26,000) and Afghanistan (5,000).
Eurostat Asylum quarterly report.
When the relative size of resident populations of the EU countries is taken into account, the UK ranked 16th in terms of asylum applicants per head of resident population in the year ending June 2015.
12. Data tables
Data referred to here can be found in the following tables:
Asylum vol. 1: tables as 01 to as 02.
The following tables are included in this volume:
as 01 Asylum applications and initial decisions for main applicants, by country of nationality
as 01 q Asylum applications and initial decisions for main applicants, by country of nationality
as 02 Asylum applications and initial decisions for main applicants and dependants, by country of nationality
Asylum vol. 2: tables as 02 q to as 06.
The following tables are included in this volume:
as 02 q Asylum applications and initial decisions for main applicants and dependants, by country of nationality
as 03 Asylum applications from main applicants, by age, sex and country of nationality
as 04 Asylum applications from main applicants and dependants, by age, sex and country of nationality
as 05 Asylum initial decisions from main applicants, by sex and country of nationality
as 06 Outcome analysis of asylum applications, as at August 2015
Asylum vol. 3: tables as 07 to as 13 q.
The following tables are included in this volume:
as 07 Asylum applications received in Europe and elsewhere for main applicants and dependants
as 07 q Asylum applications received in Europe and elsewhere for main applicants and dependants
as 08 Asylum applications received from Unaccompanied Asylum Seeking Children, excluding dependants, by sex and age at time of application
as 08 q Asylum applications received from Unaccompanied Asylum Seeking Children, excluding dependants, by sex and age at time of application
as 09 Initial decisions on asylum applications from Unaccompanied Asylum Seeking Children, excluding dependants, by sex and age at initial decision
as 09 q Initial decisions on asylum applications from Unaccompanied Asylum Seeking Children, excluding dependants, by sex and age at initial decision
as 10 Age disputes raised and resolved for asylum applicants, by country of nationality
as 10 q Age disputes raised and resolved for asylum applicants, by country of nationality
as 11 Asylum main applicants accepted onto the fast-track process, by country of nationality
as 12 Outcomes of asylum main applicants accepted onto the fast-track process
as 13 q Main applicants refused asylum and eligible for the non-suspensive appeals process, by country of nationality
Asylum vol. 4: tables as 14 to as 19 q.
The following tables are included in this volume:
as 14 Asylum appeal applications and determinations, by country of nationality and sex
as 14 q Asylum appeal applications and determinations, by country of nationality
as 15 Applications for asylum support, by support type and nationality
as 16 q Asylum seekers in receipt of Section 95 support, by local authority, as at end of quarter
as 17 q Asylum seekers in receipt of Section 95 support, by country of nationality and UK region, as at end of quarter
as 18 q Asylum seekers in receipt of Section 4 or Section 98 support, and decisions to grant Section 4 support
as 19 q Refugees (and others) resettled, including dependants