Housing Benefit debt recoveries: background information and methodology note
Updated 3 September 2025
Applies to England, Scotland and Wales

© Crown copyright 2025
This publication is licensed under the terms of the Open Government Licence v3.0 except where otherwise stated. To view this licence, visit nationalarchives.gov.uk/doc/open-government-licence/version/3 or write to the Information Policy Team, The National Archives, Kew, London TW9 4DU, or email: psi@nationalarchives.gov.uk.
Where we have identified any third party copyright information you will need to obtain permission from the copyright holders concerned.
This publication is available at https://www.gov.uk/government/publications/housing-benefit-recoveries-and-fraud-data-background-information-note/housing-benefit-debt-recoveries-data-background-information-note
1. Context of the Statistics
What is Housing Benefit?
Housing Benefit (HB) is an income-related benefit which is provided to households to help them meet housing costs for rented accommodation.
The claimant may get help with all or part of their rent. There is no set amount of HB for claimants as entitlement is dependent on whether they are renting privately or from a Local Authority (LA) or council.
HB is administered by LAs on behalf of DWP. Claimants receive support in one of two ways:
-
Rent Rebate – HB for council tenants, paid in the form of a reduction in their rent
-
Rent Allowance – HB for housing association tenants or private renters in the form of a payment to the claimant or their landlord
The roll-out of Universal Credit (UC) was completed in December 2018. Since then, the majority of new applications for working-age claimants have been processed through the housing element of UC across GB. The volume of people claiming HB has been steadily decreasing and has continued to fall with the existing move to UC policy.
Eligibility requirements for claiming Housing Benefit
The eligibility requirements for making a new HB claim are:
-
they are single and have reached State Pension (SP) age
-
they are living with a partner and both have reached SP age
-
they are living with a partner and one has reached SP age and started claiming Pension Credit before 15 May 2019. The partnership must have also existed prior to 15 May 2019
-
they are in supported, sheltered or temporary housing
Read more information about HB eligibility.
What causes HB overpayment?
HB overpayments can be caused accidentally – “claimant error”– by providing incorrect information on a HB claim, or on purpose – “claimant fraud. Claimants may additionally fail to inform their LA of a change in circumstances, which can also result in inaccurate payment of HB.
DWP publishes estimates of Fraud and Error in the Benefit System. This publication provides fuller definitions of “fraud”, “claimant error” and “official error”, and estimates the amount of HB overpaid for each of these reasons.
How do LAs identify overpaid HB?
LAs are encouraged and supported by DWP to identify and recover overpaid HB. There are multiple methods used, for example, using a “real-time information” system to verify HB claims against claimants’ actual income, as reported by HMRC. Other initiatives include undertaking full case reviews of cases that are deemed as ‘high risk’ of undeclaring change of circumstances. In cases where LAs suspect that overpayment is the result of fraud, a criminal investigation may be carried out.
How do LAs recover overpayment?
LAs may be able to recover HB overpaid to a claimant by deducting an amount from their monthly payments, if they are still a claimant at the time the overpayment is identified. There are, however, limits to the amount by which payments may be reduced and resultantly it may take a long time for an LA to fully recover an overpayment.
In cases where the HB claim has stopped, LAs may be able to recover HB overpaid to a claimant either by invoicing them or, if they are in receipt of other benefits, by applying to DWP for a deduction from these benefits.
Some LAs may sell some of their HB debt to a debt collection agency and, in cases of suspected fraud, claimants may be taken to court to recover overpayment.
Why and when might an LA “write-off” overpayment?
When an LA believes that it has exhausted opportunities to recover overpaid HB, for example if the claimant is untraceable, has been declared bankrupt, or has died, it may decide to “write-off” the claimant’s debt. Some LAs write-off overpayment at the point that they identify that they are unable to recover it whereas others process write-offs in batches.
Calculating debt recovered and written off as a proportion of available debt
From the September 2025 release, the statistical publication now includes a new graph, based on existing data, to show the proportion of available debt that has been recovered or written-off.
The ‘available debt’ figure represents the total amount of debt that can be recovered or written-off during a financial year. It is calculated by adding the outstanding debt at the start of Q1 to the total amount of newly identified debt across all four quarters of the financial year. For example, if the outstanding debt at the beginning of Q1 is £1.5 billion and an additional £450 million is identified between Q1 and Q4, the total available debt for that year would be £1.95 billion.
To determine the proportion of available debt that has been recovered or written-off, the total amount of debt recovered or written off during the financial year is divided by the available debt figure, then multiplied by 100 to express it as a percentage.
2. Purpose and Relevance
The Housing Benefit Debt recovery (HBDR) statistics are released bi-annually in March and September. The March release contains data for the first 2 quarters of the financial year (FY) and the September release contains data for the full financial year.
These statistics provide users with data on the total amount of HB overpayments identified, recovered and written off by each LA, per financial quarter. These statistics can also be used to compare the activity of LAs, and as a benchmark of how effective an LA is at recovering HB overpayments.
3. Data Source
The HBDR data replaced the Housing Benefit Recoveries and Fraud (HBRF) data from Quarter 1 of FYE 2017. At this point, DWP stopped collecting data on the number of fraud investigations. Historic data on LAs’ fraud investigations is available on the GOV.UK website.
Each LA is scheduled to submit HBDR data on a quarterly basis via email, using an agreed template. These returns are based on data taken from their HB systems and LAs are asked to complete some initial checks, such as ensuring there are no minus figures and explaining unusual trends.
Data fields and definitions
There are 4 fields on the HBDR return, as shown in the following table.
| Field | Question |
|---|---|
| 1 | Total value of HB overpayments outstanding at the start of the quarter |
| 2 | Total value of HB overpayments identified during the quarter |
| 3 | Total value of HB overpayments recovered during the quarter |
| 4 | Total value of HB overpayments written off during the quarter |
LAs are asked to provide a breakdown for each of these fields by “rent rebate” and “rent allowance”. Where LAs are unable to provide a breakdown, only the total figure is provided and this is what will be shown on the published statistics.
It is important to note that LAs report the total value of overpayments identified, recovered and written off during the reporting quarter, regardless of when the original overpayment actually occurred.
In some circumstances, a review of a HB claim may identify that, although the claimant has been paid more than they were entitled to, they remain eligible for a lesser award (“underlying entitlement”). In this situation, LAs report the overpayment net of “underlying entitlement” and “underlying entitlement” is not recorded as either a “recovered” or “written off” overpayment.
Some LAs sell a portion of their debt to a debt collection agency. In this situation, the sale price is recorded as “recovered” overpayment. The difference between the amount of debt sold to the debt collection agency and the sale price achieved is recorded as written off overpayment.
Data reference area
Data are collected at an LA level and aggregated to a regional and national level. The HBDR data relate to the LAs and regions where the HB claims that have been overpaid are administered. On occasion, claimants receiving these benefits may reside in a different local authority area to that which administered the HB overpayment.
Data collection
HBDR data are collected on a quarterly basis, according to the following pre-agreed timetable.
| Quarter | Reference period |
|---|---|
| Q1 | 1 April to 30 June |
| Q2 | 1 July to 30 September |
| Q3 | 1 October to 31 December |
| Q4 | 1 January to 31 March |
LAs have a period of approximately 4 weeks from the end of the reference period to return their data to DWP. The data returned to DWP, however, refers only to the end of the reference period, not until the date on which the data are returned to DWP.
Confidentiality and Security
Before statistical release, only a small number of authorised internal colleagues can access the statistics, in line with Code of Practice for Statistics and these cannot be shared wider.
4. Quality Management
Quality assurance during development
Upon receipt of data by DWP, checks are carried out on the accuracy of the returned data. For example, one check ensures that the sum of the amount recovered and written off is not greater than the sum of the total amount of debt outstanding at the start of the quarter plus any newly identified debt during the quarter.
Checks are completed to identify any unusually large difference between figures for the current quarter and previous quarters. These checks focus on field 1 (the total amount of overpayment outstanding at the start of the quarter). This is a larger and more “stable” measure than the other fields, which see larger quarter-to-quarter variation. Any large differences are queried with the LA.
The total amount of outstanding overpayment at the start of a particular quarter is also compared with the total outstanding overpayment at the end of the previous one. The total outstanding overpayment at the start of Q2, for instance, should, in theory, be the same as the following.
Total outstanding overpayment at the start of Q1 + overpayment identified in Q1 – overpayment recovered in Q1 – overpayment written-off in Q1.
Although these figures are not always exactly the same – for reasons explained in section 6 – any differences should be small.
Routine quality assurance checks
Further additional QA processes are in place that are consistent across all DWP statistical production processes. These include:
-
ensuring updates to code have been done correctly
-
ensuring all figures are correctly cited in each of the statistical documents
-
ensuring commentary is impartial and accurate
All issues are recorded on a quality log and rated according to their impact. Any issues that are detrimental to the quality of the statistics are made aware to users in the statistical bulletin.
Exclusions
Quality assurance checks are carried out on the data and the results are fed back to LAs, who are invited to review the data that they previously submitted and make any necessary changes.
DWP retain the right to remove any figures that are questionable and where investigation/resolution of these figures would become a proportionate burden. This is assessed on a case-by-case basis.
Exclusions are made where data is not fit for purpose and DWP reserves the right to withhold any figures that are not fit for purpose in line with the Code of Practice for Statistics. Individual explanations for the exclusion of data in each publication are not routinely published.
When DWP analysts have agreed exclusions with DWP colleagues working in Local Authority Partnership and Engagement division, a final caseload dataset is created.
Overview of Statistical Release Strategy
The GOV.UK release calendar is updated at the earliest opportunity to inform users of any change to the date of the statistical release and will include a reason for the change.
Timeliness
Figures for Q1 and Q2 of the financial year are published on the first Wednesday in March. Figures for the whole of the financial year are published on the first Wednesday in September. This is an approximate five-month-lag from the end of the reference period to the date at which the figures are published.
LAs are given approximately one month from the end of the reference date to return their data to DWP. This is followed by a period of approximately two months, during which quality assurance checks are carried out on the data and any necessary revisions are agreed with LAs. Once the data has been quality assured, there is a final period of approximately 6 to 8 weeks, during which the figures are aggregated to regional and national level, analysed, undergo further quality assurance, and the data is disseminated.
Data revision
The September release may contain revisions for Q1 and Q2, differing from what was published in the March release. Where LAs notify us of changes to their first two quarters’ data – or provide us with a late Q1 or Q2 return – these will be incorporated into figures published in September.
Although extensive quality assurance is conducted on both the raw data and statistical outputs, errors can occur on rare occasions. In these cases, we thoroughly investigate how they occurred and strengthen our processes where necessary. In line with statistical protocols, any unplanned situation which requires a revision or change to the published official statistics will be published transparently, detailing any implications for users.
5. Rounding policy
In the statistical summary, percentages are calculated using unrounded numbers and are rounded to the nearest whole percentage point. In some cases, figures may not add up to 100% due to rounding.
In the supplementary tables, raw data provided by LAs have been collated to generate regional and national totals, prior to rounding to the nearest £1,000. As a result, the sum of the rounded LA figures may differ very slightly to the regional and national totals. In previous publications, LA figures were first rounded before being added to generate regional and national totals, this methodology was subsequently changed to be in line with other DWP statistical releases. The impact of this change on regional and national totals is negligible.
Similarly, the sum of the amount of overpaid “Rent Rebate” and “Rent Allowance” in an LA may be different to the total amount of overpaid HB in that LA due to rounding methodology.
6. Status of the statistics
These statistics are accredited official statistics and were independently reviewed by the Office for Statistics Regulation in June 2012. They comply with the standards of trustworthiness, quality, and value in the Code of Practice for Statistics and should be labelled ‘accredited official statistics’.
Accredited official statistics are called National Statistics in the Statistics and Registration Service Act 2007.
Our statistical practice is regulated by the Office for Statistics Regulation (OSR). OSR sets the standards of trustworthiness, quality and value in the Code of Practice for Statistics that all producers of official statistics should adhere to.
You are welcome to contact us directly with any comments about how we meet these standards. Alternatively, you can contact OSR by emailing regulation@statistics.gov.uk or via the OSR website.
To ensure the accuracy and completeness of data returns, and in line with UK Statistics Authority guidelines, we work closely with the department’s Local Authority Partnership and Engagement Division (LAPED). As part of this work, in July 2021, we asked LAs to complete a survey. The aim of the survey was to help us to: understand how LAs complete the HBDR return; explain observed trends in the data; address data quality issues; and solicit feedback from LAs on the statistics.
Some of the main findings of this survey have been incorporated into the next section.
7. Quality
Assessment of user needs and perceptions
Regular feedback for the content of this release is invited from both LAPED and LAs. Previous feedback has been used to improve the commentary and content of the statistics and add further details to this document in support of the statistics.
All users of these HBDR statistics continue to be invited to provide feedback, using the contact details provided at the end of this document.
Timeliness and punctuality
There are approximately 5 months between the end of the period that the HBDR data refer to and the data being published. This time allows for LAs to return the data; DWP and LAs to quality assure the data; DWP to aggregate the final analytical dataset, analyse trends and conduct the final quality assurance prior to publication.
Accuracy and reliability
In addition to the quality assurance checks that DWP carry out once LAs have returned their HBDR data, LAs and software providers carry out a range of checks on their data prior to sending their returns to DWP.
Coherence and comparability
HB is a complicated benefit to administer and there have been several changes to the benefit system – such as the voluntary and managed migration from HB to Universal Credit (UC) – which have had an impact on the amount of HB overpaid and recovered.
Where approaches are used in one DWP publication, these are also used across other publications, where appropriate. For example, the handling of missing data, rounding policy and perturbation of data. In some instances, it is deemed in the best interests of stakeholders and DWP statistical producers to take a different approach to other publications – this will always be outlined and explained in the publication if this approach has been taken.
Data completeness
Some LAs do not send data returns every quarter or cannot supply data for all fields. This produces missing data in the returns.
In the first year of the HBDR collection (FYE 2009) LAs that returned data accounted for less than 75% of all HB claimants. In view of the scale of missing returns in FYE 2009, data for FYE 2009 have been excluded from the charts and commentary in the statistical summary.
After the first year, response rates improved. In FYE 2010, responses were received covering approximately 96.5% of all HB claimants and from FYE 2014, over 99% of HB claimants were covered by the returns.
Up to Q2 of FYE 2017, when an LA did not send a return, its figures were estimated. These estimates were not published but were added to figures for LAs that had returned data, to produce estimates of HB overpayments in GB as a whole.
Different methods for estimating missing LA data were investigated. This analysis arrived at two conclusions. Firstly that, when it comes to HB overpayments, there is a large amount of variation between LAs, even between LAs of a similar size. However, it concluded that variation between quarters for the same LA was also large.
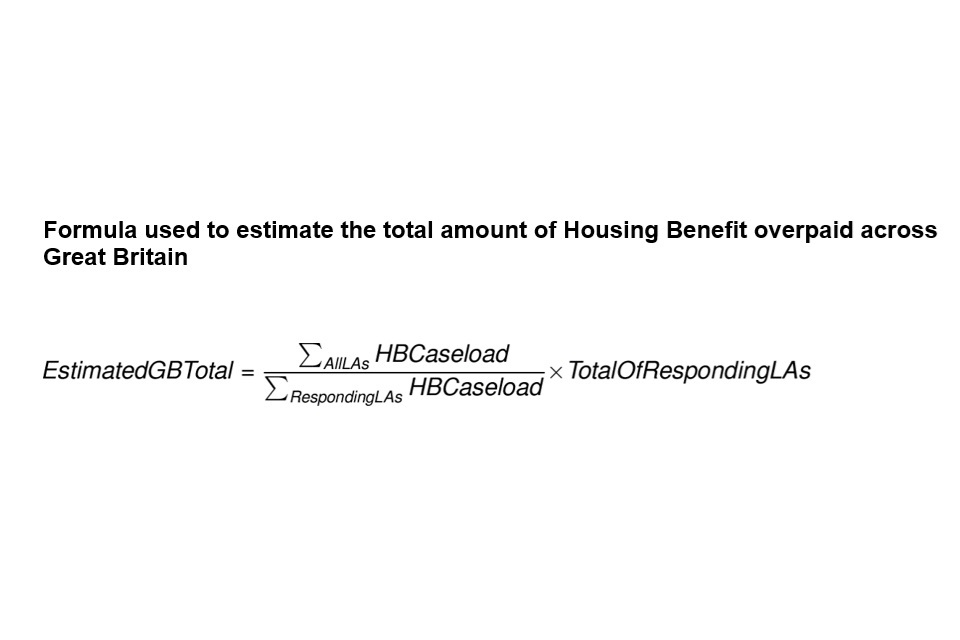
A decision was made to estimate overpaid HB in GB as a whole by uprating the total amount of overpaid HB reported by LAs that responded to the HBDR collection using HB caseload data.
The following formula was used: Estimated Overpaid HB GB-wide = (Total HB caseload in GB ÷ HB caseload in reporting local authorities) × Total overpaid HB reported by LAs that submitted a return
Supplementary tables 1_5 to 1_8 show how the total amount of outstanding HB, and the amount of overpaid HB identified, recovered and written-off by LAs, have changed since FYE 2009. There are two columns of figures. The first column shows the sum of the data returned by LAs. The second shows “imputed” GB totals, based on estimates made for LAs whose data were missing.
During FYE 2017, the methodology for treating missing LA data was reviewed. It was decided that, in recent years, the amount of data missing from the HBDR return had reduced to the point that estimates were unnecessary. Therefore, in the statistical summary, while “imputed” GB totals are shown for earlier years, all of the figures from Q3 of FYE 2017 onwards are based on the data actually returned by LAs.
Comparing overpayment identified and overpayment recovered during a quarter or year
It is not possible to make direct comparisons between the amount of HB overpayments that LAs identify during a particular period and the amount of overpayment that they recover during that period. Firstly, because overpayments are not necessarily identified in the same period that they occurred; and secondly, because overpayments are not necessarily recovered in the same period that they are identified. Depending on the amount overpaid, it may take a long time for an LA to fully recover an overpayment.
Migration to UC
At the start of Q3 FYE 2015, there were just over 4.9 million HB claimants in GB. By the start of Q4 FYE 2022, this number had fallen by 46% to just over 2.6 million. Since Q3 of FYE 2019, most new working-age claimants have claimed the housing element of UC rather than HB. The majority of new applications for working-age claimants have been processed through UC across GB. The volume of people claiming HB has been steadily decreasing and has continued to fall with the existing move-to-UC policy. A small number of people are still able to apply for HB, including pensioners, and working-age claimants who are in supported or temporary accommodation. Read more about who can get Housing Benefit. This fall in the number of HB claimants has been a significant factor in the fall in both the amount of HB overpayment identified by LAs, and the amount of HB overpayment that LAs have recovered (as there are fewer new overpayments available to LAs to recover).
As well as the amount of overpaid HB that is available to recover, migration to UC has also had an impact on the methods available to LAs to recover overpaid HB. With fewer claimants receiving HB, LAs have fewer opportunities to deduct an amount from ongoing HB claims. Instead, they look to recover overpaid HB by either invoicing claimants when their HB claim ends or applying to DWP for deductions from UC or other benefits.
FERIS
The Fraud and Error Reduction Incentive Scheme (FERIS) was introduced in Q3 of FYE 2015 and provided LAs with grants and incentive payments to help them identify and prevent overpaid HB. At a similar time, the real-time information (RTI) system was implemented as a joint strategy between DWP and HMRC, which allows LAs to verify HB claims against actual income. These checks led to undeclared income, and consequently led to an increase in overpaid HB being identified.
COVID-19
At the start of the COVID-19 pandemic, many LAs redeployed staff away from processing and debt recovery to other frontline activities, and restricted face-to-face meetings between staff and claimants during lockdown events. The increase in the amount of overpaid HB identified and recovered by LAs in FYE 2022 compared with FYE 2021 should be seen in the context of a fall in the amount of debt recovery activity being undertaken during the COVID lockdowns in FYE 2021.
Retrospective changes in overpayments
LAs sometimes identify an amount by which a HB claimant has been overpaid, but then revise this amount later. These revisions lead to a discrepancy between figures for one quarter and the next.
The total amount of HB overpayment at the start of a quarter should, in theory, equal the total amount of overpayment at the start of the previous quarter, plus the amount of overpayment newly identified during the previous quarter, minus the amount of overpayment recovered and written-off during the previous quarter. However, this is not always the case in all LAs.
This apparent discrepancy is due to the timing of the HBDR extracts. “Total debt outstanding at the start of the quarter” comes from a report run at the end of the quarter and changes can be made during the current quarter to the value of overpayments first identified in previous quarters and brought forward to the current one.
Overpayment identified in one quarter might retrospectively fall in a subsequent quarter. In some cases, for instance, “underlying entitlement” might be belatedly applied to an overpayment, reducing the amount that the claimant was originally thought to owe. In other cases, information might emerge that showed that, in accordance with HB regulations, an overpayment that an LA sought to recover was in fact “non-recoverable”.
Conversely, overpayment identified in one quarter might retrospectively increase in a later quarter. In some cases, a “write-off” might be reversed – this occurs when new information suggests that an overpayment that was previously written-off could, in fact, be recovered. Alternatively, an overpayment identified in one quarter could increase in a later quarter if recovery action led to court costs being added to the debt.
In over 80% of LAs, the difference between the total amount of overpayments outstanding, according to their quarter 3 returns; and the total amount of overpayments outstanding at the start of quarter 4, according to their quarter 4 returns, is less than 1%. We have therefore decided not to ask LAs to provide us with revised figures, when an overpayment identified in one quarter retrospectively changes in a later quarter, as to do so would place a disproportionate burden on LAs.
Write-off statistics
There is extremely large quarter-to-quarter variation in the amount of HB overpayment written-off by LAs. Although it is not the case in all LAs, across GB, there is a “spike” in overpayment write-off in Q4 followed by a sharp fall in Q1 the following year. On average, write-off in Q4 of a financial year is around 75% higher than in Q1.
Although some LAs write-off overpayments as soon as it becomes apparent that they won’t be unable to recover it, others write-off overpayments in batches – because, for instance, they need approval from their Cabinet to process write-offs over a certain amount.
Reasons for the “spike” in write-offs in Q4 include:
i. LAs make a “push” to “tidy up” accounts at the end of the financial year
ii. LAs have made provision for “bad debt” in their annual budget
iii. LAs see an increased number of deaths in winter months
In view of the high level of seasonality in “write-off”, the statistical summary includes a chart showing average write-off over the previous four quarters. This gives users of the statistics a clearer picture of the overall trend in “write-off”.
Accessibility and clarity
The statistical bulletin and ODS tables are released in accessible format and meet the guidelines set out within DWP’s accessibility statement.
Confidentiality
For confidentiality reasons, a small number of figures in the supplementary tables have been suppressed. In LAs where:
1. Fewer than 5 LA tenants were claiming HB at the start of the quarter.
2. The amount of overpaid HB owed by LA tenants at the start of the quarter was not zero the breakdown between overpaid “Rent Allowance” (HB paid to LA tenants) and “Rent Rebate” (HB paid to housing association and private tenants) is not shown. This is to avoid the possibility of tenants who owe overpaid HB to their LA being identified.
In these LAs, only the total amount of overpaid HB is shown in the tables. In the latest statistics, between 5 and 6 LAs fall into this category each quarter.
8. Limitations of the statistics
Known issues
Not all LAs are able to return HBDR data in all quarters. Up until Q2 of FYE 2017, estimates were made for missing LA data. Analysis of the HBDR data has found that there is a large degree of variability – both between different LAs and within the same LA in different quarters – in the amount of overpaid HB identified, recovered and written-off. Therefore, although the methodology that was used to estimate missing data was appropriate, there was a limit to how accurate these estimates could realistically be.
In view of the improved response from LAs to the HBDR collection, since FYE 2017, figures published in the statistical summary have been based on the HBDR returns actually received by LAs. Although the amount of missing data is small these figures are presented on a different basis to those prior to Q3 of FYE 2017.
As already noted, there is a large amount of quarter-to-quarter variability, especially in the amount of HB overpayment identified, recovered and written-off by LAs. This makes it difficult to quality assure the figures as the large quarter-to-quarter differences routinely observed in these figures may occasionally mask errors.
The HBDR statistics show the amount of overpaid HB in an LA, as they understood it, at a particular point in time. If the LA made retrospective changes to an earlier overpayment – by, for instance, applying “underlying entitlement” to reduce the value of an overpayment in a later quarter – this would generally not be reflected in the statistics.
9. Data Tables
The supplementary tables published with the HBDR statistics show:
-
T1_1: The total amount of outstanding HB overpayments at the start of the quarter
-
Table 1_2 to 1_4: The total amount of HB overpayments (i) identified; (ii) recovered; and (iii) written-off during the quarter
These tables show a breakdown by LA. The following conventions are used:
-
“.” – missing
-
“-“ – zero or negligible
-
“*” – included in total
Many LAs are unable to provide a breakdown between “rent reduction” and “rent allowance”. As a result, it is not possible to calculate regional and national totals for these measures.
There have recently been several local authority mergers. The statistics shown are based on the current LA configuration, with figures for the “old” LAs that merged to form the new LAs no longer shown. This is consistent with HB caseload figures published on Stat-Xplore.
Stat-Xplore is a free online tool. You can use data on Stat-Xplore to download and customise Department for Work and Pensions (DWP) statistics.
10. Other available DWP statistics
Read details of other official credited and official statistics produced by DWP.
A schedule of statistical releases over the next 12 months and a list of the most recent releases is available.
11. Feedback
These statistics are published by the Department for Work and Pensions.
If you would like to offer feedback or require further information on these statistics, please contact cbm.stats@dwp.gov.uk
For media enquiries on these statistics, please contact the DWP Press Office.
Annex A
Prior to 2016, data on fraud investigations carried out by LAs were collected and published alongside debt recovery statistics. The following fields were collected.
Fraud Investigations Fields
| Field | Question |
|---|---|
| 5 | Number of full time equivalent fraud investigators at the end of the quarter |
| 6 | Number of cases referred to the LA fraud investigation section during the quarter |
| 7a | Number of cases subject to investigation by the fraud section, that were closed during the quarter |
| 7b | Total number of cases under investigation that related to DWP administered benefits (included in 7a) that were closed during the quarter |
| 8 | Number of cautions offered and accepted during the quarter |
| 9a | Number of administrative penalties offered and accepted during the quarter |
| 9b | Number of administrative penalties offered and accepted with a DWP benefit interest (included in 9a) during the quarter |
| 10a | Number of cases accepted for prosecution during the quarter |
| 10b | Number of cases accepted for prosecution with a DWP benefit interest (included in 10a) during the quarter |
| 11a | Number of prosecutions resulting in guilty outcomes (includes guilty pleas and verdicts) during the quarter |
| 11b | Number of prosecutions resulting in guilty outcomes (includes guilty pleas and verdicts) with a DWP benefits interest (included in 11a) during the quarter |
“DWP benefits interest” includes:
- Income Support
- Jobseeker’s Allowance
- Pension Credit
- Incapacity Benefit
- Employment Support Allowance