Households below average income statistics on Stat-Xplore: user guide
Updated 15 May 2025
Introduction
The Households Below Average Income (HBAI) dataset provides information on living standards in the United Kingdom based on household income measures for a financial year.
The HBAI dataset is on an individual level and uses the net, weekly income of their household. Breakdowns allow analysis of individual, family (benefit unit) and household characteristics of the individual.
Data is taken from the Family Resources Survey (FRS), whose focus is capturing information on incomes, as well as a lot of contextual information on household and individual’s circumstances.
This dataset provides estimates for single financial years, from financial year ending (FYE) 1995 to FYE 2002 for Great Britain and FYE 2003 to FYE 2024 for the United Kingdom.
Please note:
-
In 2023/24, updated material deprivation questions were included in the FRS for children, working-age adults, and pensioners, asked to 75% of households. The remaining 25% of households were asked the old questions (2010/11 for children and working-age adults, 2009/10 for pensioners). Imputation was used to estimate missing responses for the updated questions using old questions where possible. Estimates from old and updated methodologies are not comparable. More details can be found in the Technical report: update to measures using material deprivation for households below average income FYE 2024, which accompanies the release of 2023/24 statistics.
-
Data collection during FYE 2023 and FYE 2024 was mixed mode, with most of the achieved sample responding to the FRS via a return to face-to-face interviewing. For the two-year period spanning the coronavirus (COVID-19) pandemic, interviewing was conducted via telephone only. Changes in estimates since FYE 2020 and between subsequent years should be interpreted being mindful of the differences in data collection approaches across the period and the effect this had on sample composition.
-
All estimates of material deprivation for FYE 2023 should only be directly compared with periods up to and including FYE 2020. During FYE 2021 (not included in this dataset) and FYE 2022, several of the questions asked as part of the material deprivation measure were affected by government restrictions introduced in response to the coronavirus (COVID-19) pandemic. Further details can be found in the technical report which accompanies the release of the FYE 2023 statistics.
-
Data collection during FYE 2021 and FYE 2022 was via telephone interviewing as opposed to the established face to face method used prior to the coronavirus (COVID-19) pandemic. While the achieved FYE 2022 FRS sample was larger and more representative than in FYE 2021, there remains some residual bias in the FRS sample resulting from change in mode and therefore FYE 2022 estimates and changes should be interpreted in this context. Further details can be found in the technical report which accompanies the release of the FYE 2022 statistics.
-
Data relating to FYE 2021 is not available in Stat Xplore due to data quality concerns affecting many of the HBAI estimates calculated below UK (headline) level for that year. Further details can be found in the technical report which accompanied the release of the FYE 2021 statistics. This report details the impact of the coronavirus (COVID-19) pandemic on the size and composition of the FRS sample.
While this dataset displays estimates for single financial years, please ensure that HBAI estimates for regional, country and ethnicity estimates are calculated using 3-year averages. This method helps smooth erratic series and so give more robust estimates as the FRS sample size and coverage issues mean that single year results broken down below the level of UK region are unlikely to be reliable. For alternative sub-regional sources, please see Annex 2: Other Relevant Statistics of the HBAI Quality and Methodology Information Report which is available via the HBAI homepage.
All rolling 3-year averages calculated and published for any period including FYE 2021 are based on the remaining 2 available data points only. Therefore:
-
when calculating FYE 2019 to FYE 2021 estimates, please calculate a 2-year average using FYE 2019 and FYE 2020 estimates
-
when calculating FYE 2020 to FYE 2022 estimates, please calculate a 2-year average using FYE 2020 and FYE 2022 estimates
-
when calculating FYE 2021 to FYE 2023 estimates, please calculate a 2-year average using FYE 2022 and FYE 2023 estimates
-
3-year averages can be calculated as normal using 3 data points for FYE 2024
See Section 15: Worked Example 2: Low Income by Country/Region below for guidance on how to correctly calculate estimates. Please note that particular care is needed in calculating 3-year averages for percentages.
Please email the HBAI team with comments and suggestions.
The contents of this guide are:
-
What is Stat-Xplore?
-
Benefits of Using the HBAI Stat-Xplore Dataset
-
Constraints of Using the HBAI Stat-Xplore Dataset
-
HBAI Income Definition
-
HBAI Estimates Rounding Rules and Disclosure
-
Breakdowns Available
-
Current Exclusions (available in published tables)
-
Known Issues and Changes to HBAI Data Back-Series Changes
-
Important Footnotes
-
How the Dataset Works
-
Ready-Made Tables
-
User-Defined Analysis:
a. Removing Financial Year Total
b. Financial Year as a Row
c. Creating a Time-Series
d. Selecting Specific Financial Years
e. Removing the Latest Financial Year
f. Creating, Editing and Exporting a Numbers table
g. Converting a Numbers table to Percentages Table
h. Adding a Derivation
i. Creating Income Ranges
13. Further Top Tips
14. Worked Example 1: In-Work Low Income
15. Worked Example 2: Low Income by Country/Region
Please add “Source: HBAI Stat-Xplore” to any analysis shared or published.
1. What is Stat-Xplore?
Stat-Xplore is a free tabulation tool available at gov.uk. Users can access DWP data via datasets to create their own analysis.
HBAI estimates and underlying data is also available via:
-
HBAI homepage: Main report, along with an extensive suite of tables of HBAI estimates and the HBAI Quality and Methodology Report detailing issues related to HBAI data and includes information on Other Relevant Statistics in Annex 2.
-
UK Data Service: End user licence access to the HBAI back-series individual and family (benefit unit level) datasets, resamples datasets and extensive user documentation (note that income variables are rounded to nearest whole £1 and very large households and some variables are removed unless using safe room access).
2. Benefits of Using the HBAI Stat-Xplore Dataset
-
Free and accessible to all with user guidance and virtual tour.
-
New user-defined analysis of HBAI data with a user-friendly Application Programming Interface (API) and quick export of tables/graphs to Excel/PDF.
-
Data is unrounded so users can produce more accurate analysis (final estimates must be rounded as described below).
3. Constraints of Using the HBAI Stat-Xplore Dataset
-
Confidence intervals around estimates and the Gini co-efficients cannot be produced in Stat-Xplore.
-
Analysis based on 3-year averages is not currently possible so HBAI estimates based on ethnicity, country and region variables must be calculated manually by the user - see Section 15: Worked Example 2: Low Income by Country/Region below for more support. As a result, the map feature is also not available.
-
Decile and quintile median and mean income amounts created in Stat-Xplore differs to the HBAI methodology and calculation of published estimates – see Section 8: Known Issues and Changes to HBAI Data below for more information.
-
Careful selection of row and column categories are necessary to ensure correct estimates are produced - please see Section 12: User-defined Analysis and Section 13: Further Top Tips sections below.
4. HBAI Income Definition
HBAI income is presented as net, weekly, equivalised, SPI-adjusted household income Before/After Housing Costs in latest prices or in year prices.
The following table provides specific definitions of the HBAI income measure:
Table 4: HBAI Income Definition
| Definition | Explanation | |
|---|---|---|
| Net | After deductions have been removed for: income tax payments and National Insurance contributions, domestic rates/council tax, contributions to occupational pension schemes, all maintenance payments, student loan repayments, parental contributions to students living away from home. | |
| Weekly | All income is on a weekly-basis (any lump sums are converted to a weekly amount). | |
| Equivalised | An adjustment is made to income to make it comparable across households of different size and composition. A couple with no children is the reference point. | |
| SPI-adjusted | An adjustment is made to sample cases at the top of the income distribution to correct for under-reporting of earnings and volatility in the highest incomes captured in the survey. | |
| Household | One person living alone or a group of people (not necessarily related) living at the same address who share cooking facilities and share a living room or sitting room or dining area and can consist of 1 or more families. | |
| Income | From all sources from all household members (including children’s): usual net earnings from employment, profit or loss from self-employment (losses are treated as negative income) income from director’s dividends (from FYE 2022), state support - all benefits and tax credits, including state pension, income from occupational and private pensions, investment income, maintenance payments, if a person receives them directly, income from educational grants and scholarships, the cash value of certain forms of income in kind, including free school meals. | |
| Before/After Housing Costs (BHC/AHC) | Before Housing Costs (BHC) indicates the following housing costs have not been deducted from income, however After Housing Costs (AHC) indicates the following housing costs have been deducted from income: rent (gross of housing benefit), water rates, community water charges and council water charges, mortgage interest payments, structural insurance premiums. | |
| In latest prices | Indicates variants of the Consumer Price Index (CPI) are used to adjust income for inflation to the ‘latest’ publication year prices to be able to compare how incomes are changing over time in real terms. | |
| In year prices | Income has not been adjusted for inflation so are in ‘nominal’ terms. |
Note: Negative incomes BHC are reset to zero.
Further information can be found in the HBAI Quality and Methodology Information Report which can be found on the HBAI homepage or clicking on the “i” icon for a measure or breakdown in the dataset.
5. HBAI Estimates Rounding Rules and Disclosure
Please note that estimates derived in this dataset are unrounded and based on survey data.
Once the user has produced HBAI estimates using unrounded outputs:
-
Percentages must be rounded to the nearest whole per cent.
-
Numbers must be rounded to the nearest 0.1 million (or 100,000 individuals).
-
Amounts must be rounded to the nearest £1 (weekly) and £100 (annual).
These rounding conventions have been set to reflect that HBAI estimates are based on the Family Resources Survey (FRS) and not actual records of individuals in the UK. Where tabulations result in a number of rows or columns with zero numbers or percentages when rounded, we recommend combining groups.
When comparing year-on-year changes, users are advised to refer to the suite of data tables, uncertainty-hbai-2023-24-tables, providing confidence intervals around the key HBAI estimates on the latest HBAI home page. These confidence intervals present how estimates might have varied if a different FRS sample had been created and to help the user to understand where some differences seen in the estimates do represent a true change (and not a result of variation from sampling different people in the UK over time). A new methodology to measure uncertainty around key HBAI estimates was implemented from the FYE 2016 HBAI publication onwards. Further information can be found in the Statistical Notice published in February 2017 and in Annex 4: Communicating Uncertainty of the HBAI Quality and Methodology Information Report which can be found on the HBAI homepage.
Information on each of the categories or measures can be found by double-clicking on the ‘i’ icon next to it.
Users are able to find extensive guidance and produce confidence intervals on their own analysis by accessing the HBAI data and HBAI resample datasets available at the UK Data Service.
6. Breakdowns Available
HBAI Stat-Xplore allows users to create their own analysis of these measures and breakdowns:
1. Sum of Income Distribution - Whole Population
2. Net 2010-11 Absolute Median Household Income Measures Before Housing Costs (BHC) and After Housing Costs (AHC):
-
Median:
-
In latest prices (weekly, equivalised, SPI-adjusted in CPI-adjusted real terms)
-
In year prices (weekly, equivalised, SPI-adjusted in nominal terms)
Note: Options to calculate means and ranges are included as standard Stat-Xplore measures but the median measure is recommended as it is the same median amount for all individuals in a certain year. The purpose of this measure is to present a time-series of how net 2010-11 (FYE 2011) absolute median household income BHC and AHC has changed over time in year prices, whilst the value for latest year will be fixed across all individuals for all years as it is the net 2010-11 (FYE 2011) absolute median income in the latest survey year prices.
3. Net Household Income Measures Before Housing Costs (BHC) and After Housing Costs (AHC):
-
Mean:
-
In latest prices (weekly, equivalised, SPI-adjusted in CPI-adjusted real terms)
-
In year prices (weekly, equivalised, SPI-adjusted in nominal terms)
-
Median:
-
In latest prices (weekly, equivalised, SPI-adjusted in CPI-adjusted real terms)
-
In year prices (weekly, equivalised, SPI-adjusted in nominal terms)
-
Range:
-
In latest prices (weekly, equivalised, SPI-adjusted in CPI-adjusted real terms)
-
In year prices (weekly, equivalised, SPI-adjusted in nominal terms)
4. Net Household Housing Costs Measures:
-
Mean:
-
In latest prices (weekly, equivalised, SPI-adjusted in CPI-adjusted real terms)
-
In year prices (weekly, equivalised, SPI-adjusted in nominal terms)
-
Median:
-
In latest prices (weekly, equivalised, SPI-adjusted in CPI-adjusted real terms)
-
In year prices (weekly, equivalised, SPI-adjusted in nominal terms)
-
Range:
-
In latest prices (weekly, equivalised, SPI-adjusted in CPI-adjusted real terms)
-
In year prices (weekly, equivalised, SPI-adjusted in nominal terms)
5. Reporting Period: Financial Year
Please note that data relating to FYE 2021 is not available in Stat Xplore due to data quality concerns affecting many of the HBAI estimates calculated below UK (headline) level for that year. Further details can be found in the technical report which accompanied the release of the FYE 2021 statistics. This report details the impact of the coronavirus (COVID-19) pandemic on the size and composition of the FRS sample.
6. Age-band of the Individual
7. Type of Individual by Age Category
8. Gender of the Individual
9. Disability Status of the Individual
10. Educational Attainment of the Individual
11. Net Household Income Thresholds - Before Housing Costs (BHC) and After Housing Costs (AHC):
-
Below/at or above 50% of Median Net Household Income in Latest Prices
-
Below/at or above 60% of Median Net Household Income in Latest Prices
-
Below/at or above 70% of Median Net Household Income in Latest Prices
-
Below/at or above 50% of 2010/11 Absolute Median Net Household Income in Latest Prices
-
Below/at or above 60% of 2010/11 Absolute Median Net Household Income in Latest Prices
-
Below/at or above 70% of 2010/11 Absolute Median Net Household Income in Latest Prices
12. Decile and Quintile group of the Household of the Individual - Before Housing Costs (BHC) and After Housing Costs (AHC):
-
Quintile of Net Household Income
-
Decile of Net Household Income
13. Combined Low Income and Child Material Deprivation group of the individual - Before Housing Costs (BHC) and After Housing Costs (AHC):
-
Below 50% of Median Net Household Income and in Child Material Deprivation
-
Below 60% of Median Net Household Income and in Child Material Deprivation
-
Below 70% of Median Net Household Income and in Child Material Deprivation
-
Below 50% of 2010/11 Absolute Median Net Household Income and in Child Material Deprivation
-
Below 60% of 2010/11 Absolute Median Net Household Income and in Child Material Deprivation
-
Below 70% of 2010/11 Absolute Median Net Household Income and in Child Material Deprivation
14. Combined Low Income and Working-Age Adult Material Deprivation group of the individual - Before Housing Costs (BHC) and After Housing Costs (AHC):
-
Below 50% of Median Net Household Income and in Working-Age Material Deprivation
-
Below 60% of Median Net Household Income and in Working-Age Material Deprivation
-
Below 70% of Median Net Household Income and in Working-Age Material Deprivation
-
Below 50% of 2010/11 Absolute Median Net Household Income and in Working-Age Material Deprivation
-
Below 60% of 2010/11 Absolute Median Net Household Income and in Working-Age Material Deprivation
-
Below 70% of 2010/11 Absolute Median Net Household Income and in Working-Age Material Deprivation
15. Material Deprivation group of the Individual:
-
Child Material Deprivation
-
Working-age Adult Material Deprivation
-
Pensioner (aged 65 or over) Material Deprivation
16. State Support received by the Family of the Individual:
-
Attendance Allowance (AA)
-
Carer’s Allowance (CA)
-
Child Tax Credits (CTC)
-
Disability Benefits: Disability Living Allowance Self-Care, Disability Living Allowance Mobility, War Disablement Pension/Armed Forces Compensation Scheme, Attendance Allowance, Industrial Injuries Disablement Benefit, Personal Independence Payment - Daily Living, Personal Independence Payment - Mobility
-
Disability Living Allowance: self-care and mobility (DLA)
-
Employment Support Allowance (ESA)
-
Housing Benefit (HB)
-
Incapacity Benefit (IB)
-
Income Support (IS)
-
Jobseeker’s Allowance (JSA)
-
Pension Credit (PC)
-
Personal Independence Payment: self-care and mobility (PIP)
-
Universal Credit (UC)
-
Universal Credit or Equivalent: Income-based Jobseeker’s Allowance, Income-related Employment Support Allowance, Income Support, Housing Benefit, Child Tax Credits, Working Tax Credits.
-
Working Tax Credits (WTC)
-
For Children: DLA, PIP, JSA, ESA, IB, CTC, WTC, IS, HB, UC, UC or Equivalent
-
For Working-age adults: DLA, PIP, JSA, ESA, CA, IB, CTC, WTC, IS, HB, UC, UC or Equivalent
-
For Pensioners: DLA, PIP, AA, PC, HB
-
For All Individuals: DLA, PIP, JSA, ESA, AA, CA, IB, CTC, WTC, IS, PC, HB, UC, UC or Equivalent
17. Universal Credit Applicable Family for the Individual
18. Disability in the Family of the Individual:
-
Disabled Children in the Family
-
Disability within the Family
-
Disability within the Family by Work Status
-
Disability Mix Within the Family
19. Economic Status categories for the Individual:
-
Economic Status of the Adult (ILO definition)
-
Economic Status of Adults in the Family
-
Economic Status of the Child’s Family by Family Type
-
Economic Status of the Child’s Family by Work Status
-
Economic Status of the Household
20. Marital Status and Type of Couple in the Family of the Individual
21. Savings and Investments in the Family of the Individual
22. Occupational and/or Personal Pensions received by the Family of the Individual:
-
Occupational Pensions or Personal Pensions or both received by the family overall
-
Occupational Pensions or Personal Pensions or both received by the family by the number of adults
-
Occupational Pensions or Personal Pensions or both received by the family by number of adults and marital status
23. Family Type categories for the Individual:
-
Family Type
-
Family Type by Living with Other Families status
-
Family Type by Single Status of the Family
-
Family Type by Children in the Family
24. Number of Children in the Family of the Individual
25. Age of Youngest Child in the Family of the Individual
26. Ethnicity of the Head of Household of the Individual:
-
Ethnic Group of the Head of the Household
-
Asian Ethnicity Group of the Head of the Household
27. Location in the United Kingdom of the Household of the Individual:
-
Great Britain or Northern Ireland
-
Country
-
Region
-
Inner and Outer London
28. Tenure Type of the Household of the Individual
29. Council Tax Band of the Household of the Individual
30. Household Status (conventional or shared) of the Household of the Individual
31. Household Food Security for the Household of the Individual
32. Food Banks used by the Household of the Individual:
-
Whether the Household used a Food Bank in the last 30 days
-
Whether the Household used a Food Bank in the last 12 months
Click on the ‘i’ icon for descriptions and any data issues for a breakdown.
Variations of these breakdowns are also possible using the ‘Add Derivation’ feature - see Section 12h below.
7. Current Dataset Exclusions (available in published tables)
The following breakdowns have not been included in this version:
-
Direct Payment Accounts
-
Bills in Arrears
-
Material Deprivation Questions
-
Disability Time-Series: Illustrative measures of living standards, excluding Disability Living Allowance, Personal Independence Payment and Attendance Allowance from income.
Gini co-efficients for income inequality analysis are also not possible in Stat-Xplore.
8. Known Issues and Changes to HBAI Data
The following known issues exist for the HBAI Stat-Xplore dataset:
Three-Year Average Estimates for Region, Country and Ethnicity:
Please note that Stat-Xplore cannot calculate 3-year average estimates. However final HBAI estimates for region, country and ethnicity must be presented as 3-year averages. Please refer to Section 15: Worked Example 2: Low Income by Country/Region for guidance.
Stat-Xplore vs. Published Tables Estimates for median incomes for decile and quintile groups:
In Stat-Xplore, these estimates are calculated from the incomes of individuals in the specific group. In published HBAI tables, median incomes for deciles and quintiles are taken from percentile income values for the whole population. As the calculations are based on very slightly different methods, there can sometimes be marginal differences seen for some income values when comparing Stat-Xplore outputs against published tables.
Footnotes (annotations):
Footnotes (annotations) are provided for numbers tables but are unavailable for percentages tables. Please switch back to number breakdowns to view footnotes related to the estimates produced and ensure final percentage estimates are presented correctly using the rounding conventions - see Section 5: HBAI Estimates Rounding Rules and Disclosure above.
HBAI Data Changes:
-
In 2023/24, updated material deprivation questions were included in the FRS for children, working-age adults, and pensioners, asked to 75% of households. The remaining 25% of households were asked the old questions (2010/11 for children and working-age adults, 2009/10 for pensioners). Imputation was used to estimate missing responses for the updated questions using old questions where possible. Estimates from old and updated methodologies are not comparable. More details can be found in the Technical report: update to measures using material deprivation for households below average income FYE 2024, which accompanies the release of 2023/24 statistics.
-
Development work in FYE 2023 to improve reporting on categories of level of education identified a separate issue with the FRS variable EDUCQUAL. As a result, split by level of educational attainment of the individual has been withdrawn from the FYE 2023 data. This has been restored for FYE 2024.
-
During FYE 2023 the government announced and implemented additional support to families with several cost-of-living support schemes, depending on peoples’ circumstances. These payments are included as part of the relevant income variables in HBAI.
-
From FYE 2022, income received from director’s dividends is included in the estimates following an addition to the Family Resources Survey. From FYE 2023, there has been an adjustment to the treatment of dividends for a small group of respondents: in cases where respondents are all of (i) self-employed, and (ii) state they are directors, and (iii) where their calculated income rests on profits from annual accounts, as opposed to the other figures reported; then it is assumed that the profit figure is already inclusive of any dividend also reported. The income is treated as income from earnings.
-
For the FYE 2021 estimates, wages are treated as income from employment rather than state support, irrespective of any support payments from Coronavirus Job Retention Scheme (CJRS) that the respondent’s employer was receiving in respect of their employment. Amounts received through the Self-Employment Income Support Scheme (SEISS) for the self-employed are indirectly included as part of the reporting of profit data for the most recent available tax year.
-
In the FYE 2020 statistics a minor methodological revision was made to capture all income from child maintenance. As a result, the full back series (back to FYE 1995) was revised. Gov.uk publication files issued prior to FYE 2020 may contain slightly different figures. Please refer to the HBAI Quality and Methodology Information Report which is available via the HBAI homepage for more information.
-
Since FYE 2020, the level of savings and investments for both families (benefit units) and households has been estimated using a slightly different methodology. Further information can be found in the FRS Background Information and Methodology.
-
As advised in a Statistical Notice published in May 2016, HBAI has made a methodological change to use variants of CPI when adjusting for inflation from the FYE 2015 publication onwards. Prior to the FYE 2015 HBAI publication variants of RPI were used to adjust for inflation. Therefore, all tables created here will use CPI-adjusted inflation and so will not be consistent with published tables prior to FYE 2015.
-
The tables use grossing factors based on 2011 Census data, so caution should be exercised when making comparisons with published reports and tables prior to FYE 2013 as well as taking into account the FYE 2020 minor methodological detailed above.
9. Important Footnotes
A series of footnotes (annotations) are provided to guide the user when producing estimates:
Table 9: Important Footnotes for HBAI Stat-Xplore
| Symbol | Description |
|---|---|
| I | Figures are for the United Kingdom from FYE 2003 onwards. Earlier years are for Great Britain only. The reference period is single financial years. Source: Family Resources Survey (FRS), Department for Work and Pensions. |
| II | Figures derived are unrounded. Before use of these figures, users must use the following rounding conventions: a) Percentages must be rounded to the nearest whole per cent. b) Numbers must be rounded to the nearest 0.1 million (or 100,000 individuals). c) Amounts must be rounded to the nearest £1 (weekly) and nearest £100 (annual). These rounding conventions have been set to reflect that HBAI estimates are based on survey data and not actual records of individuals in the UK. |
| III | The estimates are based on sample counts that have been adjusted for non-response using multi-purpose grossing factors that control for tenure type, Council Tax Band and a number of demographic variables. The grossing factors are based on 2011 Census data, so caution should be exercised when making comparisons with published reports and tables prior to FYE 2013. Estimates are subject to sampling error and remaining non-sampling bias. |
| IV | Incomes are adjusted through a process of equivalisation to allow for fair comparison across different household sizes and compositions. Small changes in estimates from year to year, particularly at the bottom of the income distribution, may not be significant in view of data uncertainties. Please read the Meta Information page for more information - click on the ‘i’ next to the breakdown label. |
| V | ”..” indicates data not being available in that year. |
| i | Click to view information about the category and any data issues. |
Further breakdown or measure specific footnotes are also included.
Note that footnotes are not displayed on percentages tables in HBAI Stat-Xplore.
10. How the Dataset Works
Please note the following images and examples relate to FYE 2022 data as the latest year. Data for FYE 2024 is now available but the following guidance remains the same.
Please take the tour to learn about how to use a Stat-Xplore dataset.
Click on the 3 dots on the top right-hand corner of the page and select to find the ‘Tour’ again if you have visited the website before.
Further useful guidance can be found by selecting the ‘?’ icon.
Figure 1 - Stat-Xplore Dataset

Scroll down to the Households Below Average Income Dataset and please take time to read the front page for important information on rounding final figures and known issues.
Figure 2 - HBAI Stat-Xplore Dataset

Click on the dataset icon or a ready-made table.
11. Ready-Made Tables
Six ready-made tables are available for users to quickly output main headline HBAI estimates or use as a starting point for further analysis:
-
HBAI 1: 60 per cent of median net household income BHC by Type of Individual for All Years
-
HBAI 2: 60 per cent of median net household income AHC by Type of Individual for All Years
-
HBAI 3: 60 per cent of 2010-11 absolute median net household income BHC by Type of Individual for All Years
-
HBAI 4: 60 per cent of 2010-11 absolute median net household income AHC by Type of Individual for All Years
-
HBAI 5: Children in Combined Low Income and Child Material Deprivation for All Years
-
HBAI 6: 60 per cent of median net household income BHC by Economic Status of Adults in the Family for FYE 2024
Here is the ‘Ready-Made Table HBAI 1: 60 per cent of median net household income BHC by Type of Individual for All Years’:
Figure 3 - Ready-Made Table HBAI 1

The user can select which ‘Type of Individual by Age Category’ to view in the table by selecting from the ‘wafer’ list. Note that Ready-Made Tables HBAI 1 to 4 give the highest level of ‘Type of Individual by Age Category’ – child, working-age adult, pensioner and total.
Click on the ‘Go’ button in the top right-hand corner of the screen to ‘Download Table’. An excel workbook will be created and as a wafer was selected, a table will be created for each group in the wafer - in this example, each ‘Type of Individual by Age Category’ is outputted (child, working-age adult, pensioner and total).
12. User-Defined Analysis
When the user double-clicks on the dataset icon, the following page is displayed (this example uses FYE 2022 but will be the latest year available in the dataset):
Figure 4 - Main HBAI Stat-Xplore Dataset Screen

a. Removing Financial Year total
As with other breakdowns, ‘Financial Year’ has a total column or row by default (this example uses FYE 2022 but will be the latest available year in the dataset).
However, please remove the total before outputting tables by clicking on the 3 dots next to the ‘Financial Year’ label in the table and unticking the ‘Total’.
Figure 5 - Removing Financial Year Total

b. Financial Year as a Row
‘Financial Year’ 2021/22 (FYE 2022) is a mandatory field and it will always be displayed as a column by default (this example uses FYE 2022 but will be the latest available year in the dataset).
To have ‘Financial Year’ as a row:
- Drag ‘Financial Year’ in the table on the right over the ‘third square down’.
Figure 6 - Financial Year as a Row

c. Creating a Time-Series
To add a time-series as a column:
-
Drag the ‘Financial Year’ breakdown on the left hand-side and select ‘Column’ from the mini selection table that appears.
-
Alternatively, click on the ‘Financial Year’ breakdown and click on ‘Column’ at the top.
Figure 7 - Time-series as a Column

To add a time-series as a row:
-
Drag ‘Financial Year’ in the table on the right over the ‘third square down’ as directed in ‘a. Financial Year as a Row’ above.
-
Drag the ‘Financial Year’ breakdown and select ‘Row’ from the mini selection table that appears.
-
Alternatively, click on the ‘Financial Year’ breakdown and click on ‘Row’ at the top.
Figure 8 - Time-series as a Row

d. Selecting Specific Financial Years
To select specific financial years:
-
Double click on the ‘Financial Year’ breakdown on the left hand-side.
-
Tick the required years.
-
Select ‘Column’ or ‘Row’ at the top (depending on whether the ‘Financial Year’ is a row or column).
Figure 9 - Selecting Specific Financial Years

e. Removing the Latest Financial Year
To remove the latest year, click on the year and select ‘remove’ at the top.
Figure 10 - Removing the Latest Financial Year

f. Creating, Editing and Exporting a Numbers Table
Once the ‘Financial Year(s)’ row or column selection is complete, the user can select breakdowns as columns or rows and click on ‘Retrieve Data’ to get the outputs.
Numbers are presented by default in the HBAI Stat-Xplore Dataset.
Note that:
-
Any relevant footnotes (annotations) to the breakdowns selected will also be displayed.
-
To remove a breakdown, drag it to the ‘Remove Item’ icon above the table.
-
To clear the table, click on the ‘Clear Table’ icon above the table.
-
To output to Excel, click on the ‘Go’ icon at the very top right corner of the screen.
Figure 11 - Creating, Editing and Exporting a Numbers Table

Please add Source: HBAI Stat-Xplore to any analysis shared or published.
g. Converting a Numbers Table to Percentages Table
To convert a numbers table to a percentages table:
-
Select the ‘Table Options’ icon above the table.
-
Select the ‘Percentages’ option.
-
Select the appropriate ‘Column’ or ‘Row’ to convert to percentages.
Figure 12 - Converting a Numbers Table to Percentages Table
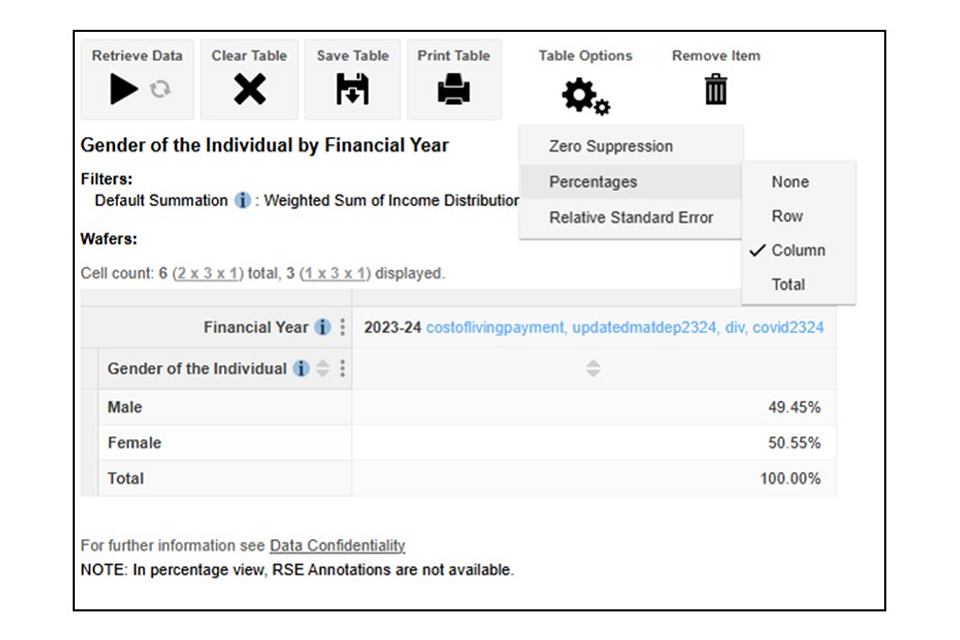
Note that:
-
Footnotes are not displayed for percentages tables.
-
To convert back to numbers, repeat the instructions above and select ‘None’.
Please add Source: HBAI Stat-Xplore to any analysis shared or published.
h. Adding a Derivation
The ‘Add Derivation’ feature allows the user to create a variation of a category.
For example, to create a table presenting ‘60% of median net household income BHC in latest prices’:
-
Click on ‘Measures’ on the left-hand side of the screen.
-
Select the ‘Median’ option from ‘Net Household Income (BHC) in latest prices (weekly, equivalised, SPI-adjusted in CPI-adjusted real terms)’ and drag as a row.
-
Click on the 3 dots next to the label to get the ‘Add Derivation’ option.
Figure 13 - Adding a Derivation
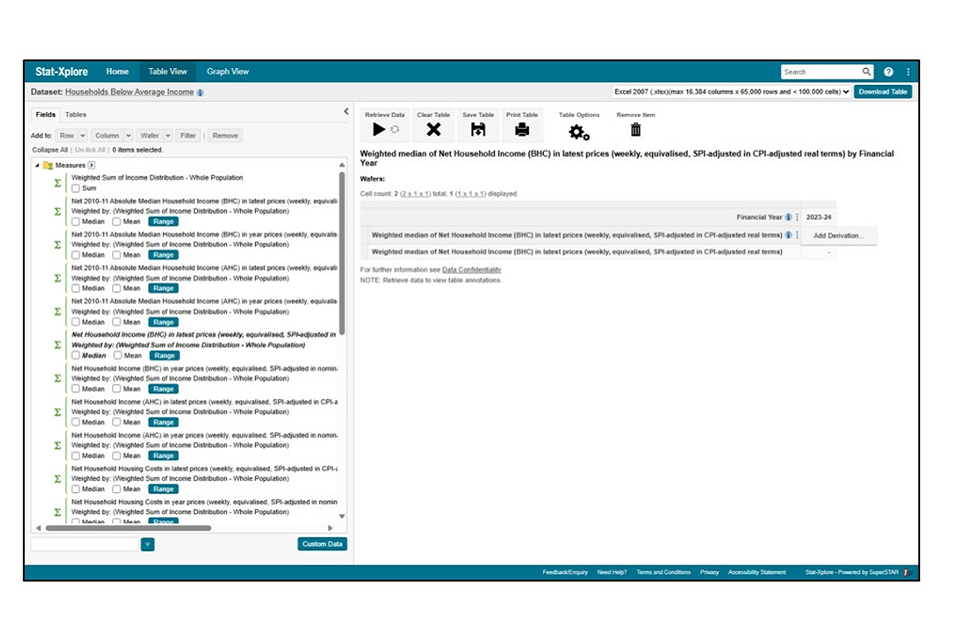
-
Click on ‘Add Derivation’ and create a name for the new derivation, such as ‘60% of median income BHC in latest prices (weekly, equivalised, SPI-adjusted in CPI-adjusted real terms)’.
-
Add the formula: 0.6*v1 – where v1 is the original median measure – and click ‘Create’.
Figure 14 - Defining a New Derivation
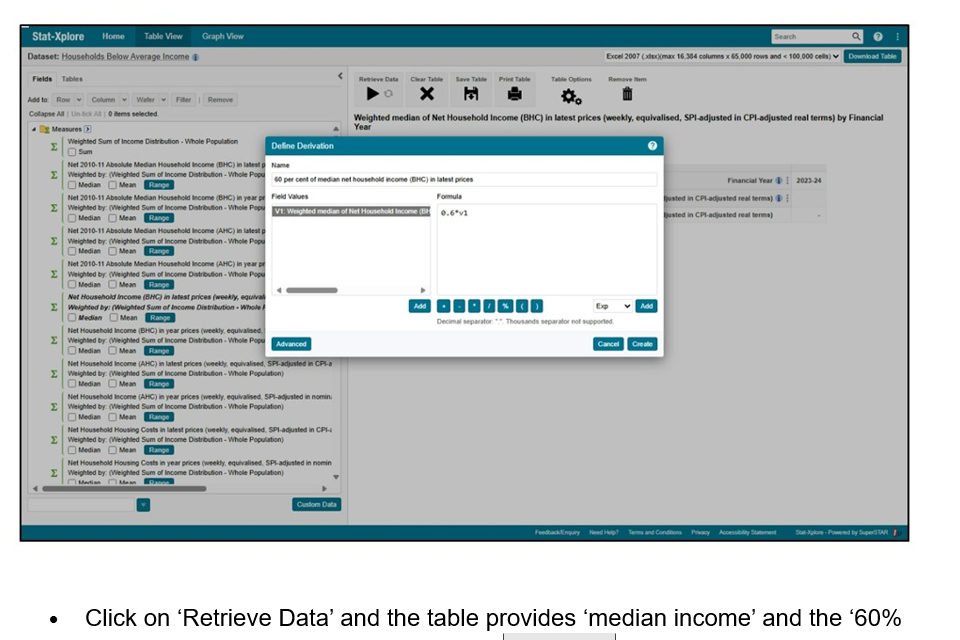
- Click on ‘Retrieve Data’ and the table provides ‘median income’ and the ‘60% threshold of median income’ measures measures for the latest year (or for 2021/22 (FYE 2022) in this example):
Figure 15 - New Derivation Table
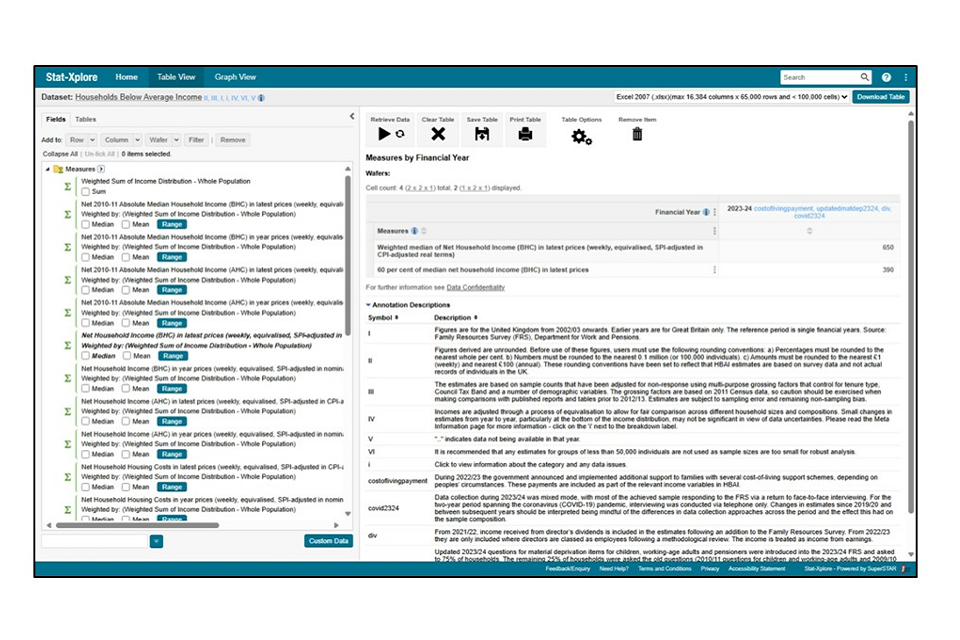
This table can be produced for all years and for other thresholds too.
i. Creating Income Bands
The user can create income bands using the ‘Range’ feature for any of the measures.
For example, to create a table presenting ‘Income Bands for Net Household Income Before Housing Costs in latest prices’:
-
Click on ‘Measures’ on the left-hand side of the screen.
-
Select the ‘Range’ option from the ‘Net Household Income (BHC) in latest prices (weekly, equivalised, SPI-adjusted in CPI-adjusted real terms)’ measure.
-
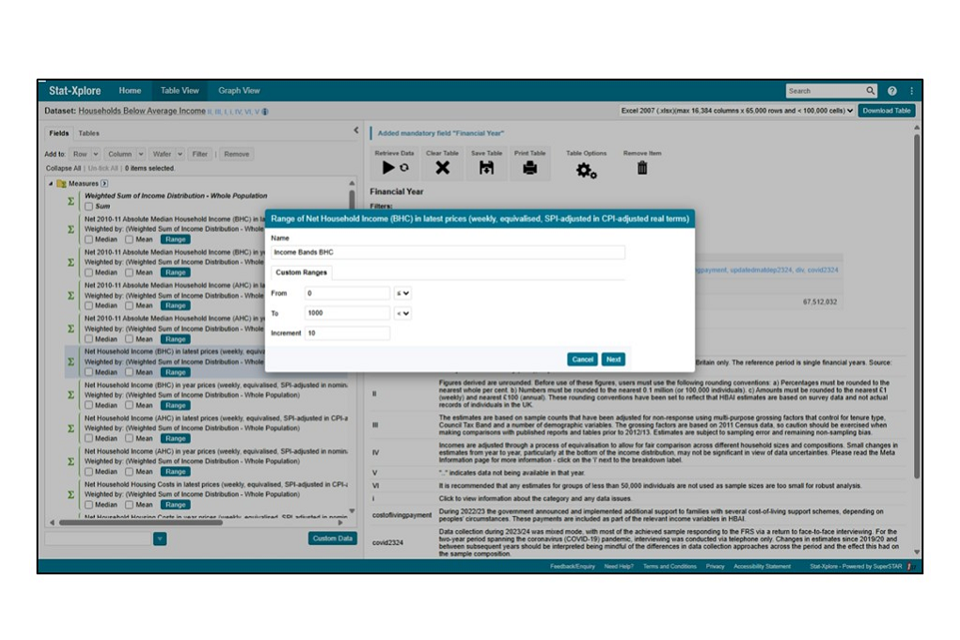
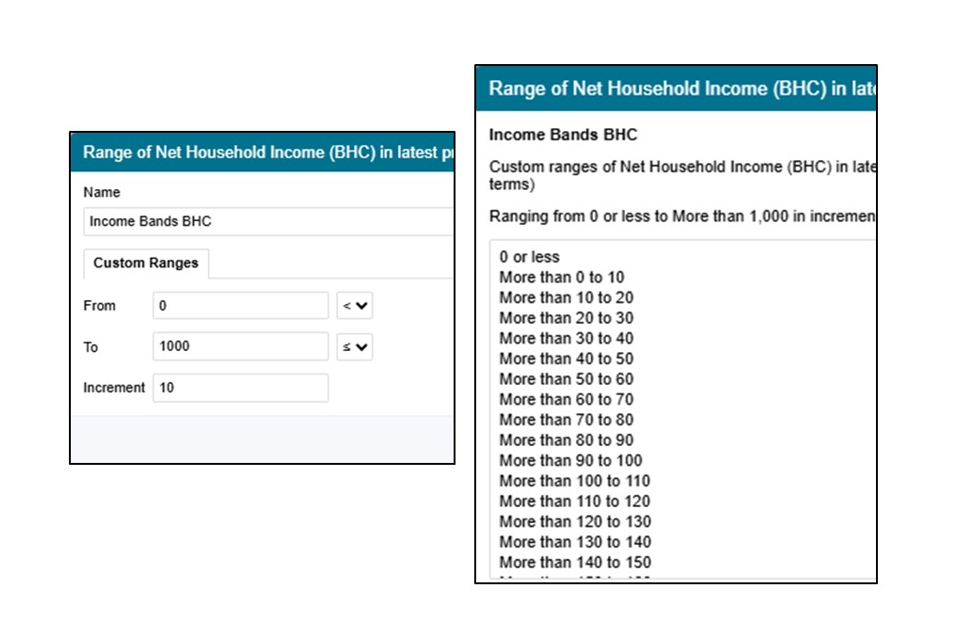
In the pop-up box, create a name and choose the minimum and maximum income amounts and the increment - for this example, the name is ‘Income Bands BHC’ (as there is a length limit) and the range selected is from £0 to £1000 per week, in increments of £10 per week.
Figure 16 - Creating a Range
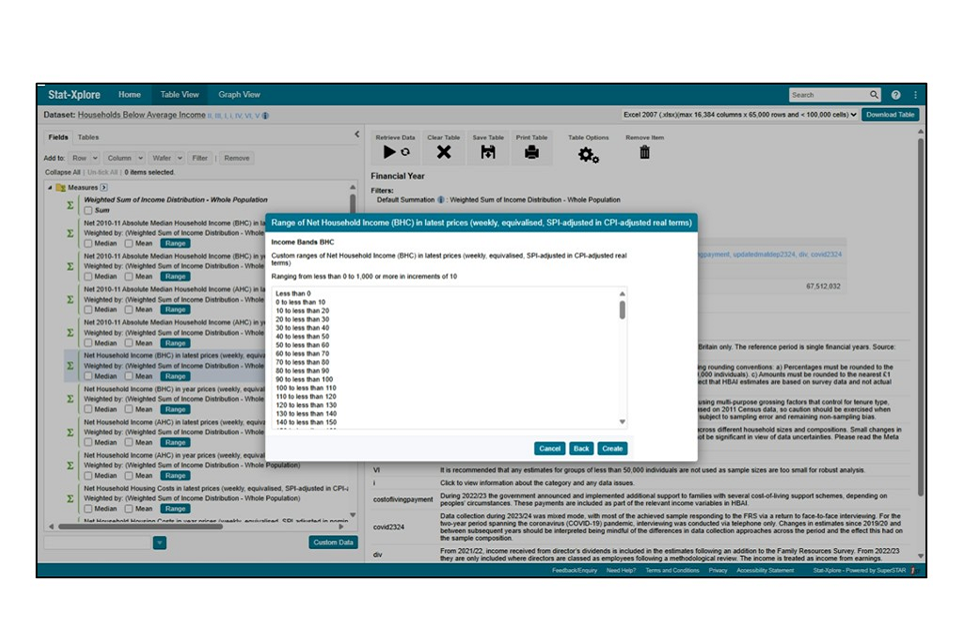
- Click on ‘Next’ and the range requested appears:
Figure 17 - The New Range
-
Click ‘Create’ and the measure will appear on the left-hand side with the other breakdowns under the category ‘Ranges’.
-
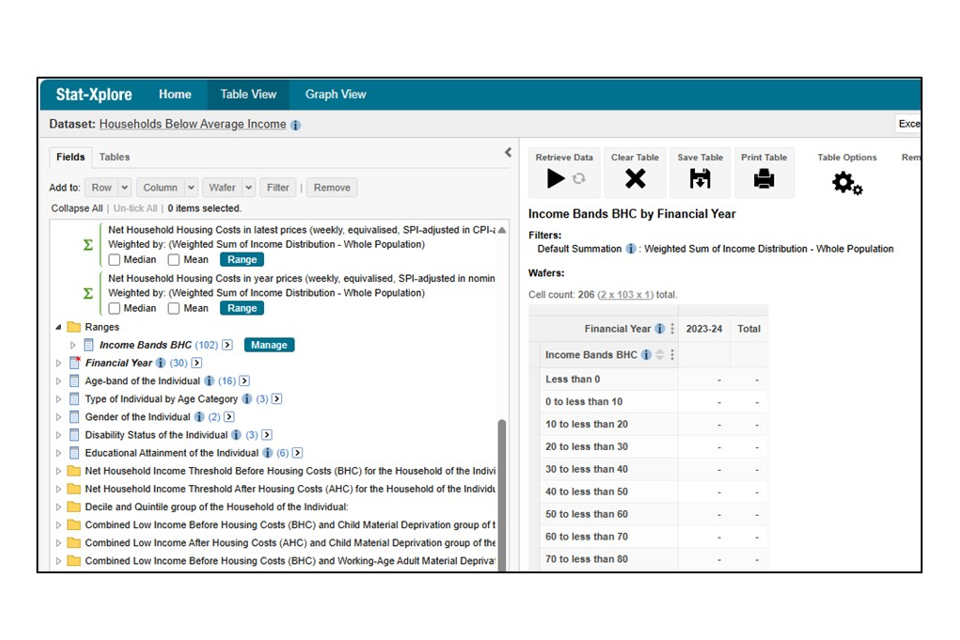
Select the new range as a row and retrieve data.
Figure 18 - Table with the New Range
Please take care in defining the ranges:
- Choosing the starting range ‘<=’ gives the ranges: Less than 0 (Less than £0), 0 to less than 10 (£0 to £9), 10 to less than 20 (£10 to £19) etc.:
Figure 19 - Range Type 1
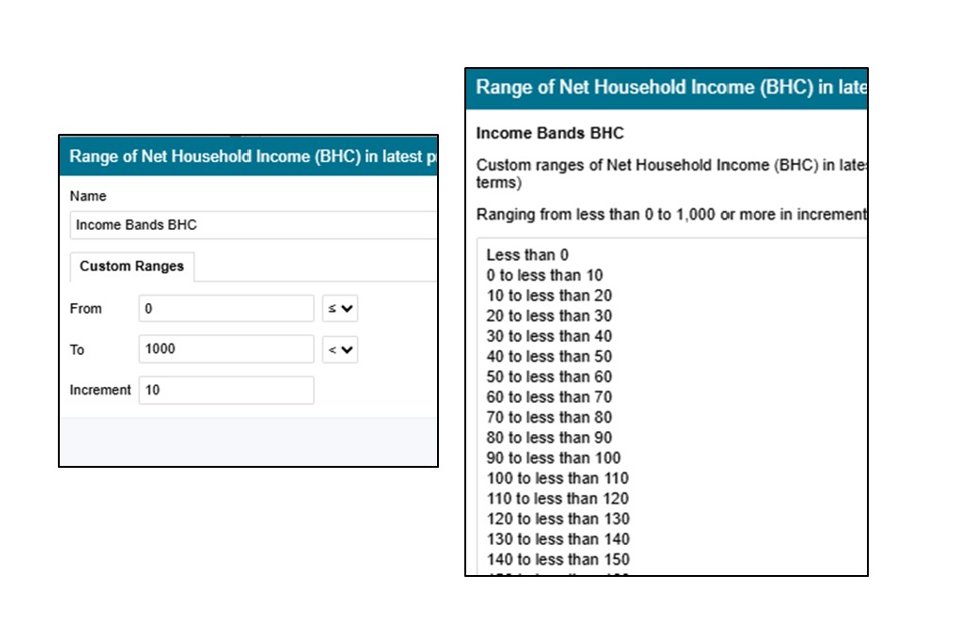
- Choosing the starting range ‘<’ gives the ranges: 0 or less (£0 or less), More than 0 to 10 (£1 to £10), More than 10 to 20 (£11 to £20) etc.:
Figure 20 - Range Type 2
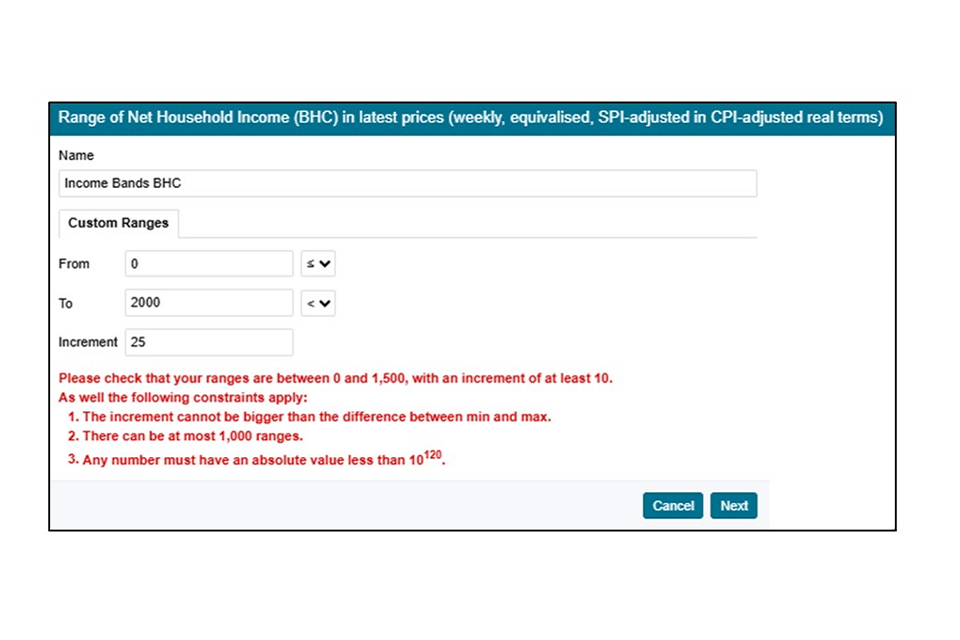
Limitations are placed for deriving ranges and a red warning will appear if the following criteria are not met:
Table 12H: Limitations for Deriving Income Ranges
| Before Housing Costs | After Housing Costs | |
|---|---|---|
| Minimum Income | £0 | -£100 |
| Maximum Income | £1,500 | £1,500 |
| Increment | At least £10 | At least £10 |
| Maximum number of ranges | 1000 | 1000 |
Figure 21 - Range Warnings
13. Further Top Tips
Below is a series of further top tips when using Stat-Xplore:
Stat-Xplore vs. Published Tables
-
Check whether the breakdown you require is currently available in the Published Tables already.
-
Take care when trying to replicate published tables and use them to quality assure the Stat-Xplore outputs before creating further analysis.
-
Not all published table breakdowns are available in Stat-Xplore – see Section 7: Current Exclusions (available in published tables) above.
Building a Table
The Ready-Made Tables allow instant export and analysis for:
-
HBAI 1: 60 per cent of median net household income BHC by Type of Individual for All Years
-
HBAI 2: 60 per cent of median net household income AHC by Type of Individual for All Years
-
HBAI 3: 60 per cent of 2010-11 absolute median net household income BHC by Type of Individual for All Years
-
HBAI 4: 60 per cent of 2010-11 absolute median net household income AHC by Type of Individual for All Years
-
HBAI 5: Children in Combined Low Income and Child Material Deprivation for All Years
-
HBAI 6: 60 per cent of median net household income BHC by Economic Status of Adults in the Family for FYE 2024
and can provide a good foundation for further analysis of these headline HBAI estimates. Note that Ready-Made Tables HBAI 1 to 4 give the highest level of ‘Type of Individual by Age Category’ – child, working-age adult, pensioner and total.
When producing new tables:
-
It is generally recommended to have ‘Financial Year’ as a column so that time-series outputs go across the table.
-
Build a table in the following order: 1. Filter, 2. Wafer, 3. Column, 4. Row.
-
Select ‘Type of Individual by Age Category’ as a ‘wafer’ to produce the same cross-tabulations for each type in 1 output.
Composition Tables
-
Assuming the ‘Financial Year’ is a column and a group is in the row, then the ‘composition’ of a group can be calculated by selecting ‘Column’ when converting numbers to percentages - remember Composition=Column
-
Filter down further by the required ‘Type of Individual by Age Category’ or characteristic.
Risk Tables
-
Assuming the ‘Financial Year’ is a column and a low income group breakdown is in the row, then the ‘risk’ of a group being in low income or not can be calculated by selecting ‘Row’ when converting numbers to percentages - remember Risk=Row
-
Filter down further by the required ‘Type of Individual by Age Category’ or characteristic.
The table below provides direction on what to select to create ‘Composition’ and ‘Risk’ tables using FYE 2022 as the latest year in this example:
Table 13: Directions for calculating Composition and Risk Tables for Low Income Estimates
| Analysis | Filter | Wafer | Row | Column | Numbers to Percentages |
|---|---|---|---|---|---|
| Composition for 60% of median income BHC by Type of Individual by Age Category in latest prices by age-band, FYE 2022 | 60% of median income (BHC) | Age-band of the Individual | Financial Year 2021/22 | Table Options then Percentages then Column | |
| Risk for 60% of median income BHC by Type of Individual by Age Category, All Years | Type of Individual by Age Category | 60% of median income (BHC) in latest prices | Financial Year (select all years) | Table Options then Percentages then Row |
14. Worked Example 1: In-Work Low Income
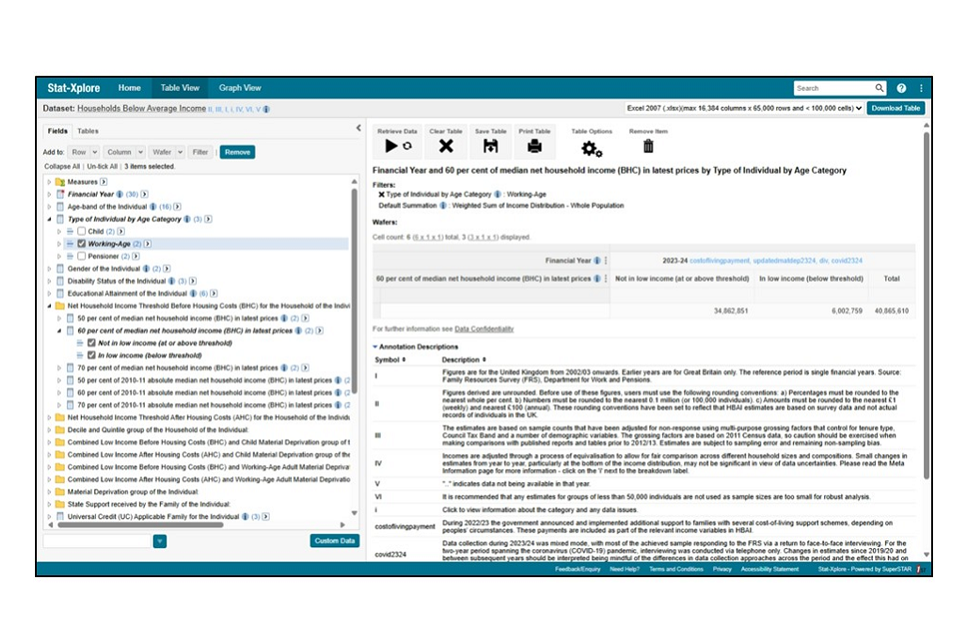
14.1. Select ‘Working-Age Adults’:
-
Click on ‘Type of Individual by Age Category’.
-
Tick ‘Working-Age’.
-
Select ‘Filter’.
14.2. Select the ‘60% of median income BHC threshold’:
-
Select ‘Net Household Income Threshold – Before Housing Costs’.
-
Select ‘60 per cent of median net household income (BHC) in latest prices’.
-
Drag and select ‘Column’ or tick both ‘Below threshold’ and ‘At or above threshold’ and click on ‘Column’
-
Click on the 3 dots next to ‘Financial Year’ and untick total.
Figure 22 - Worked Example 1 Set-Up
14.3. Select ‘Adults in Work’:
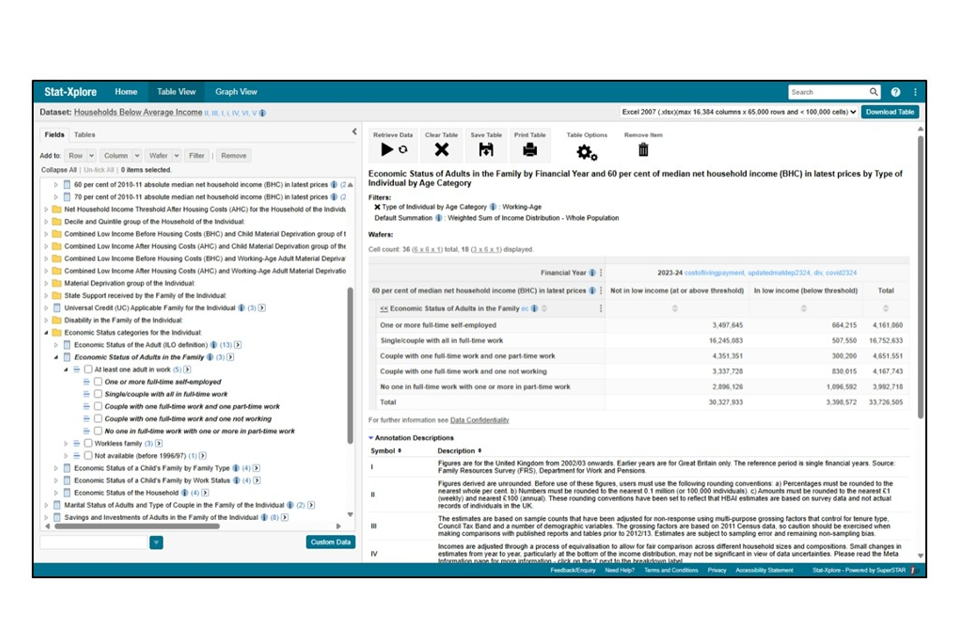
-
Select ‘Economic Status of Adults in the Family’.
-
Select the ‘At least 1 adult in work’ subgroup, tick each of the categories and click on ‘Row’.
-
Click on ‘Retrieve Data’.
Figure 23 - Worked Example 1 Further Selection
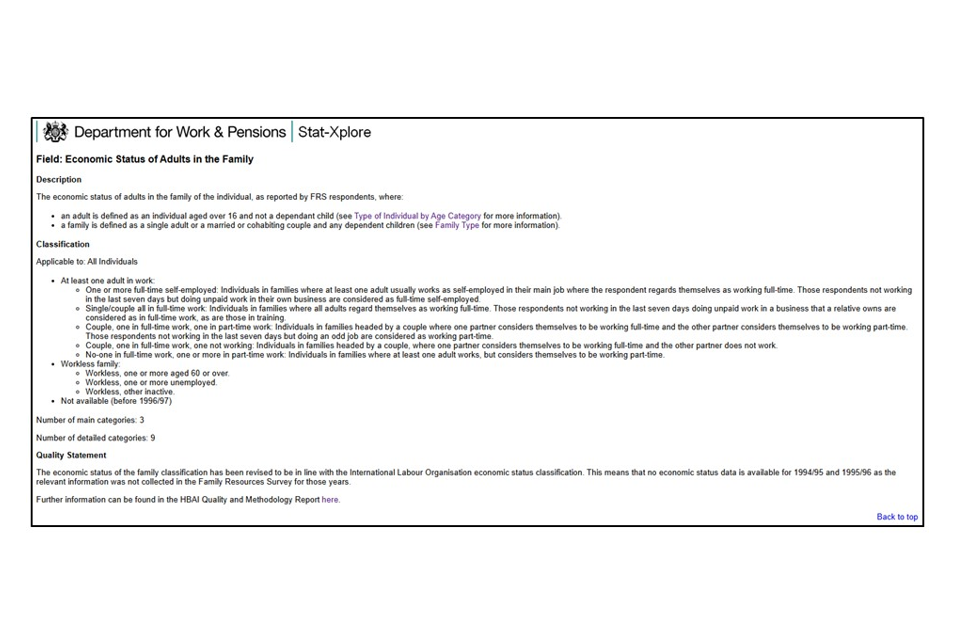
14.4. Click on the ‘i’ icon next to the breakdown:
-
This provides an information page for the breakdown, with details of the categories and any data quality issues.
-
It opens in a separate tab, so click back onto the Dataset tab to continue analysis.
Figure 24 - Worked Example 1 Information Page
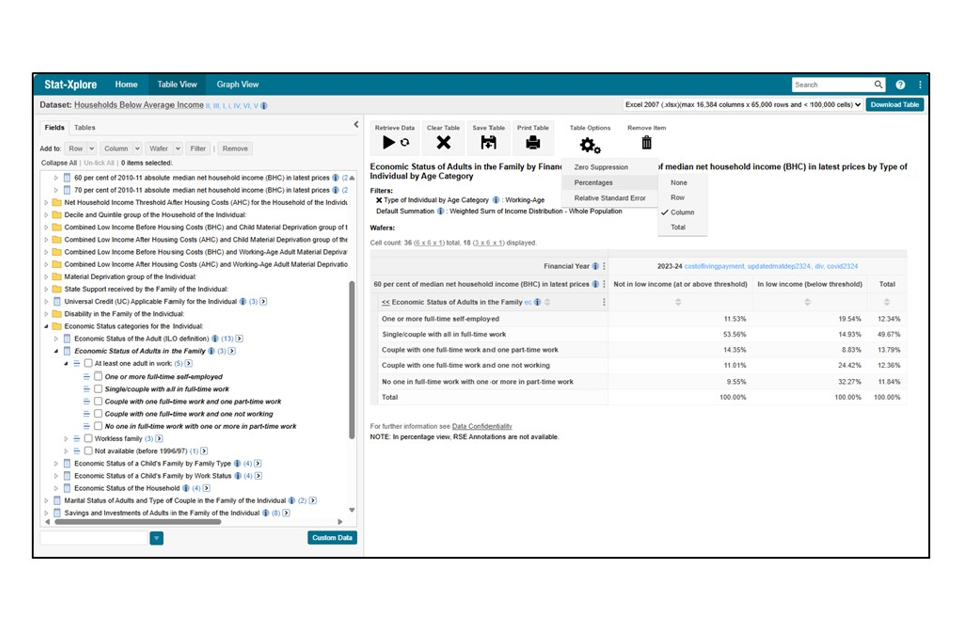
14.5. For composition of those in-work by low income threshold:
-
Select ‘Table Options’.
-
Select ‘Percentages’.
-
Tick ‘Column’.
Figure 25 - Worked Example 1 Composition Table
14.6. For risk of in-work low income:
-
Select ‘Table Options’.
-
Select ‘Percentages’.
-
Tick ‘Row’.
Figure 26 - Worked Example 1 Risk Table
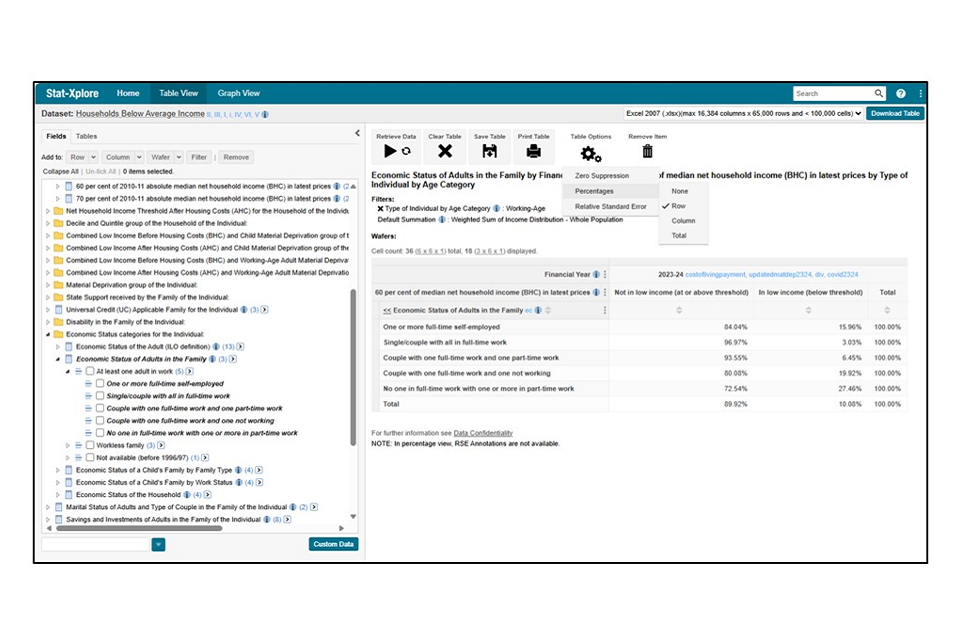
Note that both thresholds (below and at/above) are needed for Stat-Xplore to calculate risk percentages.
Footnotes cannot currently be presented with percentage tables.
14.7. Click on the ‘Go’ button in the top right corner and the table is exported to Excel:
Figure 27 - Worked Example 1 Excel Output
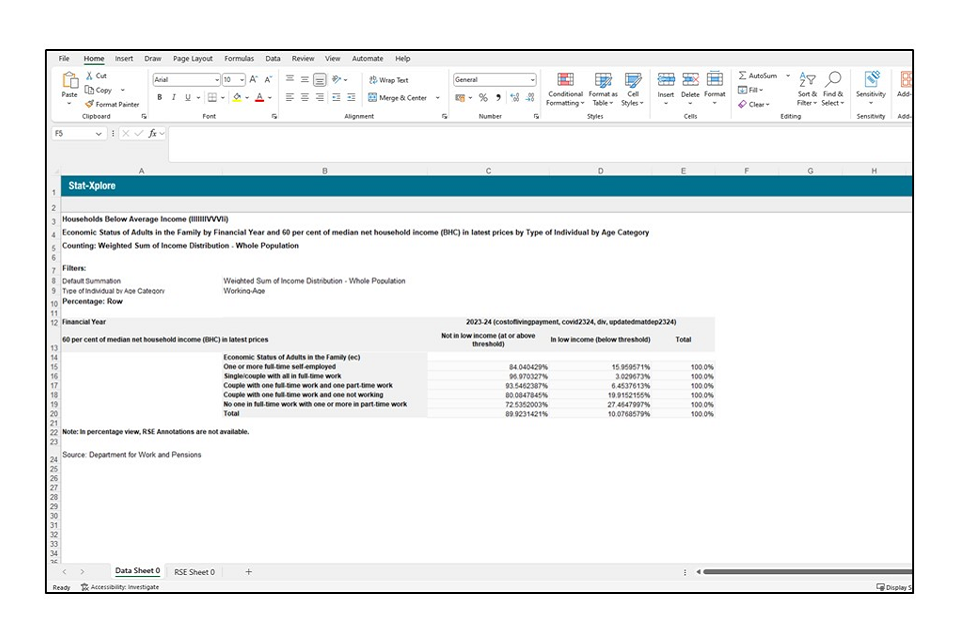
Please add Source: HBAI Stat-Xplore to any analysis shared or published.
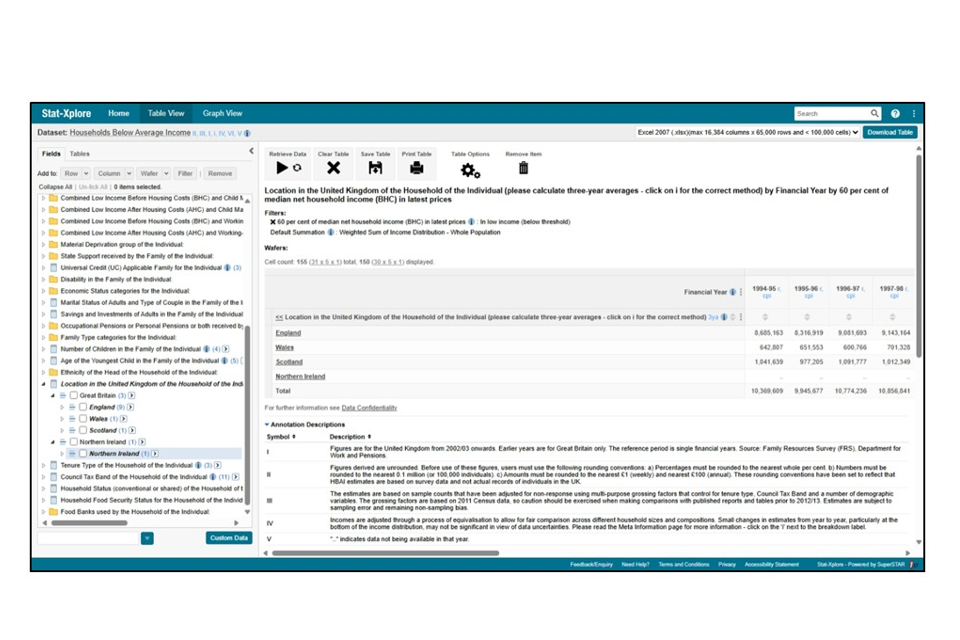
15. Worked Example 2: Low Income by Country/Region
15.1. Create the Table:
-
Select ‘Net Household Income Threshold – Before Housing Costs’.
-
Select ‘60 per cent of median net household income (BHC) in latest prices’ and tick the ‘In Low Income (Below Threshold)’ category.
-
Click on ‘Filter’.
-
Click on ‘Financial Year’ and drag to column.
-
Click on the 3 dots next to ‘Financial Year’ and untick total.
-
Click on ‘Location in the United Kingdom of the Household of the Individual’, click down to ‘Great Britain’ and ‘Northern Ireland’ level, select all countries and click on row.
-
Click on ‘Retrieve Data’.
Figure 28 - Worked Example 2 Table Creation
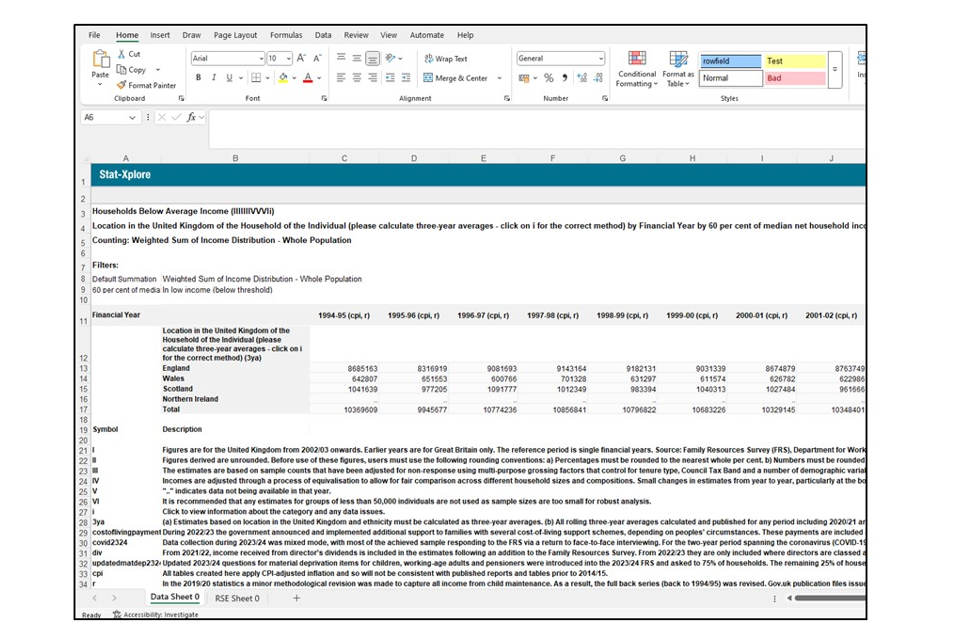
15.2. Click on the ‘Go’ button in the top right corner and the table is exported to Excel:
Figure 29 - Worked Example 2 Excel Output
15.3. Calculate 3-year averages for numbers:
-
Create a new table and link to the outputs.
-
Create a 3-year average table below it.
-
Use the formula Year 1 to Year 3 estimate = (Year 1 estimate + Year 2 estimate + Year 3 estimate)/3.
Figure 30 - Worked Example 2 Calculating a 3-Year Average for Numbers
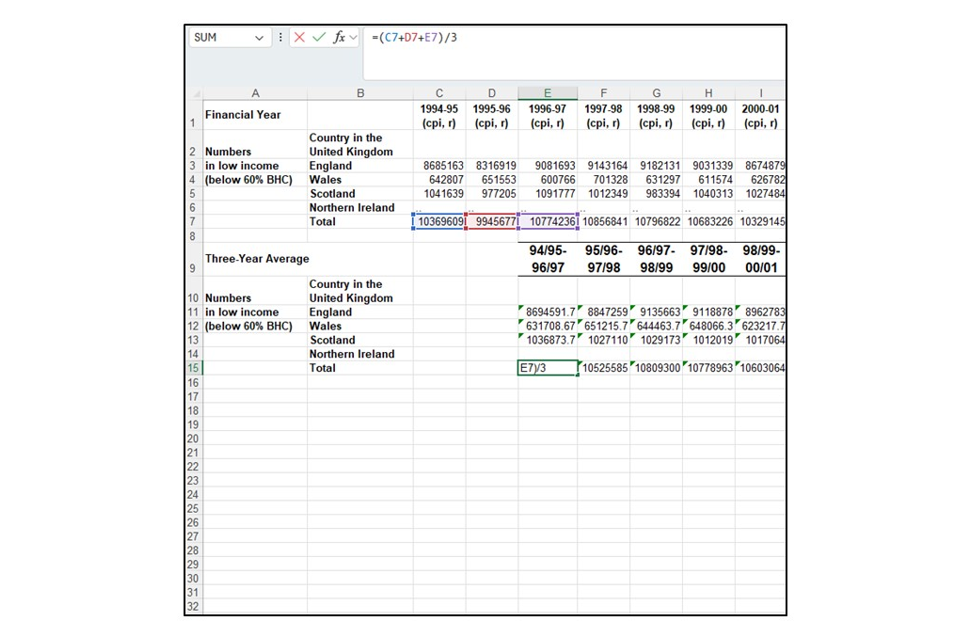
For the rest of the times-series, calculate a 3-year rolling average i.e. FYE 1995 to FYE 1997, FYE 1996 to FYE 1998, FYE 1997 to FYE 1999 and so on.
15.4. Calculate 3 year averages for percentages
It is strongly recommended that a numbers table is outputted and percentages calculated by the user in Excel before calculating 3-year average percentage estimates.
Alternatively, the user will need to output a percentage table separately for each year.
To calculate 3-year averages for percentages:
-
Create a percentages table below the numbers table.
-
Calculate the percentage for each cell.
Figure 31 - Worked Example 2 Calculating a 3-Year Average for Percentages Set-Up
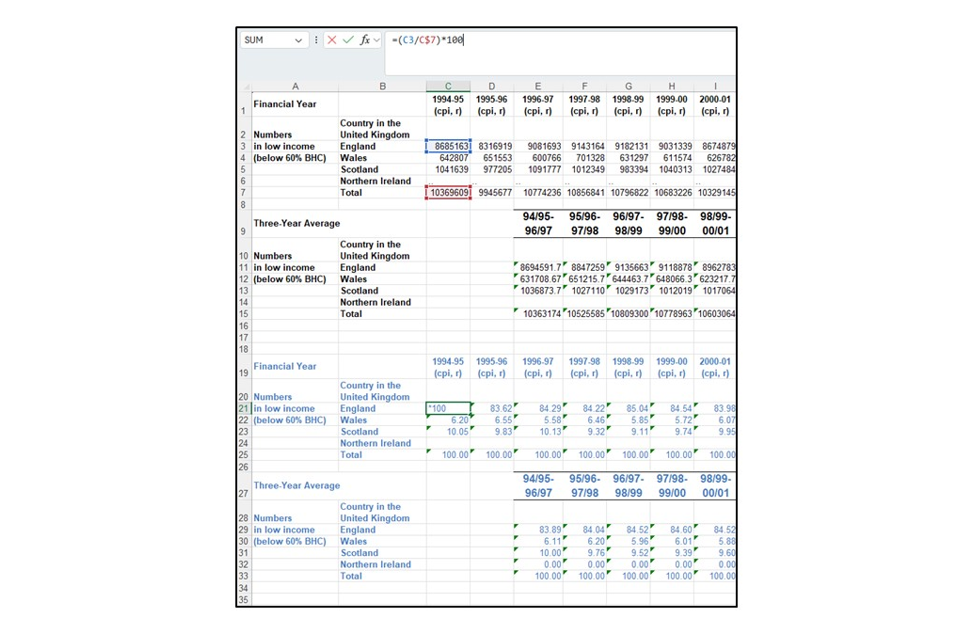
-
Create a 3-year average table below it.
-
Use the formula Year 1 to Year 3 percentage estimate = (Year 1 percentage estimate + Year 2 number percentage + Year 3 percentage estimate)/3.
Figure 32 - Worked Example 2 Calculating a 3-Year Average for Percentages
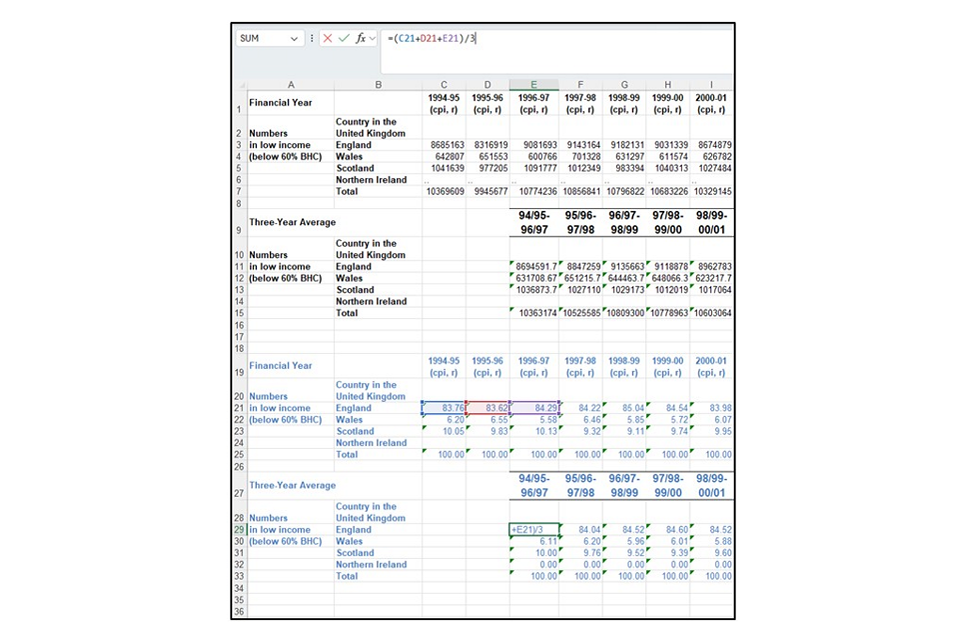
For the rest of the times-series, calculate a 3-year rolling average i.e. FYE 1995 to FYE 1997, FYE 1996 to FYE 1998, FYE 1997 to FYE 1999 and so on.
Please add Source: HBAI Stat-Xplore to any analysis shared or published.
Please email the HBAI team with comments and suggestions.
