HMRC monthly performance update: April 2018
Published 2 August 2018

© Crown copyright 2018
This publication is licensed under the terms of the Open Government Licence v3.0 except where otherwise stated. To view this licence, visit nationalarchives.gov.uk/doc/open-government-licence/version/3 or write to the Information Policy Team, The National Archives, Kew, London TW9 4DU, or email: psi@nationalarchives.gov.uk.
Where we have identified any third party copyright information you will need to obtain permission from the copyright holders concerned.
This publication is available at https://www.gov.uk/government/publications/hmrc-monthly-performance-report-april-2018/hmrc-monthly-performance-update-april-2018
These figures show how we’re performing against our main customer service objectives, which are about:
- how we’re helping our online customers
- how quickly we answer their phone calls
- how quickly we handle their post
- how we handle complaints
Our objectives are set by the Chancellor of the Exchequer and are published in our single departmental plan.
1. At a glance
These are the figures for our customer service contact volumes, and performance against our customer service objectives.
1.1 Contact volumes
Note
Demand for our customer services may vary significantly between months due to the seasonal nature of revenue and customs administration.
| Current month | Year-to-date since April 2018 | Compared to year-to-date 2017-18 | |
|---|---|---|---|
| Personal tax account new users | 0.3m | 15.3m [1] | 9.9m [1] |
| iForms received | 153,920 | 153,920 | 124,337 |
| Calls received | 3,855,064 | 3,855,064 | 3,895,443 |
| Post received [2] | 1,309,599 | 1,309,599 | 1,249,271 |
| New complaints received [3] | 6,551 | 6,551 | 5,067 |
Notes
- The number of people who have set up a personal tax account since its launch in December 2015.
- Post is not always categorised on our live system during the month it is received, meaning that numbers may be revised in subsequent monthly reports. The current month will be subject to greatest revision.
- Complaints are not always logged on our live system during the month they are received, and the numbers may be revised in subsequent monthly reports. The current month will be subject to greatest revision.
1.2 Performance
| Current month | Year-to-date since April 2018 | Compared to year-to-date 2017-18 | Target | |
|---|---|---|---|---|
| Customer satisfaction with digital services | 78.4% | 78.4% | 79.6% | 80% |
| Customer iForms cleared within 7 days of receipt | 96.0% | 96.0% | 89.5% | 95% |
| Average speed of answering a customer’s call [1] | 05:09 | 05:09 | 04:01 | 05:00 mins |
| Customers waiting more than 10 minutes to speak to an adviser | 17.1% | 17.1% | 13.6% | No more than 15% |
| Customer post cleared within 15 days of receipt [2] | 78.6% | 78.6% | 65.1% | 80% |
| Customer post cleared within 40 days of receipt [3] | 98.0% | 97.1% | 96.3% | 95% |
| Handle new tax credit and Child Benefit claims and change of circumstance (UK) [4] | 12.4 | 13.8 | 16 | 22 days on average |
| Handle new tax credit and Child Benefit claims and change of circumstance (international) [4] | 72.9 | 55.6 | 52 | 92 days on average |
Notes
- Average speed of answer data is recorded from the time a customer requests to speak to an adviser, after going through our automated routing response system.
- Post turnaround refers to post to which customers are expecting a response.
- To enable 40 days to pass, this data is lagged by a month.
- This data is lagged by a month.
The figures reported during the year are compiled from initial management information to provide an indication of our performance. They are subject to revision and audit. Final full-year performance figures will be published in our annual report and accounts.
2. Customer satisfaction with digital services
2.1 Customer satisfaction
Our target for 2018 to 2019 is that 80% of customers are either ‘satisfied’ or ‘very satisfied’ with our digital services for the year.
This month, the percentage of customers who were either ‘satisfied’ or ‘very satisfied’ with our digital services was:
78.4%
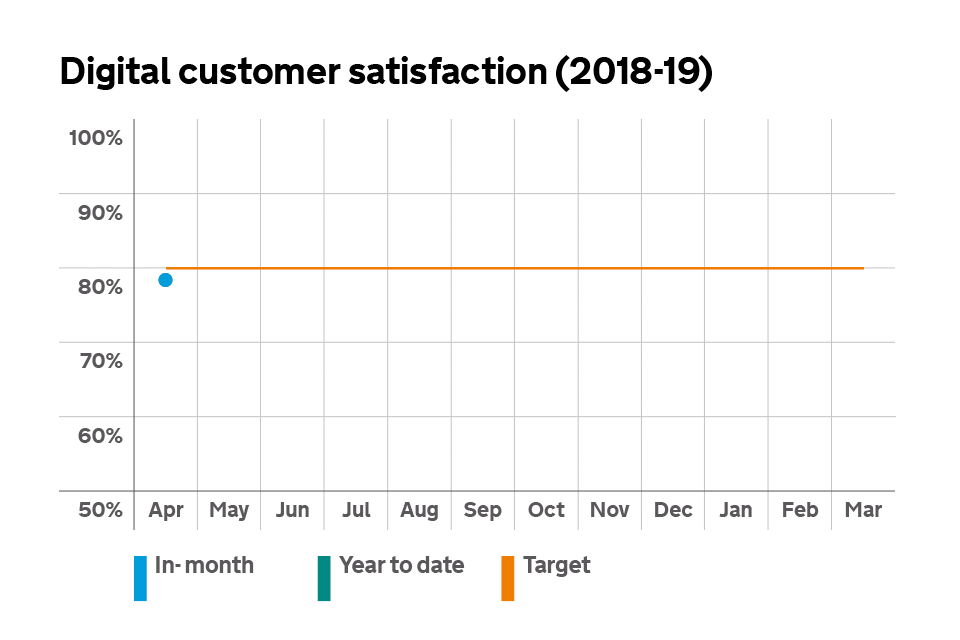
Graph showing customer satisfaction with digital services.
3. iForms
Our target for 2018 to 2019 is to turnaround 95% of iForms within 7 days for the year. We received more than 150,000 iForms this month and we turned around:
96.0% of customer iForms within 7 days
4. Phones
We aim for a consistent service across our phone helplines. We received more than 3.8 million calls this month.
Our targets for 2018 to 2019 are:
- to answer customer calls within an average of 5 minutes for the year
- to ensure that no more than 15% of customer calls are waiting more than 10 minutes to speak to an adviser for the year
4.1 Average speed of answering a call
This month, we answered our phones in an average of:
05 mins 09 seconds
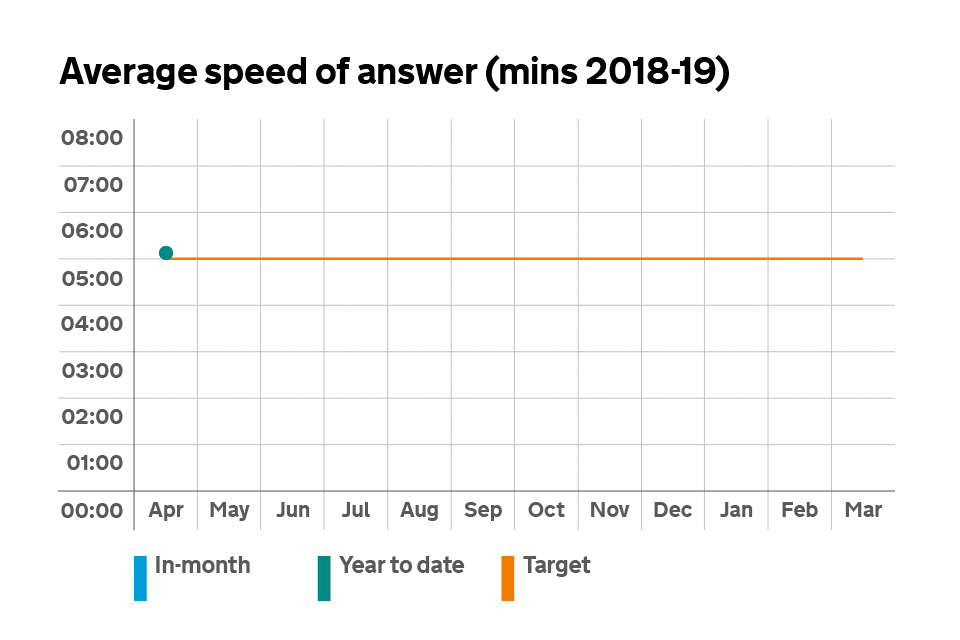
Graph showing the average speed of answer for our phone lines
4.2 Customer calls waiting more than 10 minutes to speak to an adviser
This month the percentage of customer calls that took more than 10 minutes to speak to an adviser:
17.1%
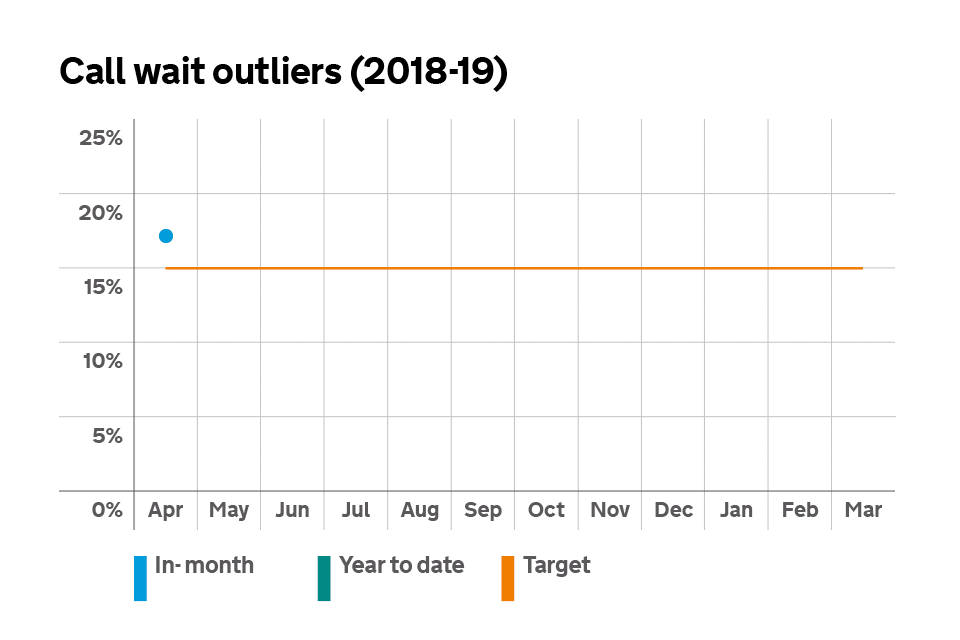
Graph showing the percentage of customer calls that waited more than 10 minutes before the call was answered.
5. Post
We received 980,000 items of post items this month for which customers require a response.
Our target for 2018 to 2019 is to turnaround 80% of post for the year within 15 days.
This month we turned around:
78.6% of customer post within 15 days
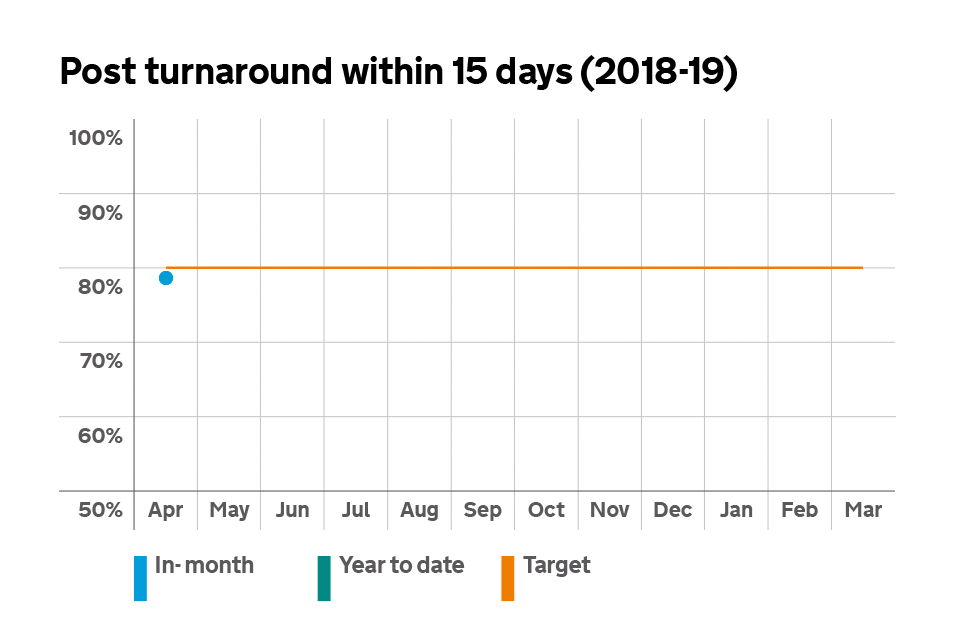
Graph showing percentage of post handled within 15 working days.
6. Tax credit and Child Benefit
Our targets for 2018 to 2019 are:
- to handle new tax credits and Child Benefit claims and changes of circumstances for UK customers within an average of 22 days for the year
- to handle new tax credits and Child Benefit claims and changes of circumstances for international customers within an average of 92 days for the year
We handled new claims and changes of circumstances for UK customers within an average of:
12.4 days
And we handled new claims and changes of circumstances for international customers within an average of:
72.9 days
7. Complaints
We want to get all our interactions with customers right first time, but if a customer is unhappy with our service, we aim to resolve their complaint quickly and fairly.
Read more detailed guidance on how we handle and resolve complaints.
Definitions:
- a ‘Tier 1 complaint’ is when a customer complains and we aim to resolve their case at this stage
- a ‘Tier 2 complaint’ is when a customer is dissatisfied with our decision on their initial complaint (Tier 1) and they have asked us to look at their concerns again
- ‘fully upheld’ means we agree with the main part of a customer’s complaint
- ‘partially upheld’ means we agree with some, but not all of, a customer’s complaint
- ‘not upheld’ means we don’t agree with a customer’s complaint
7.1 Tier 1 complaints
We received 6,551 Tier 1 complaints this month.
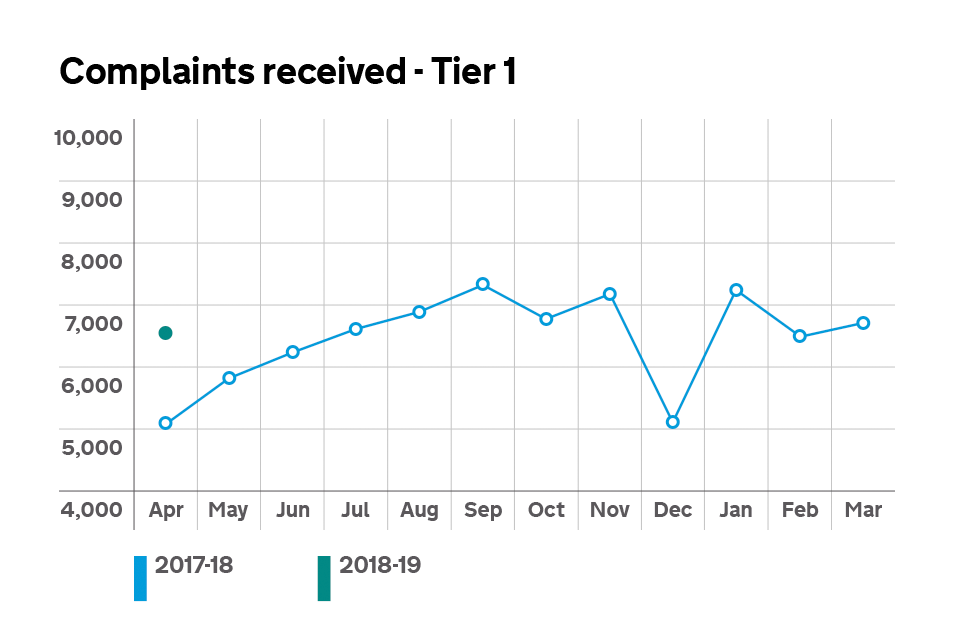
Graph showing the number of Tier 1 complaints received.
Note:
complaints are not always logged on our live system during the month they are received and the numbers can, therefore, be revised upwards for subsequent monthly reports. The current month will be subject to greatest revision.
Tier 1 complaints cleared
| Apr | May | Jun | Jul | Aug | Sep | Oct | Nov | Dec | Jan | Feb | Mar | |
|---|---|---|---|---|---|---|---|---|---|---|---|---|
| Tier 1 complaints fully upheld | 36.3% | |||||||||||
| Tier 1 complaints partially upheld | 15.8% | |||||||||||
| Tier 1 complaints not upheld | 47.9% |
Note
Due to rounding up or down, these figures may not add up to 100%.
7.2 Tier 2 complaints
We received 425 Tier 2 complaints this month.
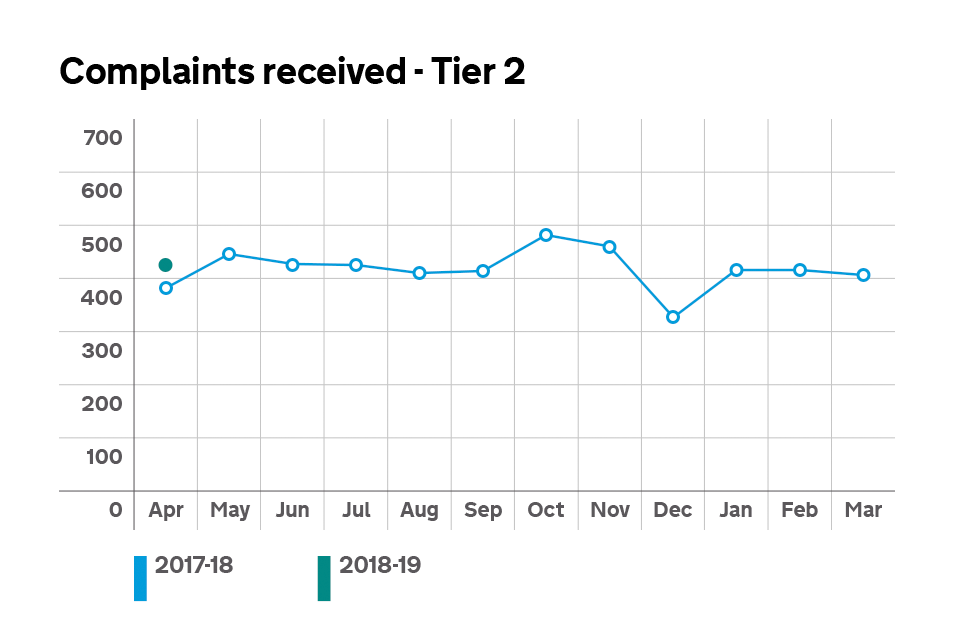
Graph showing the number of Tier 2 complaints received.
Note
complaints are not always logged on our live system during the month they are received and the numbers can, therefore, be revised upwards for subsequent monthly reports. The current month will be subject to greatest revision.
Tier 2 complaints cleared
| Apr | May | Jun | Jul | Aug | Sep | Oct | Nov | Dec | Jan | Feb | Mar | |
|---|---|---|---|---|---|---|---|---|---|---|---|---|
| Tier 2 complaints fully upheld | 17.0% | |||||||||||
| Tier 2 complaints partially upheld | 21.3% | |||||||||||
| Tier 2 complaints not upheld | 61.7% |
Note
Due to rounding up or down, these figures may not add up to 100%.