Figures to December 2017 (published 25 January 2018)
Updated 22 February 2018

© Crown copyright 2018
This publication is licensed under the terms of the Open Government Licence v3.0 except where otherwise stated. To view this licence, visit nationalarchives.gov.uk/doc/open-government-licence/version/3 or write to the Information Policy Team, The National Archives, Kew, London TW9 4DU, or email: psi@nationalarchives.gov.uk.
Where we have identified any third party copyright information you will need to obtain permission from the copyright holders concerned.
This publication is available at https://www.gov.uk/government/statistics/historical-statistics-notices-on-uk-milk-prices-and-composition-of-milk-2017/figures-to-december-2017-published-january-2018
1. Key messages
-
This release shows the latest information on average farm-gate milk prices, volumes and the butterfat and protein content of UK produced milk.
-
The UK average farm-gate milk price for December 2017 is 31.66 pence per litre (ppl). This represents a 0.9% (0.28 ppl) decrease on November 2017, 21% (5.44 ppl) higher than the same month last year.
1.1 United Kingdom farm-gate milk price (pence per litre)
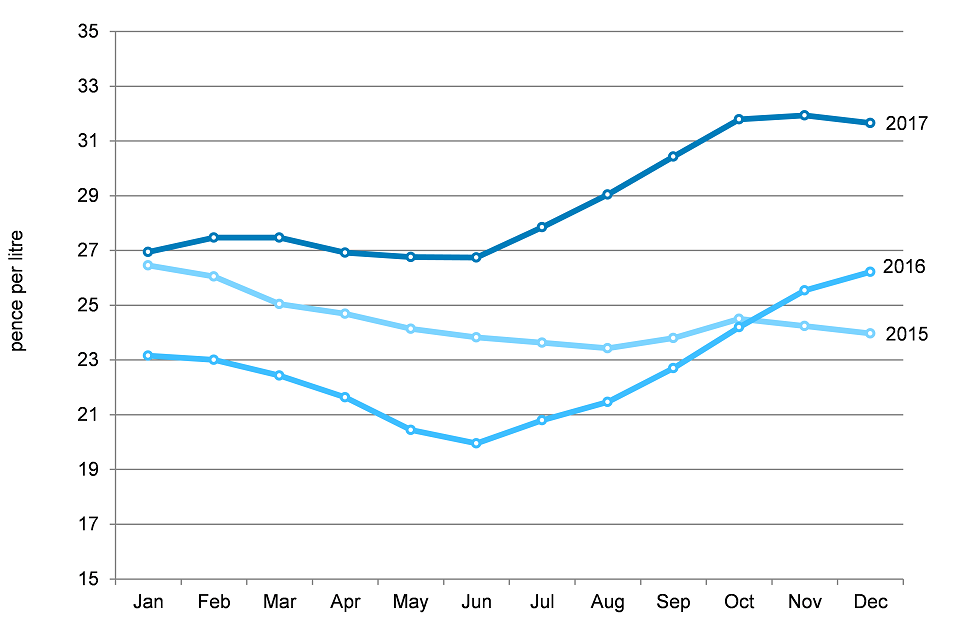
United Kingdom farm-gate milk price (pence per litre) to December 2017
1.2 Commentary
Recent years have shown increased production between February and May in line with the spring flush, which brings increased volumes followed by falls in production through to September and then an increase in October. December volumes increased following seasonal trends to 1212 million litres, a rise of 3.6% on the previous month.
1.3 United Kingdom wholesale milk production (million litres)
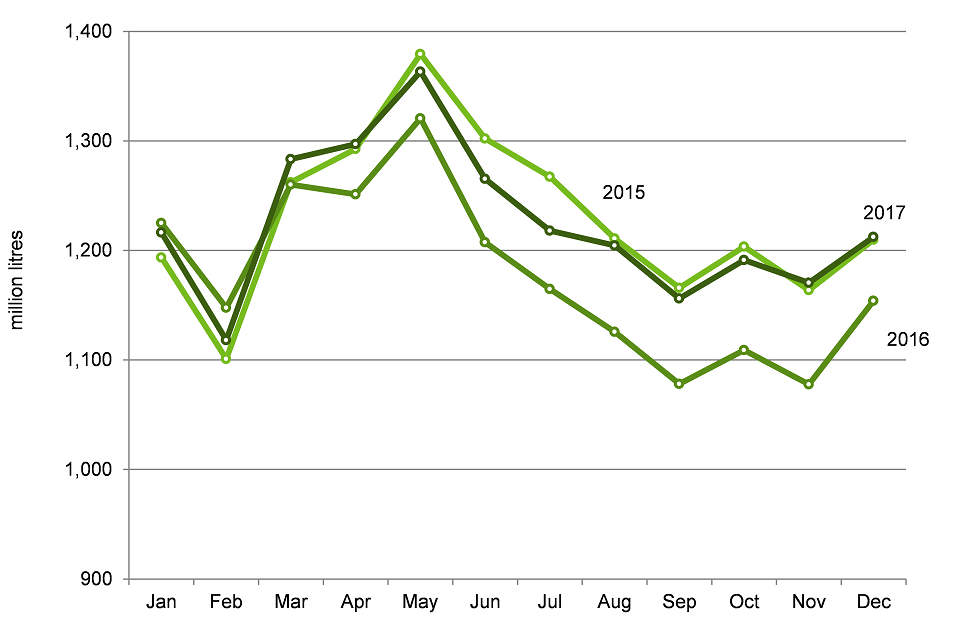
United Kingdom wholesale milk production (million litres) to December 2017
| 2013 | 2014 | 2015 | 2016 | 2017 | |
|---|---|---|---|---|---|
| Jan | 1059.00 | 1179.40 | 1193.60 | 1225.23 | 1216.50 |
| Feb | 978.10 | 1099.20 | 1101.10 | 1147.73 | 1118.26 |
| Mar | 1111.60 | 1256.90 | 1262.30 | 1260.12 | 1283.54 |
| Apr | 1111.90 | 1279.10 | 1292.85 | 1251.33 | 1297.17 |
| May | 1234.10 | 1333.40 | 1379.52 | 1320.76 | 1363.44 |
| Jun | 1177.40 | 1240.70 | 1302.23 | 1207.65 | 1265.53 |
| Jul | 1143.60 | 1225.20 | 1267.44 | 1164.94 | 1218.22 |
| Aug | 1115.70 | 1177.80 | 1211.00 | 1125.83 | 1204.58 |
| Sep | 1062.70 | 1147.30 | 1165.86 | 1078.24 | 1156.29 |
| Oct | 1088.20 | 1156.70 | 1203.60 | 1109.08 | 1191.38 |
| Nov | 1066.90 | 1120.40 | 1163.92 | 1078.84 | 1170.63 |
| Dec | 1143.50 | 1156.40 | 1209.82 | 1154.06 | 1212.49 |
Source: Defra statistics from April 2015: Rural Payments Agency milk quota data to March 2015.
1.4 United Kingdom farm-gate milk price
Table 1.5 shows the monthly average farm gate milk prices for the last 13 months, along with historical annual averages (at actual prices). Chart 1.1 shows monthly comparisons between years. The full time series is available on the website at UK milk prices and composition of milk. The annual average price of milk in 2017 was 28.70 ppl up 27% on 2016.
1.5 United Kingdom farm-gate milk price
| Farm gate milk prices | |||
|---|---|---|---|
| Annual | 2012 | 28.03 | |
| 2013 | 31.63 | ||
| 2014 | 31.59 | ||
| 2015 | 24.46 | ||
| 2016 | 22.57 | ||
| 2017 | 28.70 | ||
| Monthly | 2016 | Dec | 26.22 |
| 2017 | Jan | 26.95 | |
| Feb | 27.47 | ||
| Mar | 27.48 | ||
| Apr | 26.92 | ||
| May | 26.76 | ||
| Jun | 26.75 | ||
| Jul | 27.85 | ||
| Aug | 29.04 | ||
| Sep | 30.43 | ||
| Oct | 31.80 | ||
| Nov | 31.94 | ||
| Dec | 31.66 |
Latest months figures are provisional.
2. Retrospective payments
Some companies make retrospective bonus payments. We do not reflect these payments in the monthly milk price figures. The annual average price for farm-gate milk in 2016, including retrospective payments, is 22.74 ppl, which is 7.8% lower than the 24.66 ppl (including retrospective payments) farmers received in 2015. (Bonus data for 2017 production is not available yet).
A retrospective payment is when a company makes a payment to a farmer that is outside the normal contract price they receive and is generally paid on prior production, for example profit sharing.
3. Composition of milk in the United Kingdom
Table 3.1 shows the average butterfat and protein content of milk. Butterfat content figures prior to April 2015 came from published RPA figures and we present them here for reference only. Protein (and from April 2015, butterfat) content figures are calculated from UK milk survey data.
There is a seasonality effect on the butterfat content levels. This is due to cattle being put out to grass as the weather improves early in the year and then brought in for the winter. December’s butterfat content levels have increased 0.3% on November at 4.19% and are unchanged on December 2016.
3.1 Average butterfat and protein content of United Kingdom produced milk
| Butterfat % | 2015 | 2016 | 2017 | Protein % | 2015 | 2016 | 2017 |
|---|---|---|---|---|---|---|---|
| Jan | 4.07 | 4.15 | 4.12 | 3.28 | 3.28 | 3.28 | |
| Feb | 4.09 | 4.18 | 4.13 | 3.27 | 3.28 | 3.27 | |
| Mar | 4.10 | 4.20 | 4.12 | 3.28 | 3.29 | 3.26 | |
| Apr | 4.02 | 4.16 | 4.06 | 3.29 | 3.27 | 3.29 | |
| May | 3.91 | 3.99 | 3.95 | 3.31 | 3.28 | 3.29 | |
| Jun | 3.90 | 3.94 | 3.93 | 3.30 | 3.23 | 3.24 | |
| Jul | 3.83 | 3.94 | 3.96 | 3.31 | 3.22 | 3.24 | |
| Aug | 3.99 | 3.98 | 4.03 | 3.31 | 3.25 | 3.30 | |
| Sep | 4.03 | 4.09 | 4.12 | 3.44 | 3.32 | 3.36 | |
| Oct | 4.12 | 4.18 | 4.17 | 3.41 | 3.38 | 3.36 | |
| Nov | 4.15 | 4.25 | 4.17 | 3.36 | 3.39 | 3.36 | |
| Dec | 4.13 | 4.19 | 4.19 | 3.32 | 3.36 | 3.34 | |
| Average | 4.03 | 4.10 | 4.08 | 3.32 | 3.29 | 3.30 |
Latest months figures are provisional. Source: Defra statistics
4. Data users, methodology, notes and revisions policy
4.1 Data users
Users of the milk prices data include the EU Commission where the milk price statistics are required monthly under Regulation no. 479/2010 Article 2 (3)(a). Detailed information on this legislation and successive amendments are available at European Commission legislation. European level statistics on the milk industry are available at European Commission statistics.
The milk price statistics accompany another Defra monthly publication on milk utilisation by dairies and provides more detailed statistics on the volumes of raw milk which are processed into other products e.g. liquid milk, butter, cheese etc. This data, alongside the milk prices, gives a comprehensive overview of the UK milk market and is used heavily by the dairy industry, in particular the division of the Agriculture and Horticulture Development Board (AHDB) known as DairyCo (who represent milk producers) and Dairy UK (who represent milk processors). DairyCo consider the price and utilisation statistics vital for assessing market trends and to carry out further analysis on how changing prices affect the sector. Milk utilisation data provides insight into market characteristics and to monitor where milk is being used for domestic production. It provides insight to how production of products (such as butter, cheese etc.) changes in response to changes in global demand and market conditions.
The information in this notice is also used by the UK government as evidence for assessing market conditions and evaluating agricultural policy. Other users include academia and the general public.
4.2 Methodology
-
Farm gate milk prices: Defra runs a compulsory monthly survey of dairies in England and Wales to collect information on the volume, value, protein and butterfat content of milk purchased from farms in England and Wales. All major dairies purchasing over 2 million litres of milk a year (34 in England and Wales) take part in the survey.
-
Similar surveys are run by the Rural & Environment Science and Analytical Service (RESAS) for Scotland and the Department of Agriculture, Environment and Rural Affairs (DAERA)for Northern Ireland. Scottish milk price and production statistics are available in the Economic Report on Scottish Agriculture (Section 5.25). This website also contains contact details and more information. Data from Northern Ireland is also available.
-
UK average prices are calculated using the weighted results from the Defra, RESAS and DAERA surveys.
-
Quarterly surveys of dairies that purchase less than 2 million litres a year are used to estimate the volume of milk that is not accounted for within the monthly survey. This information is used to raise the monthly milk deliveries to a national level.
-
The published farm gate prices are weighted according to the volume of milk purchased by dairies. The averages are strongly influenced by the larger milk purchasers, and smaller purchasers have little influence on the UK weighted average. The farm gate price is the average price paid to producers, net of delivery charges. No deduction is made for superlevy. Some purchasers pay bonuses retrospectively to producers, these payments are used to calculate an annual average milk price including bonuses but are excluded from the monthly figures. An annual average milk price is also calculated excluding the retrospective bonus payments/
-
Composition of milk: The Rural Payment Agency no longer collects information on the butterfat or protein content of milk delivered to dairies (previously collected under the milk quota regulations). This information is now collected by Defra, DARD NI and RESAS from the milk prices surveys to obtain a UK average. In the same way as for the average prices, the average butterfat and protein contents are weighted according to the volume of milk purchased.
-
The data are subject to a variety of validation checks which identify inconsistencies in the data. All data are cleaned prior to publication in discussion with the survey respondents.
-
From February 2017, we are reporting on monthly milk prices excluding any retrospective bonus payments. We are still capturing these retrospective bonus payments and we use these to produce an annual average price including bonus payments. In the process of calculating the new price without retrospective bonus payments improvements were applied to the weightings used to calculate the milk price. The result of the new weighting is a change to the previously published milk price data back to February 2014. As a result there will be some minor changes to previously published data for the period
4.3 Revisions policy
Figures in this notice are provisional and subject to revision. We will provide information about any revisions we make to previously published information in this statistics notice, and the associated datasets. Revisions could occur for various reasons, including:
-
If we have not received survey data from respondents we make an estimate based on their previous returns. These estimates are replaced with actual figures when they are received.
-
Survey respondents occasionally supply amended figures for previous periods.
-
Receipt of amended data from Scotland and Northern Ireland.
-
Payment of retrospective bonuses which affect the previously supplied price data.
The next update of this monthly notice is at 09:30 on 22nd February 2018.
Enquiries to: Julie Rumsey, Tel: +44 (0) 208 026 6306
email: julie.rumsey@defra.gsi.gov.uk
Defra, Rm 201,
Foss House,
Kings Pool,
1-2 Peasholme Green,
York,
YO1 7PX