Hepatitis C in the South East annual report 2025
Updated 8 October 2026
Applies to England

© Crown copyright 2026
This publication is licensed under the terms of the Open Government Licence v3.0 except where otherwise stated. To view this licence, visit nationalarchives.gov.uk/doc/open-government-licence/version/3 or write to the Information Policy Team, The National Archives, Kew, London TW9 4DU, or email: psi@nationalarchives.gov.uk.
Where we have identified any third party copyright information you will need to obtain permission from the copyright holders concerned.
This publication is available at https://www.gov.uk/government/publications/hepatitis-c-in-the-south-east-annual-reports/hepatitis-c-in-the-south-east-annual-report-2025
Introduction
Hepatitis C virus (HCV) is a bloodborne virus. Chronic infection can lead to liver cirrhosis, end-stage liver disease and liver cancer. Prevention and treatment efforts have been combined to combat HCV infection and progress towards elimination of HCV as a public health threat by 2030 (set out in the World Health Organization Global Health Sector Strategy on Viral Hepatitis). The National Strategic Group on Viral Hepatitis, a cross-agency expert advisory body supported by the UK Health Security Agency (UKHSA) provides strategic guidance on viral hepatitis in England, and supports progress toward achieving the World Health Organization (WHO) goal of HCV elimination.
UKHSA publishes a national Hepatitis C in England report which summarises England’s progress towards the WHO elimination targets for HCV infection. This regional spotlight report complements the ‘Hepatitis C in England’ report and presents more information on HCV disease surveillance, and trends in HCV diagnosis, testing and treatment in the South East UKHSA region with data up to end of 2024.
For more details about data sources, see Information on data sources.
Summary
Key findings for hepatitis C testing:
- there were 1,781 new laboratory reports of hepatitis C in residents of the South East UKHSA region, in 2024, representing a rate of 19.7 reports per 100,000 population.
- The number of new laboratory reports has decreased by 21.8% since 2023 and increased by 12.7% over the past 10 years
- in 2024, the number of positive laboratory reports by upper tier local authority of residence ranged from 12 in Windsor and Maidenhead to 219 in Kent. Rates were highest in Slough at 76.5 and lowest in Windsor and Maidenhead with 7.5
- in 2024, the number of laboratory reports in males was 938 (53% of reports) and in females was 467 (26%). Sex was unknown in 21% of cases
- in 2024, the highest number of laboratory reports was in males aged 45 to 54 and females aged 35 to 44
- there were 74,706 individuals tested for anti-HCV in sentinel laboratories in the South East UKHSA region in 2024, of whom 2.4% tested positive. The proportion positive was lower for tests referred from general practitioner (GP) surgeries, lower for tests from sexual health services, and higher for tests from drug services; the total number of tests conducted has likely increased since 2022 as a result of a new ‘opt-out’ bloodborne virus testing programme at selected emergency departments
Key finding for hepatitis C treatment pathway:
- of 8,064 individuals with chronic hepatitis C linked to specialist treatment services (via the NHSE Hepatitis C Patient Registry and Treatment Outcome System and/or NHSE’s Blueteq System), 7,832 started treatment within 90 days and 6,953 achieved an SVR, in the South East UKHSA region between 2015 and 2024
Key findings for HCV-related morbidity and mortality:
- there were 135 hospital admissions for individuals with a diagnosis code for hepatitis C-related end-stage liver disease or hepatitis C-related hepatocellular carcinoma in the South East UKHSA region in 2024; with an upper-bound estimate of up to 171 admissions. This was higher than in 2023 (hospital admissions: 130)
- there was a lower bound estimate of 28 registered deaths from hepatitis C-related end‑stage liver disease and/or hepatocellular carcinoma in the South East UKHSA region in 2024; with an upper‑bound estimate identified up to 53 deaths. This was similar to 2023 (lower bound estimated deaths: 29)
Trends in HCV testing and diagnosis in the general population and risk groups
New laboratory-confirmed diagnoses of hepatitis C
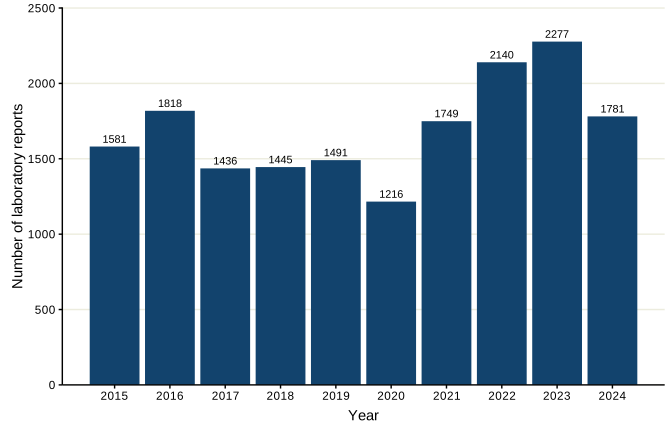
Figure 1. Number of new laboratory reports of hepatitis C, residents of South East UKHSA region, 2015 to 2024
Data source: Second Generation Surveillance System (SGSS). For more information, see Information on data sources.
Note 1: in 2022, a new bloodborne virus (BBV) testing programme was introduced in selected emergency department (ED) sites in areas of very high and high human immunodeficiency virus (HIV) diagnosed prevalence across England. This programme expanded to other areas of high HIV prevalence in the second phase of the implementation of this programme, starting in 2024, however, not all UKHSA regions had participating ED sites within their areas.
Figure 1 shows the number of new laboratory reports of hepatitis C in the South East from 2015 to 2024. In 2024, 1,781 new laboratory reports of HCV were reported in the South East. Numbers of laboratory reports of HCV in the South East were on an upward trend from 2020 to 2023 when they reached the highest level in the time period shown (2,277 laboratory reports) but decreased in 2024.
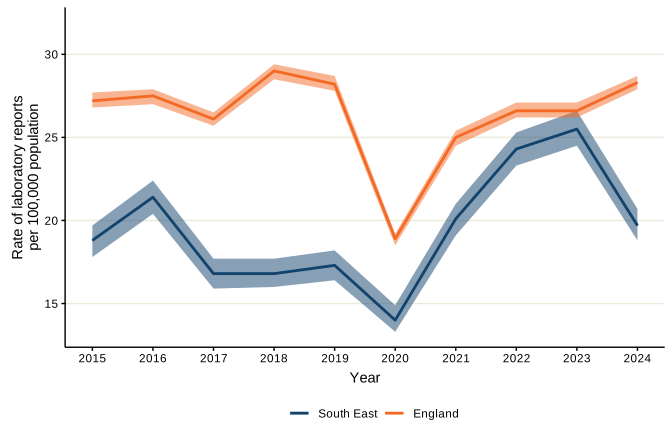
Figure 2. Rate per 100,000 population of new laboratory reports of hepatitis C, residents of South East UKHSA region and England, 2015 to 2024
Data sources: SGSS and Office for National Statistics (ONS) mid-year population estimates (MYE). For more information, see Information on data sources.
Note 2: the error bands represent 95% confidence intervals.
Figure 2 shows the trend in rate of new laboratory reports of hepatitis C in the South East per 100,000 residents compared to England overall. The rate of new laboratory reports of HCV in the South East in 2024 was 19.7 per 100,000 population, significantly lower than the national rate (28.3 per 100,000) and a significant decrease from the rate in 2023 (25.5 per 100,000). The rate increased between 2020 and 2023, having been on a general downward trend since 2016.
Table 1. Number and rate per 100,000 population of new laboratory reports of hepatitis C by UKHSA region of residence and England, 2015 to 2024
| Area | 2015 | 2016 | 2017 | 2018 | 2019 | 2020 | 2021 | 2022 | 2023 | 2024 | |
|---|---|---|---|---|---|---|---|---|---|---|---|
| East Midlands | Count | 963 | 1,079 | 1,124 | 1,341 | 1,345 | 709 | 971 | 1,027 | 870 | 1,345 |
| East Midlands | Rate | 20.6 | 22.8 | 23.5 | 27.8 | 27.8 | 14.6 | 19.9 | 20.8 | 17.4 | 26.6 |
| East of England | Count | 1,105 | 1,291 | 1,131 | 1,039 | 1,072 | 773 | 1,092 | 997 | 815 | 929 |
| East of England | Rate | 16.6 | 19.2 | 16.7 | 15.3 | 15.7 | 11.3 | 15.8 | 14.3 | 11.5 | 12.9 |
| London | Count | 4,026 | 4,177 | 3,432 | 3,146 | 2,634 | 2,438 | 2,702 | 3,533 | 4,093 | 4,552 |
| London | Rate | 46.5 | 47.8 | 39.1 | 35.6 | 29.6 | 27.5 | 30.7 | 39.8 | 45.5 | 50.1 |
| North East | Count | 216 | 228 | 390 | 750 | 967 | 700 | 903 | 1,071 | 777 | 888 |
| North East | Rate | 8.3 | 8.7 | 14.9 | 28.5 | 36.7 | 26.5 | 34.1 | 39.9 | 28.5 | 32.2 |
| North West | Count | 2,935 | 2,625 | 2,485 | 3,467 | 2,964 | 1,462 | 2,782 | 2,693 | 2,826 | 2,767 |
| North West | Rate | 40.9 | 36.3 | 34.2 | 47.4 | 40.3 | 19.8 | 37.5 | 35.8 | 37.0 | 35.8 |
| South East | Count | 1,581 | 1,818 | 1,436 | 1,445 | 1,491 | 1,216 | 1,749 | 2,140 | 2,277 | 1,781 |
| South East | Rate | 18.8 | 21.4 | 16.8 | 16.8 | 17.3 | 14.0 | 20.1 | 24.3 | 25.5 | 19.7 |
| South West | Count | 1,147 | 1,065 | 1,105 | 994 | 957 | 913 | 842 | 947 | 1,035 | 1,400 |
| South West | Rate | 21.0 | 19.3 | 19.8 | 17.7 | 17.0 | 16.1 | 14.7 | 16.4 | 17.8 | 23.8 |
| West Midlands | Count | 1,090 | 1,371 | 1,198 | 1,118 | 1,305 | 922 | 1,221 | 1,141 | 794 | 1,161 |
| West Midlands | Rate | 18.9 | 23.6 | 20.5 | 19.0 | 22.0 | 15.5 | 20.5 | 19.0 | 13.0 | 18.8 |
| Yorkshire and Humber | Count | 1,812 | 1,483 | 1,423 | 1,608 | 1,665 | 1,035 | 1,314 | 1,258 | 1,243 | 1,514 |
| Yorkshire and Humber | Rate | 33.7 | 27.4 | 26.2 | 29.5 | 30.5 | 18.9 | 24.0 | 22.7 | 22.2 | 26.7 |
| England | Count | 14,916 | 15,182 | 14,517 | 16,195 | 15,864 | 10,630 | 14,116 | 15,217 | 15,432 | 16,590 |
| England | Rate | 27.2 | 27.5 | 26.1 | 29.0 | 28.2 | 18.9 | 25.0 | 26.6 | 26.6 | 28.3 |
Data sources: SGSS and Office for National Statistics (ONS) mid-year population estimates (MYE). For more information, see Information on data sources.
Note 3: data was not available to assign a case to a UKHSA region in 253 cases, meaning that the sum of all regional cases may not equal the number of England cases.
Table 1 shows the numbers and rates per 100,000 population of new laboratory reports of hepatitis C for each region in England from 2015 to 2024. In 2024, London was the region with the highest number and rate of laboratory reports, followed by the North West.
Table 2. Number and rate per 100,000 population of new laboratory reports of hepatitis C by upper tier local authority of residence, 2015 to 2024
| Area | 2015 | 2016 | 2017 | 2018 | 2019 | 2020 | 2021 | 2022 | 2023 | 2024 | |
|---|---|---|---|---|---|---|---|---|---|---|---|
| Bracknell Forest | Count | 12 | 11 | 6 | 7 | 12 | 5 | 9 | 6 | 16 | 49 |
| Bracknell Forest | Rate | 10.1 | 9.2 | 5.0 | 5.8 | 9.9 | 4.1 | 7.2 | 4.7 | 12.4 | 37.5 |
| Brighton and Hove | Count | 242 | 294 | 191 | 220 | 139 | 149 | 280 | 233 | 179 | 162 |
| Brighton and Hove | Rate | 87.3 | 105.1 | 68.3 | 78.2 | 49.7 | 53.5 | 101.3 | 83.8 | 63.7 | 57.1 |
| Buckinghamshire | Count | 53 | 68 | 56 | 51 | 53 | 43 | 54 | 45 | 53 | 60 |
| Buckinghamshire | Rate | 10.0 | 12.7 | 10.4 | 9.4 | 9.7 | 7.8 | 9.7 | 8.0 | 9.3 | 10.4 |
| East Sussex | Count | 96 | 121 | 98 | 104 | 116 | 104 | 257 | 220 | 87 | 97 |
| East Sussex | Rate | 17.8 | 22.3 | 18.0 | 19.1 | 21.3 | 19.1 | 47.0 | 39.9 | 15.6 | 17.3 |
| Hampshire | Count | 206 | 250 | 248 | 149 | 129 | 61 | 60 | 104 | 182 | 199 |
| Hampshire | Rate | 15.2 | 18.3 | 18.1 | 10.8 | 9.3 | 4.4 | 4.3 | 7.3 | 12.7 | 13.8 |
| Isle of Wight | Count | 3 | 5 | 15 | 19 | 27 | 13 | 12 | 13 | 21 | 20 |
| Isle of Wight | Rate | 2.2 | 3.6 | 10.6 | 13.4 | 19.0 | 9.2 | 8.5 | 9.2 | 14.9 | 14.1 |
| Kent | Count | 272 | 273 | 149 | 179 | 208 | 204 | 246 | 221 | 160 | 219 |
| Kent | Rate | 17.9 | 17.8 | 9.7 | 11.5 | 13.3 | 13.0 | 15.6 | 13.9 | 9.9 | 13.4 |
| Medway | Count | 127 | 126 | 81 | 41 | 67 | 32 | 24 | 29 | 29 | 123 |
| Medway | Rate | 46.0 | 45.4 | 29.1 | 14.7 | 23.9 | 11.4 | 8.6 | 10.3 | 10.1 | 42.0 |
| Oxfordshire | Count | 101 | 129 | 134 | 120 | 127 | 79 | 56 | 40 | 87 | 151 |
| Oxfordshire | Rate | 14.8 | 18.7 | 19.2 | 17.1 | 17.9 | 11.1 | 7.7 | 5.4 | 11.6 | 19.8 |
| Portsmouth | Count | 47 | 41 | 51 | 46 | 52 | 28 | 17 | 36 | 17 | 32 |
| Portsmouth | Rate | 22.6 | 19.5 | 24.2 | 21.8 | 24.7 | 13.4 | 8.2 | 17.2 | 7.9 | 14.9 |
| Reading | Count | 26 | 21 | 50 | 45 | 61 | 52 | 171 | 100 | 79 | 87 |
| Reading | Rate | 15.4 | 12.2 | 28.9 | 25.8 | 35.0 | 29.9 | 98.6 | 56.8 | 43.9 | 47.6 |
| Slough | Count | 44 | 40 | 33 | 45 | 56 | 46 | 60 | 84 | 100 | 128 |
| Slough | Rate | 29.3 | 26.2 | 21.3 | 28.9 | 35.5 | 29.1 | 37.9 | 52.6 | 61.0 | 76.5 |
| Southampton | Count | 32 | 30 | 37 | 70 | 34 | 21 | 102 | 76 | 13 | 33 |
| Southampton | Rate | 13.1 | 12.1 | 14.8 | 27.9 | 13.6 | 8.4 | 41.2 | 30.1 | 5.1 | 12.7 |
| Surrey | Count | 167 | 235 | 168 | 157 | 261 | 138 | 126 | 146 | 157 | 188 |
| Surrey | Rate | 14.2 | 19.9 | 14.2 | 13.2 | 21.9 | 11.5 | 10.4 | 12.0 | 12.7 | 15.1 |
| West Berkshire | Count | 19 | 10 | 18 | 13 | 13 | 14 | 15 | 12 | 11 | 17 |
| West Berkshire | Rate | 12.0 | 6.2 | 11.2 | 8.1 | 8.1 | 8.7 | 9.3 | 7.4 | 6.7 | 10.3 |
| West Sussex | Count | 110 | 132 | 76 | 90 | 108 | 136 | 216 | 205 | 89 | 154 |
| West Sussex | Rate | 13.1 | 15.5 | 8.8 | 10.4 | 12.4 | 15.5 | 24.4 | 23.0 | 9.8 | 16.8 |
| Windsor and Maidenhead | Count | 13 | 24 | 14 | 10 | 17 | 82 | 33 | 21 | 18 | 12 |
| Windsor and Maidenhead | Rate | 8.7 | 15.8 | 9.2 | 6.5 | 11.0 | 53.2 | 21.4 | 13.5 | 11.5 | 7.5 |
| Wokingham | Count | 7 | 2 | 2 | 12 | 11 | 9 | 10 | 6 | 21 | 21 |
| Wokingham | Rate | 4.3 | 1.2 | 1.2 | 7.1 | 6.4 | 5.2 | 5.6 | 3.3 | 11.4 | 11.2 |
| UTLA unknown | Count | 4 | 6 | 9 | 67 | 0 | 0 | 1 | 543 | 958 | 29 |
| UTLA unknown | Rate | NA | NA | NA | NA | NA | NA | NA | NA | NA | NA |
| England | Count | 14,916 | 15,182 | 14,517 | 16,195 | 15,864 | 10,630 | 14,116 | 15,217 | 15,432 | 16,590 |
| England | Rate | 27.2 | 27.5 | 26.1 | 29.0 | 28.2 | 18.9 | 25.0 | 26.6 | 26.6 | 28.3 |
Data sources: SGSS and Office for National Statistics (ONS) mid-year population estimates (MYE). For more information, see Information on data sources.
Note 4: data was not available to assign a case to a UKHSA region in 253 cases, meaning that the sum of all regional cases may not equal the number of England cases. UTLA data was available for 90% of cases where region data was available in the South East.
Table 2 shows the numbers and rates per 100,000 population of new laboratory reports of hepatitis C in the South East by upper tier local authority (UTLA) from 2015 to 2024. In 2024, the UTLA with the highest rate of reports was Slough (76.5 per 100,000) followed by Brighton and Hove (57.1 per 100,000). Bracknell Forest, Medway and Reading also had rates above 30 per 100,000 population.
There were significant numbers of reports missing an assigned local authority in 2022 and 2023. This will have depressed calculated rates in some areas in those years.
Figure 3. Age group and sex of new laboratory reports of hepatitis C, residents of South East UKHSA region, 2024

Data source: Second Generation Surveillance System (SGSS). For more information, see Information on data sources.
Figure 3 shows the age-sex distribution of new laboratory reports of hepatitis C in the South East in 2024. The groups with the most cases were males aged 45 to 54 and males aged 35 to 44. In all age groups there were more cases in males than females, with males making up 67% of all reports where data on sex was available.
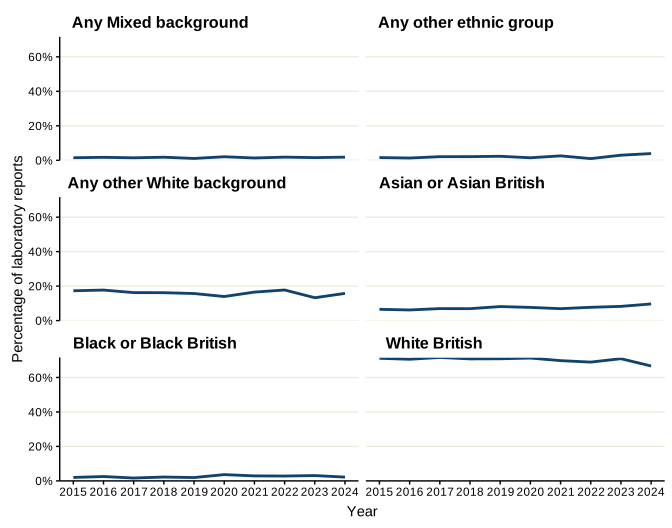
Figure 4. Ethnicity distribution of new laboratory reports of hepatitis C, residents of South East UKHSA region, 2015 to 2024
Data source: SGSS. For more information, see Information on data sources.
Note 5: this figure excludes cases of unknown ethnicity. (47% of reports had no ethnicity recorded).
Note 6: where the number of cases in an ethnic group in a given year is between 1 and 4 (inclusive), data has been suppressed for disclosure control. Suppressed values are shown as an asterisk (*) on the chart.
Figure 4 shows the proportion of new laboratory reports by ethnic group in the South East from 2015 to 2024. In 2024 the ethnic group with the highest percentage of hepatitis C reports was White British at 67%, followed by Any other White background (16%). Data on ethnicity was available for only 46% of laboratory reports in 2024.
HCV testing in the wider population
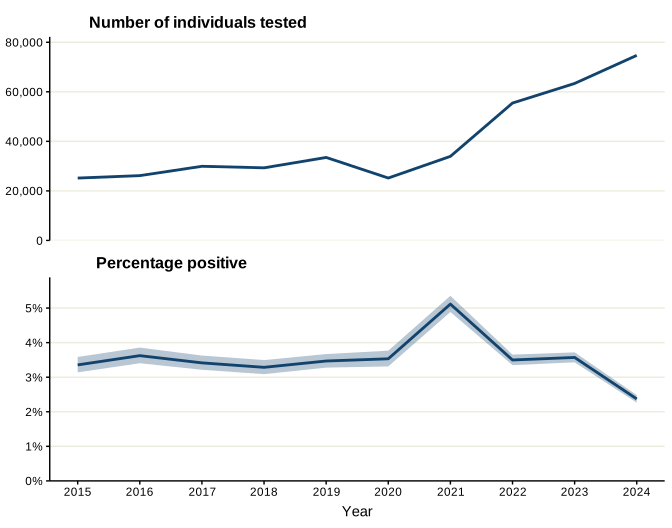
Figure 5. Number of individuals tested for anti-HCV by year and percentage positive in sentinel laboratories in South East UKHSA region, 2015 to 2024
Data source: SSBBV. For more information, see Information on data sources.
Note 7: trend data only includes testing laboratories that have consistently reported over time. Results from laboratories that report results on an inconsistent or temporary basis are excluded so as not to skew trends.
Note 8: in 2022, a new bloodborne virus (BBV) testing programme was introduced in selected emergency department (ED) sites in areas of very high and high human immunodeficiency virus (HIV) diagnosed prevalence across England. This programme expanded to other areas of high HIV prevalence in the second phase of the implementation of this programme, starting in 2024, however, not all UKHSA regions had participating ED sites within their areas.
Note 9: the error bands represent 95% confidence intervals.
Figure 5 shows the number of individuals tested for anti-HCV in sentinel laboratories in the South East, and the percentage positive from 2015 to 2024. In 2024, the number of individuals tested was 74,706. The number of individuals tested has been rising since 2020, when numbers fell to their lowest since 2015 likely due to the impact of the COVID-19 pandemic. The percentage positive was 2.4% in 2024. This has been on a downward trend since 2021.
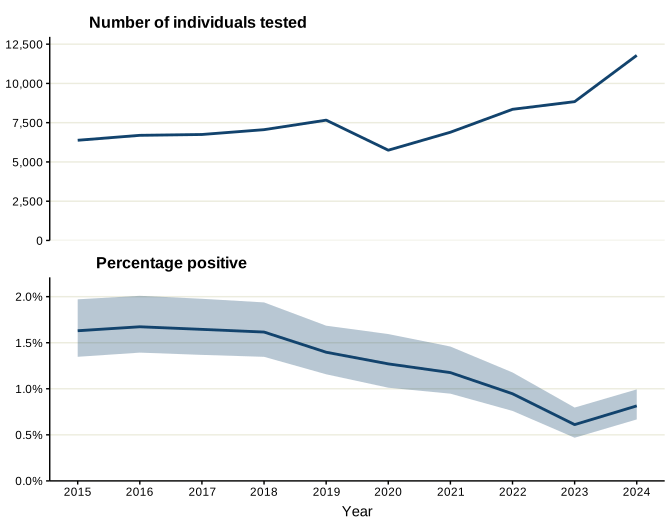
Figure 6. Number of individuals tested for anti-HCV by year and percentage positive, through GP surgeries, in sentinel laboratories in South East UKHSA region, 2015 to 2024
Data source: SSBBV. For more information, see Information on data sources.
Note 10: trend data only includes testing laboratories that have consistently reported over time. Results from laboratories that report results on an inconsistent or temporary basis are excluded so as not to skew trends.
Note 11: the error bands represent 95% confidence intervals.
Figure 6 shows the number of individuals tested for anti-HCV in sentinel laboratories through GP surgeries in the South East, and the percentage positive from 2015 to 2024. In 2024, the number of individuals tested was 11,787. The number of individuals tested has been rising since 2020, when numbers fell to their lowest since 2015 likely due to the impact of the COVID-19 pandemic. The percentage positive was 0.8% in 2024. This had been on a downward trend since 2018 but increased slightly in 2024.
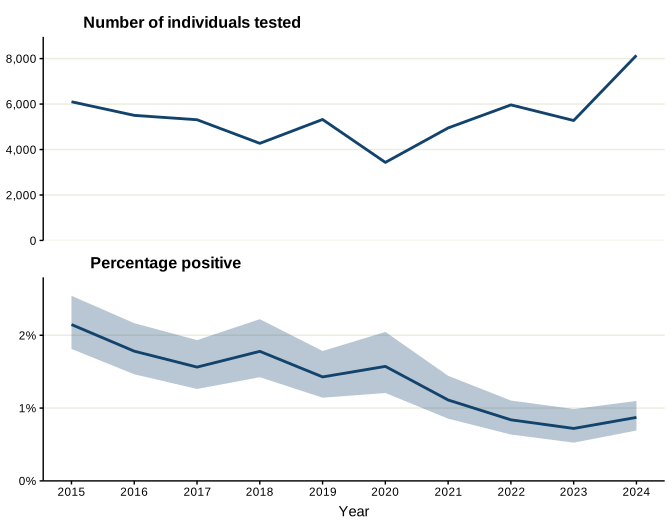
Figure 7. Number of individuals tested for anti-HCV by year and percentage positive, through sexual health services, in sentinel laboratories in South East UKHSA region, 2015 to 2024
Data source: SSBBV. For more information, see Information on data sources.
Note 12: trend data only includes testing laboratories that have consistently reported over time. Results from laboratories that report results on an inconsistent or temporary basis are excluded so as not to skew trends.
Note 13: the error bands represent 95% confidence intervals.
Figure 7 shows the number of individuals tested for anti-HCV in sentinel laboratories through sexual health services in the South East, and the percentage positive from 2015 to 2024. In 2024, the number of individuals tested was 8,143. The number of individuals tested has been on an upward trend since 2020. The percentage positive was 0.9% in 2024. This has been on a general downward trend since 2015 although it increased slightly in 2024 compared to 2023 (0.7%).
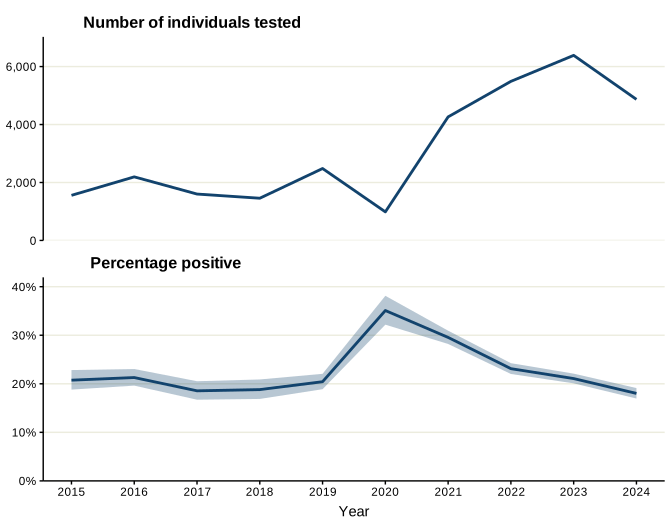
Figure 8. Number of individuals tested for anti-HCV by year and percentage positive, through drug services, in sentinel laboratories in South East UKHSA region, 2015 to 2024
Data source: SSBBV. For more information, see Information on data sources.
Note 14: trend data only includes testing laboratories that have consistently reported over time. Results from laboratories that report results on an inconsistent or temporary basis are excluded so as not to skew trends.
Note 15: the error bands represent 95% confidence intervals.
Figure 8 shows the number of individuals tested for anti-HCV in sentinel laboratories through drug services in the South East, and the percentage positive from 2015 to 2024. In 2024, the number of individuals tested was 4,868. The number of individuals tested increased between 2020 and 2023 but fell in 2024. The percentage positive was 18% in 2024. This has been on a downward trend since 2020 when positivity was the highest in the time period shown (35%).
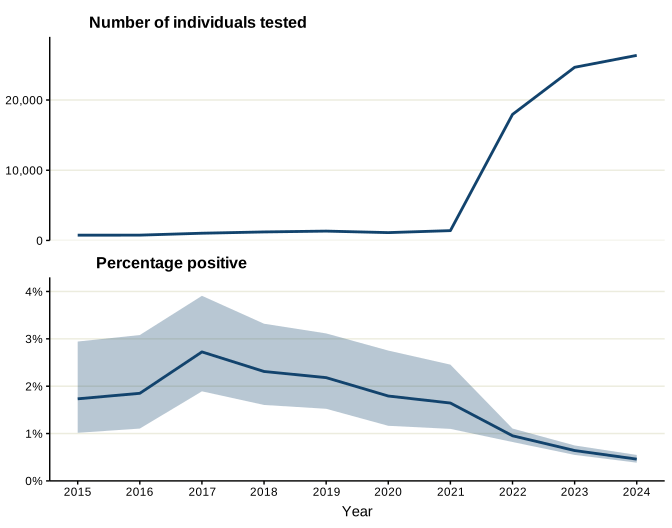
Figure 9. Number of individuals tested for anti-HCV by year and percentage positive, through emergency departments, in sentinel laboratories in South East UKHSA region, 2015 to 2024
Data source: SSBBV. For more information, see Information on data sources.
Note 16: trend data only includes testing laboratories that have consistently reported over time. Results from laboratories that report results on an inconsistent or temporary basis are excluded so as not to skew trends.
Note 17: in 2022, a new bloodborne virus (BBV) testing programme was introduced in selected emergency department (ED) sites in areas of very high and high human immunodeficiency virus (HIV) diagnosed prevalence across England. This programme expanded to other areas of high HIV prevalence in the second phase of the implementation of this programme, starting in 2024, however, not all UKHSA regions had participating ED sites within their areas.
Note 18: the error bands represent 95% confidence intervals.
Figure 9 shows the number of individuals tested for anti-HCV in sentinel laboratories through emergency departments in the South East, and the percentage positive from 2015 to 2024. In 2024, the number of individuals tested was 26,358. The number of individuals tested has been rising steeply since 2021, likely due to the implementation of opt-out blood-borne virus testing. The percentage positive was 0.5% in 2024. This has been on a downward trend since 2017, latterly, as one would expect with the roll-out of opt-out testing.
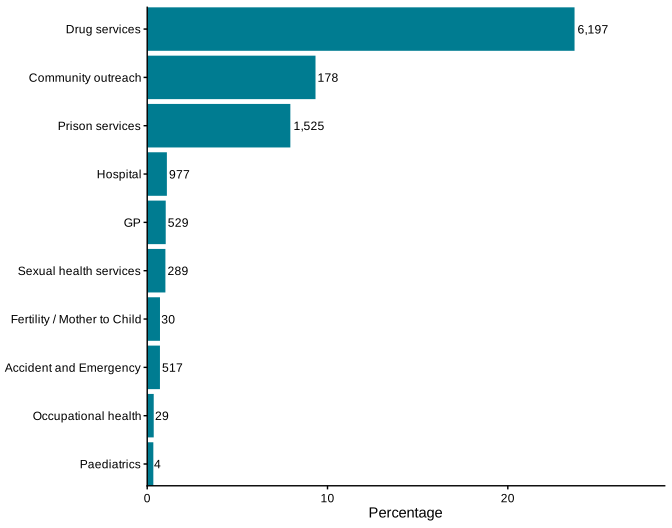
Figure 10. Percentage positivity for anti-HCV tests by setting or reason for test in sentinel laboratories 2020 to 2024
Data source: SSBBV. For more information, see Information on data sources.
Numbers next to bars indicate the number of positive cases in 2020 to 2024.
Note 19: percentage positive is calculated using the number of individuals tested per year per speciality. If an individual has multiple tests in a year across multiple specialities, then they will be counted once per speciality.
Figure 10 shows the percentage of tests positive in each speciality in sentinel laboratories in the South East from 2020 to 2024. The speciality with the highest positivity was drug services (23.7%) followed by community outreach (9.3%) and prison services (7.9%).
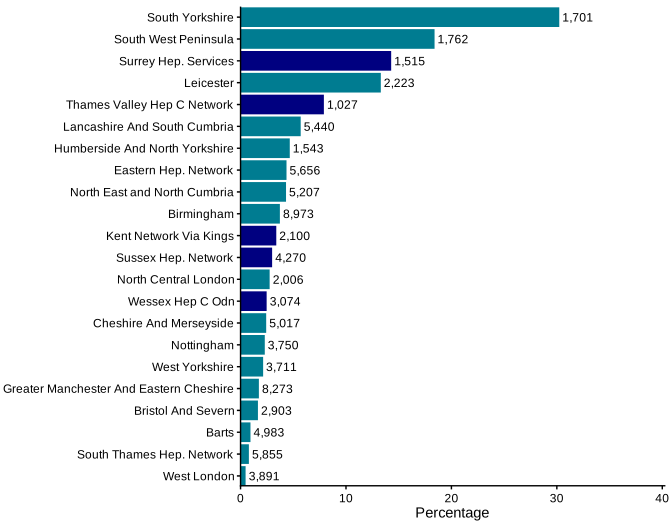
Figure 11. Percentage of individuals testing anti-HCV positive among those tested in sentinel laboratories, by operational delivery network (ODN), 2020 to 2024
Data source: SSBBV. For more information, see Information on data sources.
Numbers next to bars indicate the number of positive cases.
Note 20: ODN boundaries do not fully align with UKHSA regional boundaries, so not all South East residents may be captured within the highlighted bars. Bars are highlighted in the above chart based on the region containing the majority of their residents. Consequently the highlighted bars may include cases from outside the region, and some residents of this region may fall into ODNs / highlighted bars associated with other regions.
Figure 11 shows the percentage positive for anti-HCV among individuals tested in sentinel laboratories by operational delivery network (ODN) from 2020 to 2024. The ODN with the highest positivity in England was South Yorkshire (30.2%) followed by South West Peninsula (18.4%). The South East ODN with the highest positivity was Surrey Hepatitis Services (14.3%).
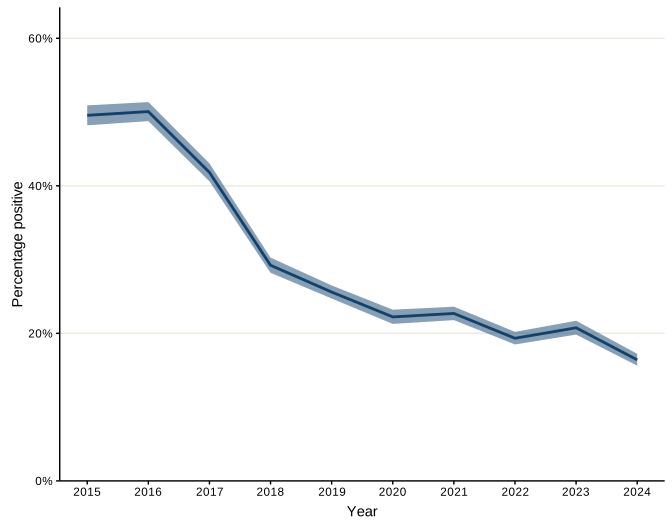
Figure 12. Percentage of individuals tested positive for HCV RNA in sentinel laboratories in South East UKHSA region, 2015 to 2024
Data source: SSBBV. For more information, see Information on data sources.
Figure 12 shows the trend in proportion of individuals testing positive for HCV RNA in sentinel laboratories in the South East from 2015 to 2024. In 2024 positivity was 16.4%, the lowest in the time period shown. Positivity has been on a downward trend since 2016.
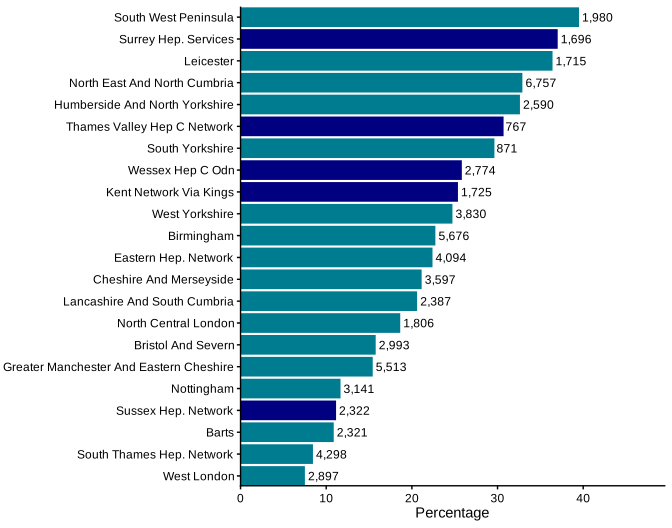
Figure 13. Percentage of individuals testing HCV RNA positive among those tested in sentinel laboratories, by operational delivery network (ODN), 2020 to 2024
Data source: SSBBV. For more information, see Information on data sources.
Numbers next to bars indicate the number of positive cases.
See note 20
Figure 13 shows the percentage of individuals who tested positive for HCV RNA among those tested in sentinel laboratories by operational delivery network (ODN) from 2020 to 2024. The ODN with the highest positivity in England was South West Peninsula (39.5%) followed by Surrey Hepatitis Services (37%) and Leicester (36.4%).
Testing and diagnosis in people who inject drugs (PWID)
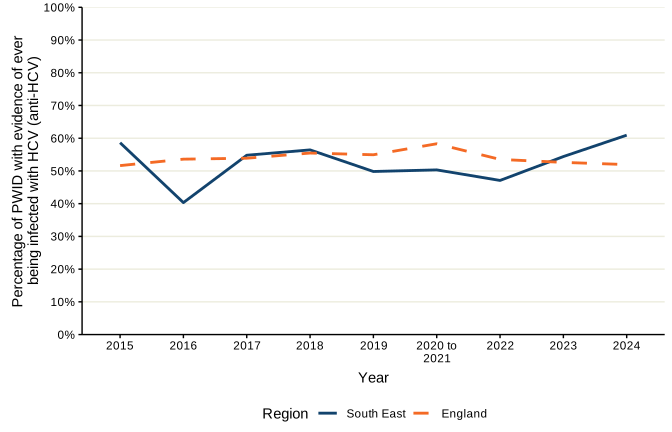
Figure 14. Percentage of Unlinked Anonymous Monitoring (UAM) Survey participants with evidence of ever being infected with HCV (anti-HCV), South East UKHSA region and England, 2015 to 2024
Data sources: Unlinked Anonymous Monitoring (UAM) survey. For more information, see Information on data sources.
Note 21: during 2020 and 2021, recruitment to the UAM Survey was impacted by the COVID-19 pandemic. As a result, there were changes in the geographic and demographic profile of people taking part. This should be considered when interpreting data for these years. Due to small numbers, data for 2020 and 2021 is combined.
Figure 14 shows data from the UAM survey on the proportion of people who inject drugs (PWID) with evidence of ever being infected with HCV (anti-HCV) in the South East, and England, between 2015 and 2024.
In 2024, the proportion of PWID with evidence of ever having been infected with HCV (anti-HCV) in the South East was 61%, higher than in 2023 (54%) and higher than that for England (52%). Between 2015 and 2024, the proportion fluctuated in the South East, with the highest level reported in 2024. In contrast, the proportion for England remained relatively stable over the same period.
Figure 15. Percentage of UAM survey participants ever infected with HCV who have chronic HCV infection, South East UKHSA region and England, 2015 to 2024

Data sources: UAM survey. For more information, see Information on data sources.
Note 22: during 2020 and 2021, recruitment to the UAM survey was impacted by the COVID-19 pandemic. As a result, there were changes in the geographic and demographic profile of people taking part. This should be considered when interpreting data for these years. Due to small numbers, data for 2020 and 2021 is combined.
Figure 15 shows data from the UAM survey on the prevalence of chronic HCV infection among people who inject drugs (PWID) in the South East and England between 2015 and 2024.
The prevalence of chronic HCV infection among PWID in the South East was 11% in 2024, lower than the previous year (2023: 14%) but higher than that for England (10%). Following a peak of 69% in 2016, chronic HCV prevalence in the South East has declined, broadly mirroring the trend observed for England.
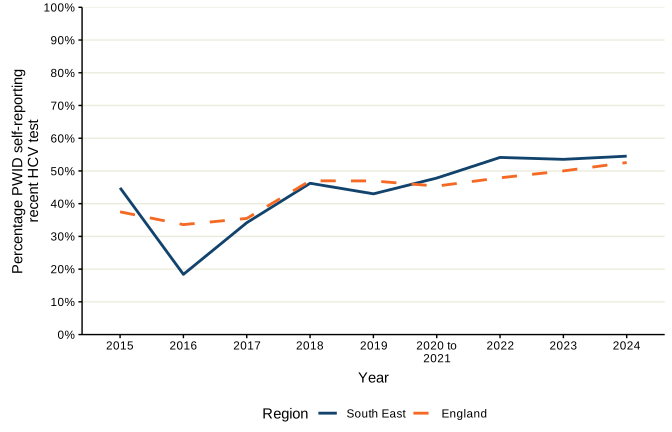
Figure 16. Percentage of UAM survey participants who self-reported being recently (current or previous year) tested for HCV, South East UKHSA region and England, 2015 to 2024
Data sources: UAM survey. For more information, see Information on data sources.
Note 23: during 2020 and 2021, recruitment to the UAM survey was impacted by the COVID-19 pandemic. As a result, there were changes in the geographic and demographic profile of people taking part. This should be considered when interpreting data for these years. Due to small numbers, data for 2020 and 2021 is combined. See Technical Notes for more details.
Figure 16 shows data from the UAM survey on the proportion of people who inject drugs who self-reported being recently (current or previous year) tested for HCV in the South East and England between 2015 and 2024.
In 2024, the proportion of PWID reporting a recent HCV test in the South East was 55%, a small increase compared to 2023 (54%) and slightly higher than that for England (53%). Overall, reported testing uptake in the South East increased between 2015 and 2024 in the South East and has been slightly above that reported for England since 2020 to 2021.
Hepatitis C treatment pathway
Reinfections in individuals initiating treatment
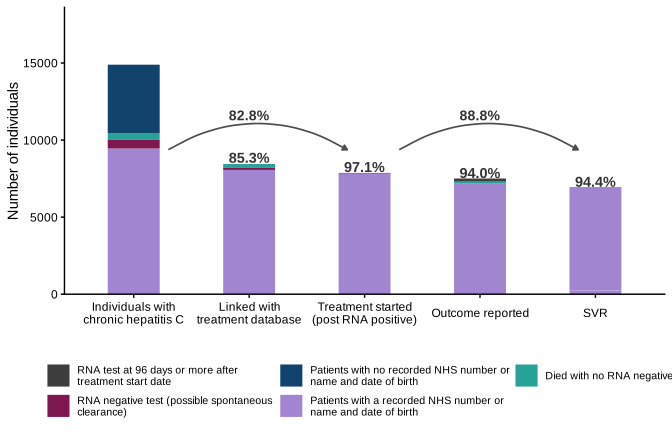
Figure 17. Treatment pathway in South East UKHSA region, 2015 to 2024
Data source: SSBBV, NHS England (NHSE) Hepatitis C Patient Registry and Treatment Outcome System, NHSE Blueteq System. For more information, see Information on data sources.
Note 24: in individuals testing hepatitis C virus RNA or core antigen positive with no linkage to the Hepatitis C Patient Registry and Treatment Outcome System or NHSE’s Blueteq System, there are no time restrictions on a subsequent RNA or core antigen negative test after the initial RNA or core antigen positive test. Therefore, these individuals may include those that have spontaneous clearance of their infection or individuals who have cleared infection as a result of treatment but were not linked to the NHSE Hepatitis C Patient Registry and Treatment Outcome System or NHSE’s Blueteq System.
Note 25: in the absence of a reported SVR as a treatment outcome in the NHSE Hepatitis C Patient Registry and Treatment Outcome System, an RNA or core antigen negative test recorded at 96 days or more after the treatment start date in SSBBV was used.
Definitions of the numerator and denominator for each metric shown in the treatment pathway are provided in Table 3 of the Technical Notes.
Figure 17 shows the hepatitis C treatment pathway in the South East between 2015 and 2024.
Between 2015 and 2024, 85.3% of individuals with chronic hepatitis C were linked to treatment, and of these, 97.1% started treatment. Overall treatment coverage was 82.8%, meeting the WHO elimination target for treatment coverage (≥80%). Treatment outcomes were available for 94.0% of individuals who started treatment, and among those with a reported outcome, 94.4% achieved SVR. Among all individuals who started treatment, 88.8% had evidence of SVR.
Treatment pathway by operational delivery network (ODN)
1) Kent Network via Kings ODN
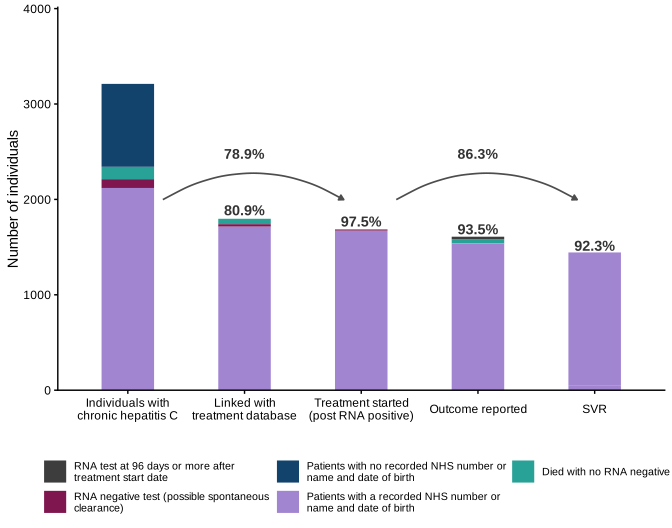
Figure 18. Treatment pathway by operational delivery network (ODN) in Kent Network via Kings ODN, 2015 to 2024
Data source: SSBBV, NHSE Hepatitis C Patient Registry and Treatment Outcome System, NHSE Blueteq System. For more information, see Information on data sources.
Note 26: in individuals testing hepatitis C virus RNA or core antigen positive with no linkage to the Hepatitis C Patient Registry and Treatment Outcome System or NHSE’s Blueteq System, there are no time restrictions on a subsequent RNA or core antigen negative test after the initial RNA or core antigen positive test. Therefore, these individuals may include those that have spontaneous clearance of their infection or individuals who have cleared infection as a result of treatment but were not linked to the NHSE Hepatitis C Patient Registry and Treatment Outcome System or NHSE’s Blueteq System.
Note 27: in the absence of a reported SVR as a treatment outcome in the NHSE Hepatitis C Patient Registry and Treatment Outcome System, an RNA or core antigen negative test recorded at 96 days or more after the treatment start date in SSBBV was used.
Note 28: ODN boundaries do not fully align with UKHSA regional boundaries, so not all South East residents may be captured in these ODN charts. ODN charts are presented within this report for the region containing the majority of their residents. Consequently, these charts may include cases from outside the region, and some South East residents may be in ODNs falling in other regions, and so included in other regions’ reports.
Definitions of the numerator and denominator for each metric shown in the treatment pathway are provided in Table 3 of the Technical Notes.
Figure 18 shows the hepatitis C treatment pathway for Kent Network via Kings Operational Delivery Network between 2015 and 2024.
Between 2015 and 2024, 80.9% of individuals with chronic hepatitis C were linked to treatment, and of these, 97.5% started treatment. Overall treatment coverage was 78.9%, below the WHO elimination target for treatment coverage (≥80%). Treatment outcomes were available for 93.5% of individuals who started treatment, and among those with a reported outcome, 92.3% achieved SVR. Among all individuals who started treatment, 86.3% had evidence of SVR.
2) Surrey Hepatitis Services ODN
Figure 19. Treatment pathway by operational delivery network (ODN) in Surrey Hepatitis Services ODN, 2015 to 2024
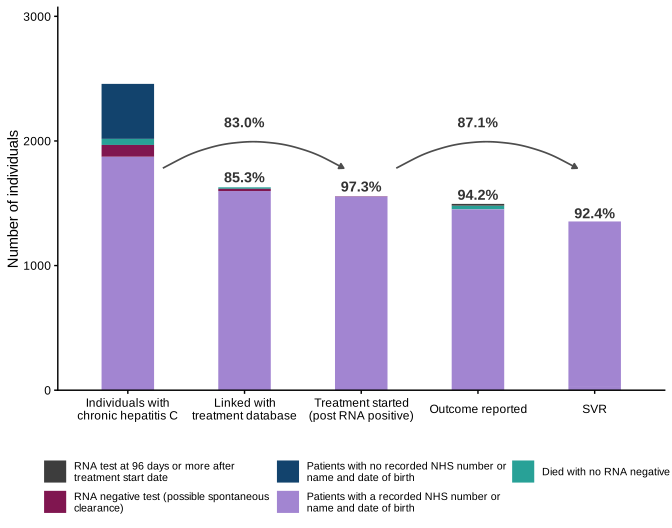
Data source and notes: See Figure 18
Figure 19 shows the hepatitis C treatment pathway for Surrey Hepatitis Services Operational Delivery Network between 2015 and 2024.
Between 2015 and 2024, 85.3% of individuals with chronic hepatitis C were linked to treatment, and of these, 97.3% started treatment. Overall treatment coverage was 83.0%, meeting the WHO elimination target for treatment coverage (≥80%). Treatment outcomes were available for 94.2% of individuals who started treatment, and among those with a reported outcome, 92.4% achieved SVR. Among all individuals who started treatment, 87.1% had evidence of SVR.
3) Sussex Hepatology Network ODN
Figure 20. Treatment pathway by operational delivery network (ODN) in Sussex Hepatology Network ODN, 2015 to 2024
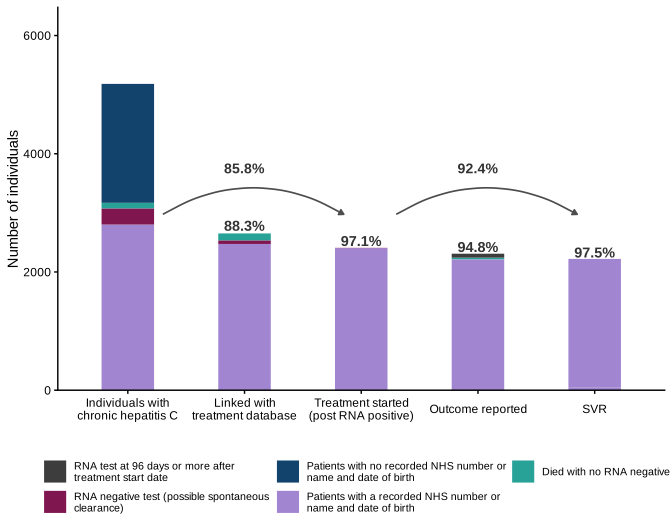
Data source and notes: see Figure 18.
Figure 20 shows the hepatitis C treatment pathway for Sussex Hepatology Operational Delivery Network between 2015 and 2024.
Between 2015 and 2024, 88.3% of individuals with chronic hepatitis C were linked to treatment, and of these, 97.1% started treatment. Overall treatment coverage was 85.8%, meeting the WHO elimination target for treatment coverage (≥80%). Treatment outcomes were available for 94.8% of individuals who started treatment, and among those with a reported outcome, 97.5% achieved SVR. Among all individuals who started treatment, 92.4% had evidence of SVR.
4) Thames Valley Hep C Network ODN
Figure 21. Treatment pathway by operational delivery network (ODN) in Thames Valley Hep C Network ODN, 2015 to 2024
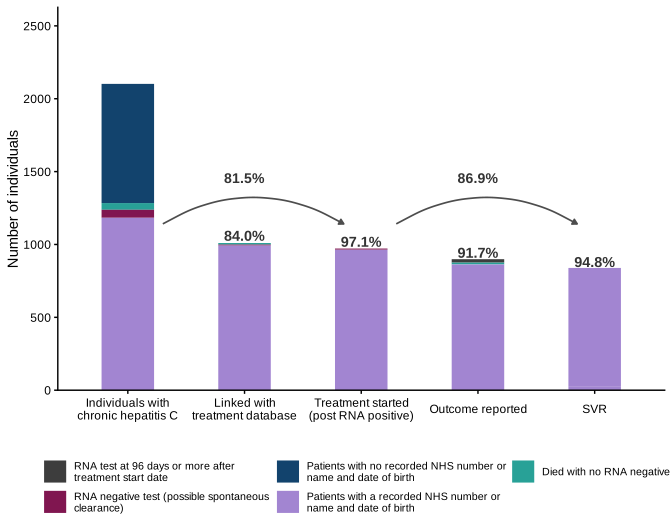
Data source and notes: see Figure 18.
Figure 21 shows the hepatitis C treatment pathway for Thames Valley Hep C Operational Delivery Network between 2015 and 2024.
Between 2015 and 2024, 84.0% of individuals with chronic hepatitis C were linked to treatment, and of these, 97.1% started treatment. Overall treatment coverage was 81.5%, meeting the WHO elimination target for treatment coverage (≥80%). Treatment outcomes were available for 91.7% of individuals who started treatment, and among those with a reported outcome, 94.8% achieved SVR. Among all individuals who started treatment, 86.9% had evidence of SVR.
5) Wessex Hep C ODN
Figure 22. Treatment pathway by operational delivery network (ODN) in Wessex Hep C ODN, 2015 to 2024
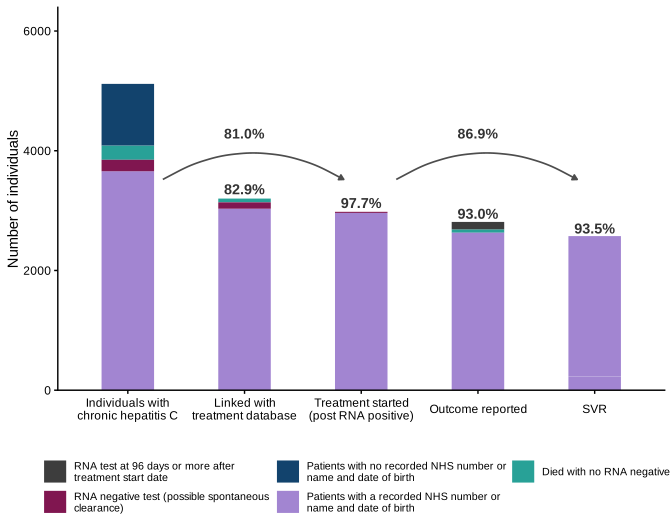
Data source and notes: see Figure 18.
Figure 22 shows the hepatitis C treatment pathway for Wessex Hep C Operational Delivery Network between 2015 and 2024.
Between 2015 and 2024, 82.9% of individuals with chronic hepatitis C were linked to treatment, and of these, 97.7% started treatment. Overall treatment coverage was 81.0%, meeting the WHO elimination target for treatment coverage (≥80%). Treatment outcomes were available for 93.0% of individuals who started treatment, and among those with a reported outcome, 93.5% achieved SVR. Among all individuals who started treatment, 86.9% had evidence of SVR.
Reinfections in individuals initiating treatment
For people who initiated treatment between 2015 and 2024 in London, the reinfection rate was 3.4 per 100 person-years (95% CI 3.1 to 3.8), which was lower than the England estimate (6.5 per 100 person-years, 95% CI 6.3 to 6.7). Among those who had injected drugs within the 3 years prior to treatment initiation, the reinfection rate was 4.8 per 100 person-years (95% CI 4.2 to 5.4), again lower than the England estimate (8.8 per 100 person-years, 95% CI 8.5 to 9.0). For individuals whose last injection was more than 3 years earlier, the rate was 2.9 per 100 person-years (95% CI 2.5 to 3.3), again lower than the England estimate (4.0 per 100 person-years, 95% CI 3.8 to 4.2). Among people with any history of imprisonment before starting treatment, the reinfection rate was 5.8 per 100 person-years (95% CI 4.8 to 6.9), also lower compared with England (9.4 per 100 person-years, 95% CI 9.0 to 9.7).
Monitoring HCV-related morbidity
Hospital admissions from HCV
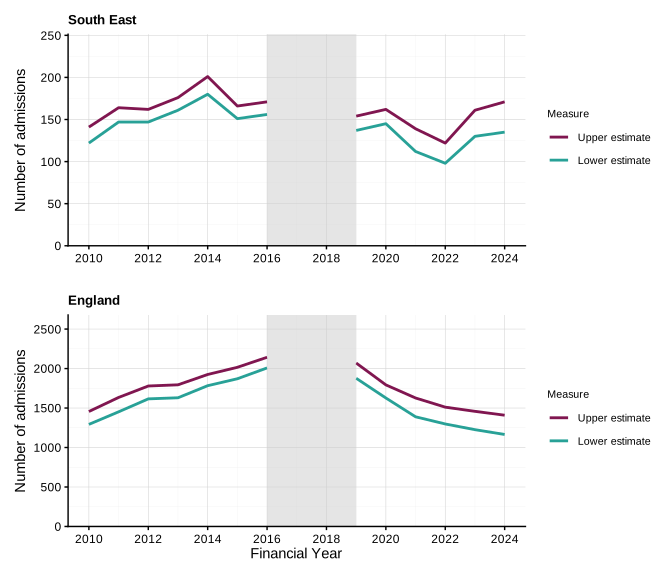
Figure 23. Number of first hospital admissions for hepatitis C-related end-stage liver disease (ESLD) and/or hepatocellular carcinoma (HCC), South East UKHSA region and England
Data source: Hospital Episode Statistics (HES), NHS England. Produced by the UK Health Security Agency. Copyright © 2025, reused with the permission of NHS England. All rights reserved. For more information, see Information on data sources.
Note 29: estimates of incidence of hepatitis C-related ESLD and/or HCC are not available for 2017 and 2018. This is due to an interruption in the supply of identifiers by NHS Trusts in tax year April 2017 to March 2018.
Note 30: data for 2024 is provisional and figures for previous years are subject to change as a result of late reporting and the associated de-duplication procedure.
Note 31: defined by codes or text entries for ascites, bleeding oesophageal varices, hepato-renal syndrome, hepatic encephalopathy, or hepatic failure.
Note 32: data based on HES as of December 2025.
Figure 23 shows the estimated number of first hospital admissions among South East residents with hepatitis C-related end-stage liver disease (ESLD) and/or hepatocellular carcinoma (HCC) between 2010 and 2024. Data for 2017 and 2018 are unavailable.
In 2024, the estimated number of first admissions for hepatitis C-related ESLD and/or HCC was between 135 and 171, slightly higher than the estimated range reported in 2023 (130 to 161). The estimated number of first admissions peaked in 2014 before declining until 2022 then rising again since, whereas in England overall admissions continued to fall.
Figure 24. Rate per 100,000 of first hospital admissions for hepatitis C-related end-stage liver disease (ESLD) and/or hepatocellular carcinoma (HCC), South East UKHSA region and England

Data source: Hospital Episode Statistics (HES), NHS England. Produced by the UK Health Security Agency. Copyright © 2025, reused with the permission of NHS England. All rights reserved. For more information, see Information on data sources.
Note 33: estimates of incidence of hepatitis C-related ESLD and/or HCC are not available for 2017 and 2018. This is due to an interruption in the supply of identifiers by NHS Trusts in tax year April 2017 to March 2018.
Note 34: data for 2024 is provisional and figures for previous years are subject to change as a result of late reporting and the associated de-duplication procedure.
Note 35: defined by codes or text entries for ascites, bleeding oesophageal varices, hepato-renal syndrome, hepatic encephalopathy, or hepatic failure.
Note 36: data based on HES as of December 2025.
Figure 24 shows the rate per 100,000 population of first hospital admissions for hepatitis C-related end-stage liver disease (ESLD) and/or hepatocellular carcinoma (HCC) among South East residents between 2010 and 2024. Data for 2017 and 2018 are unavailable.
In 2024, the estimated rate of first hospital admissions for hepatitis C-related ESLD and/or HCC was between 1.49 and 1.89 per 100,000 population, slightly higher than the estimated rate range reported in 2023 (1.46 to 1.80). The estimated rate in the South East has been significantly lower than England overall during this period but the difference has narrowed over recent years as the England rate has declined.
HCV-related mortality
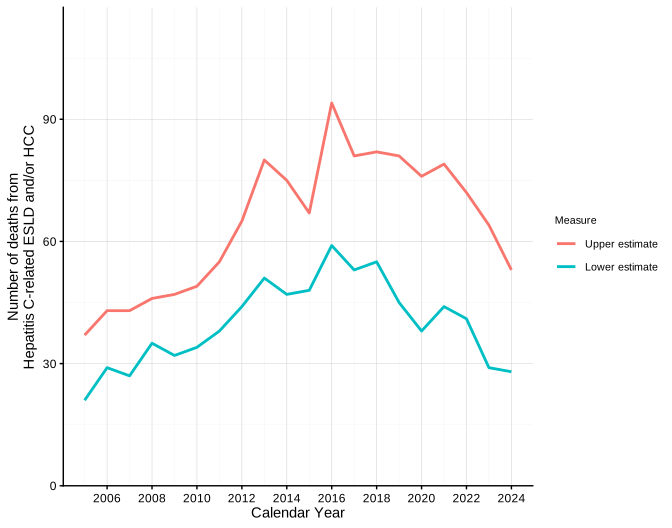
Figure 25. Number of deaths from hepatitis C-related end-stage liver disease (ESLD) and/or hepatocellular carcinoma (HCC), South East UKHSA region, 2005 to 2024
Data source: ONS Mortality and ONS MYE. For more information, see Information on data sources.
Figure 25 shows the estimated number of deaths from hepatitis C-related end-stage liver disease (ESLD) and/or hepatocellular carcinoma (HCC) among South East residents between 2005 and 2024.
In 2024, the estimated number of deaths was between 28 and 53, lower than the estimated range in 2023 (29 to 64). Overall, the estimated number of deaths peaked in 2016 before declining significantly since.
Figure 26. Mortality rate per 100,000 population for hepatitis C-related end-stage liver disease (ESLD) and/or hepatocellular carcinoma (HCC) by UKHSA region, 2020 to 2024

Data source: ONS Mortality and ONS MYE. For more information, see Information on data sources.
Figure 26 shows the mortality rate per 100,000 population for hepatitis C-related end-stage liver disease (ESLD) and/or hepatocellular carcinoma (HCC) mapped by region between 2020 and 2024.
The South East mortality rate was 1.16 per 100,000 population, lower than that for England overall (1.31 per 100,000 population). Among the regions, the South East had the fourth highest mortality rate, with rates ranging from 0.82 per 100,000 population in the North East to 1.94 per 100,000 population in London.
Prevention of infection by harm reduction
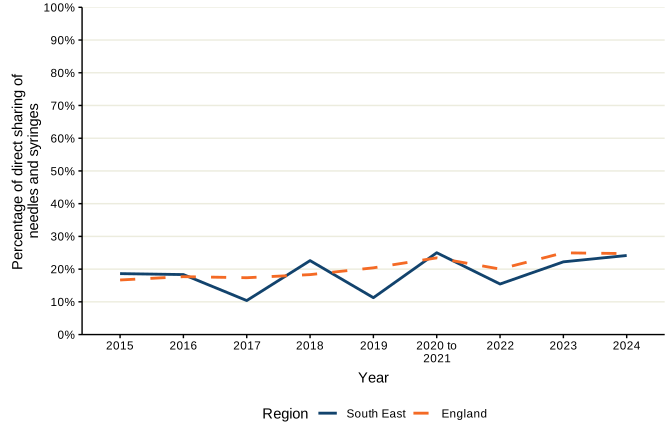
Figure 27. Reported level of direct sharing of needles/syringes among people who inject drugs (PWID), in the preceding 4 weeks, South East UKHSA region and England, 2015 to 2024
Data sources: UAM survey. For more information, see Information on data sources.
Note 37: during 2020 and 2021, recruitment to the UAM survey was impacted by the COVID-19 pandemic. As a result, there were changes in the geographic and demographic profile of people taking part. This should be considered when interpreting data for these years. Due to small numbers, data for 2020 and 2021 is combined.
Figure 27 shows the reported level of direct sharing of needles and/or syringes among people who inject drugs (PWID) in the preceding 4 weeks in the South East and England between 2015 and 2024.
Direct sharing refers to self-reported sharing of needles and syringes among people who had injected in the 4 weeks preceding survey participation and Indirect sharing refers to sharing of injecting equipment other than needles and syringes.
In the South East, the reported level of direct needle and/or syringe sharing among PWID was 24.2% in 2024, a small increase from 22.2% in 2023 and similar to that for England (24.8%). Following a low of 10.4% in 2017, reported direct sharing in the South East has increased and has remained broadly comparable with that for England.
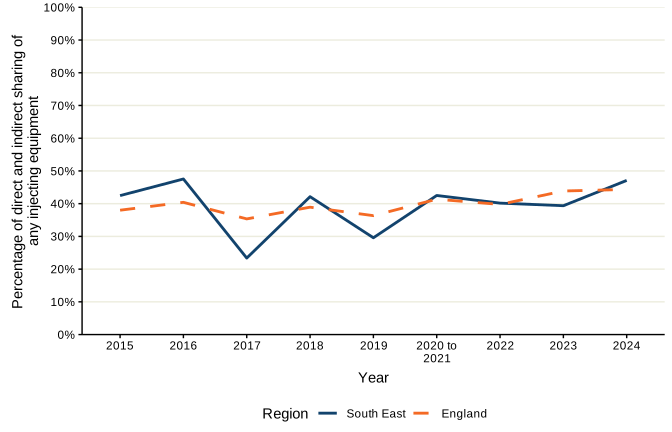
Figure 28. Reported level of direct and indirect sharing of injecting equipment among people who inject drugs (PWID), in the preceding 4 weeks, South East UKHSA region and England, 2015 to 2024
Data sources: UAM survey. For more information, see Information on data sources.
Note 38: during 2020 and 2021, recruitment to the UAM survey was impacted by the COVID-19 pandemic. As a result, there were changes in the geographic and demographic profile of people taking part. This should be considered when interpreting data for these years. Due to small numbers, data for 2020 and 2021 is combined.
Figure 28 shows the reported level of direct and indirect sharing of injecting equipment among people who inject drugs (PWID) in the preceding 4 weeks in the South East and England between 2015 and 2024.
In 2024, the reported level of direct and indirect sharing of injecting equipment in the South East was 47.1%, an increase from 39.4% in 2023 and slightly higher than that reported for England (44.4%). The reported level fluctuated over the period, reaching a low of 23.4% in 2017 before increasing overall, with the highest level reported in 2024. Since 2020 to 2021, levels in the South East have remained broadly comparable with those reported for England.
Information on data sources
Second Generation Surveillance System (SGSS)
Brief description
SGSS captures routine laboratory surveillance data on infectious diseases and antimicrobial resistance from laboratories within England. Along with a number of other organisms, hepatitis C is notifiable under the Health Protection (Notifications) Regulations (2010).
Technical notes
Laboratory reports of new diagnoses of HCV include positive test results for anti-HCV and HCV-RNA tests and are submitted to UKHSA or predecessor organisations via SGSS/CoSurv.
Data is assigned to local authority and UKHSA region by patient postcode where present, if patient postcode is unknown, data is assigned to local authority and UKHSA region of registered general practice; where both patient postcode and registered general practice are unknown data is assigned to local authority and UKHSA region of laboratory.
Dates are assigned based on earliest positive specimen date. Patient identifiable data submitted by NHS laboratories is variable, particularly from sexual health and drug and alcohol services, which limits the ability to deduplicate.
Laboratory reports for children under 1 year of age are excluded from the analyses to rule out detecting maternal antibody. Rates per 100,000 have been calculated using mid-year population estimates (MYE) supplied by the Office for National Statistics (ONS).
Caveat: SGSS data in this report may differ from data shown in the Hepatitis C in England report and from data reported in other surveillance outputs at a different point in time. This is due to the SGSS dataset being a live system and a number of cleaning, deduplication, remapping and other operational processes being routinely applied to the data to improve data quality.
Data extracted from Sentinel Surveillance of bloodborne virus testing (SSBBV) and SGSS will vary for several reasons and should not be compared: the 2 systems have collected data over different historical periods, with data reported to SGSS and predecessor systems since 1995, whereas SSBBV has been running since 2002. Data reported to SSBBV reflects the timeframe from when the laboratory joined the surveillance system, with laboratories joining more recently having less data available than laboratories who have been reporting since 2002. Furthermore, whilst SGSS collects national level data, SSBBV collects data from a subset of laboratories. Currently, 35 laboratories report to SSBBV with an estimated 45% coverage testing in the GP registered population in England.
Finally, it is not possible to differentiate a previous or current infection in SGSS with limited HCV RNA or HCV Ag data available, therefore numbers presented will be a mixture of previous and current infections. However, SSBBV allows for the collection of all HCV markers enabling HCV antibody and HCV RNA or HCV Ag to be presented separately.
Sentinel Surveillance of Bloodborne Viruses (SSBBV)
Brief description
SSBBV is a sub-national surveillance system for BBV testing activity and results in England, managed by UKHSA. Established in 2002, it includes data on all positive and negative BBV tests processed by the sentinel laboratories that participate in SSBBV. Laboratory participation in SSBBV is voluntary, and currently represents approximately 45% of the GP registered population in England. SSBBV includes the 2 laboratories that process DBS tests for the major drug services in England. Therefore, it is likely that the data covers most tests coming from drug services, where DBS is the main method of testing.
Technical notes
Patient identifiable data submitted by laboratories is variable, particularly from sexual health and drug and alcohol services, which limits the ability to de-duplicate. Data is de-duplicated subject to availability of date of birth, Soundex, NHS number and first initial. The proportion positive is calculated using the number of people tested.
For trends in hepatitis C antibody testing, SSBBV data is from 35 laboratories and is based on complete and consistent reporting since 2015 to remove any artificial increases or decreases in testing due to changes in reporting. This
means that the numbers of laboratories included for trend data may change each year depending on their reporting history. A positive test result first reported by participating laboratories may not reflect an individual’s first diagnosis.
Antibody testing excludes samples collected outside routine testing such as look back studies, reference testing, and children aged one year and under, whereas RNA or core antigen testing includes reference testing.
Reinfection
In England, 2 criteria have been used to identify hepatitis C virus reinfection, either of which would establish a person as experiencing reinfection:
- individuals with a positive hepatitis C virus RNA test at least 196 days (28 weeks) after treatment start date among those with an SVR during their first treatment period
- individuals who have a subsequent period of treatment after an initial SVR, and where this subsequent treatment period was at least 196 days after first treatment start date
For both definitions SVR is defined as either a recorded SVR or proxy SVR from a negative RNA or core antigen result after treatment. A period of 196 days between first treatment and reinfection diagnosis is used to define reinfection as the majority of individuals receiving treatment will have cleared hepatitis C virus within 6 months (182 days). A further 2 weeks (14 days) is added to account for any delays in treatment initiations. Reinfection after spontaneous clearance is not included.
The estimate now includes multiple reinfections, whereby someone is treated after experiencing their first reinfection and achieves an SVR but then has a subsequent hepatitis C virus RNA or core antigen positive result. The data is reliant upon persons initiating treatment being added to the NHSE Blueteq System or NHSE Hepatitis C Patient Registry and Treatment Outcome System, sufficient identifiers being available to link between the treatment and SSBBV databases and on people being tested post treatment. It should be noted that there is no internationally agreed definition for defining hepatitis C reinfection and a different window period may be used to confirm SVR post treatment. For example, Scotland uses a negative test between 10 weeks and 12 months post treatment to confirm SVR. As we progress towards elimination of hepatitis C virus as a public health threat, ongoing work across the UK will aim to harmonise definitions of reinfection where possible and utilise multiple methods, including the use of whole genome sequencing, to better understand reinfection.
Hospital Episode Statistics (HES)
Brief description
New cases of hepatitis C-related ESLD and/or HCC are monitored using HES for incidence of ESLD and HCC, and HES and SGSS for hepatitis C diagnoses. This is a new method in 2025 which presents data as a sensitivity analysis with upper and lower bounds, mirroring the updated methodology for deaths from hepatitis C-related ESLD and/or HCC. New cases are identified by first linking all episodes of ESLD and/or HCC in HES for an individual using their unique patient identifier. These are classified as ‘new’ if no previous episodes of ESLD and/or HCC for that individual are found in at least the previous 5 years (less than 1% of HCC and/or ESLD episodes are estimated to have had a previous episode more than 5 years earlier).
Linkage to hepatitis C diagnoses uses the following 2 methods:
- Lower bound: linkage to episode of hepatitis C in HES for all years: first diagnosis of ESLD and/or HCC linked to hepatitis C diagnosis in HES for any year. First diagnosis of ESLD and/or HCC used data from 2003 to 2024 to give minimum 5-year window for first episode starting at 2010. Hepatitis C diagnosis started from 1 April 2000 onwards. Hepatitis C includes both acute and chronic cases.
- Upper bound: linkage to diagnoses of hepatitis C in HES or surveillance data for all years: first diagnosis of ESLD and/or HCC linked to earliest diagnosis of hepatitis C in any of HES or SGSS.
Due to the loss of identifiers in HES data for 2017, data for 2017 and 2018 is omitted. More information is available in the Appendix 3 of Hepatitis C in England 2022.
Hepatitis C Treatment Pathway data
Brief description
Hepatitis C treatment initiation data is used to monitor access to hepatitis C treatment. Treatment coverage is defined as the proportion of individuals diagnosed with chronic hepatitis C (hepatitis C virus RNA or hepatitis C core antigen test positive) and who initiated treatment during a specified time frame over the number of individuals diagnosed with chronic hepatitis C for the specified time period.
Technical notes
Records from individuals with a diagnosis of chronic hepatitis C reported through SSBBV (positive hepatitis C virus RNA or antigen tests) are linked to the NHSE Hepatitis C Patient Registry and Treatment Outcome System using NHS number, name, DOB, hospital number and NHSE’s Blueteq System using NHS number, DOB, Blueteq number and excludes children aged under one year.
Patient identifiable data submitted by SSBBV laboratories is variable, particularly from sexual health and drug and alcohol services, which limits the ability to link data sets or de-duplicate. Data is de-duplicated subject to availability of DOB, Soundex, NHS number and first initial. Data quality is assessed on an ongoing basis to verify the number of people who tested positive for hepatitis C virus RNA or core antigen. As individuals are followed through the care pathway, the denominator is updated to exclude people who have died or who have evidence of spontaneous clearance.
In individuals testing hepatitis C virus RNA or core antigen positive with no linkage to the Hepatitis C Patient Registry and Treatment Outcome System or NHSE’s Blueteq System, there are no time restrictions on a subsequent hepatitis C virus RNA or core antigen negative test after the initial RNA or core antigen positive test. Therefore, these individuals may include those that have spontaneous clearance of their hepatitis C virus infection or individuals who have cleared their hepatitis C virus infection as a result of treatment but were not linked to the NHSE Hepatitis C Patient Registry and Treatment Outcome System or NHSE’s Blueteq System.
The NHSE Hepatitis C Patient Registry and Treatment Outcome System was commissioned by NHSE in 2017 from the Arden and Greater East Midlands Commissioning Support Unit to capture more detailed information for patients. The hepatitis C virus treatment monitoring in England report summarises the data held within the registry and Treatment Outcome System up to the end of April 2018.
Table 3. Definitions of the numerator and denominator for metrics reported in the hepatitis C treatment pathway
| Metric | Numerator | Denominator |
|---|---|---|
| Proportion of individuals diagnosed with chronic hepatitis C who were linked to specialist treatment services | Number of individuals linked to specialist hepatitis C treatment services via ODNs (identified through successful linkage to the NHSE Hepatitis C Patient Registry and Treatment Outcome System and/or NHSE’s Blueteq System). | Number of individuals who tested positive for hepatitis C virus RNA or core antigen with NHS number or name and date of birth (DOB) reported through SSBBV who had not died before linkage to treatment and where there was no evidence of possible spontaneous clearance. |
| Proportion of individuals linked to specialist treatment services who initiated treatment | Number starting treatment. | Number of individuals linked to specialist hepatitis C treatment services via ODNs. |
| Proportion of individuals diagnosed with chronic hepatitis C who initiated treatment (WHO target) | Number starting treatment. | Number of individuals who tested positive for hepatitis C virus RNA or core antigen with NHS number or name and DOB reported through SSBBV who had not died before linkage to treatment and where there was no evidence of possible spontaneous clearance. |
| Proportion of individuals who initiated treatment who had an outcome reported or had an RNA or core antigen test reported through SSBBV | Number of individuals who had a treatment outcome reported via the NHSE Hepatitis C Patient Registry and Treatment Outcome System, or in the absence of a recorded outcome, an RNA or core antigen test (positive or negative) recorded at 96 days or more after the treatment start date in SSBBV. | Number of individuals who started treatment. |
| Proportion of individuals who initiated treatment and were reported to have achieved SVR either as a treatment outcome or had an RNA or core antigen negative result reported through SSBBV | Number clearing hepatitis C virus as a treatment outcome, or in the absence of a reported SVR, an RNA or core antigen negative test recorded at 96 days or more after the treatment start date in SSBBV. The proportion reported as clearing hepatitis C virus is likely to be lower than the true proportion. | Number starting treatment. |
| Proportion of individuals who initiated treatment and had an outcome reported or an RNA or core antigen test reported through SSBBV who were reported to have achieved SVR or had an RNA or core antigen negative test result | Number clearing hepatitis C virus as a treatment outcome, or in the absence of a reported SVR, an RNA or core antigen negative test recorded at 96 days or more after the treatment start date in SSBBV. | Number of individuals with a treatment outcome recorded or with an RNA or core antigen test (positive or negative) recorded at 96 days or more after the treatment start date in SSBBV. |
Office for National Statistics (ONS) Mortality data
Brief description
The number of hepatitis C virus-related deaths are used to measure mortality. Deaths are based on the year of death. International classification of diseases (ICD) tenth revision (ICD-10) codes for ESLD and HCC are used to identify deaths with ESLD or HCC as a cause or associated with hospital admissions for these conditions. The number of deaths was estimated using slightly different ICD-10 codes from those used by WHO. A comparison of the codes used can be found in the Hepatitis C in England 2022 report.
Technical notes
An updated method for estimating deaths from hepatitis C-related ESLD and/or HCC has been used for this report. The previous method of reporting that solely used death data from the Office for National Statistics (ONS) was shown to underestimate mortality rates from hepatitis C-related liver disease by up to 60%. To address this, an updated method is used that presents the estimated mortality attributable to hepatitis C as a range. The lower bound of this range is similar to the previous methodology using only ONS death registration data, while the upper bound uses ONS death registration data linked to data on hospital episode statistics (HES) data on viral hepatitis, ESLD and/or HCC and laboratory data on viral hepatitis diagnoses. The updated methodology has been applied to all previous years, and includes deaths by year of death rather than by year the death was registered as was previously used.
Lower bound represents deaths where ESLD and/or HCC and hepatitis C were reported in ONS death registration data (as year of death is now used this is not comparable with previously published estimates which used year the death was registered). Upper bound represents deaths where ESLD and/or HCC were reported in ONS death registrations or identified in HES hospital admissions data linked to deaths data, and hepatitis C diagnoses were identified by linking between ONS deaths, HES hospital admissions data and laboratory diagnosis data to yield a maximum number of deaths attributable to hepatitis C-related ESLD and/or HCC. Excluding deaths of people aged under 16 and deaths registered in England where the deceased’s usual residence is outside England. ESLD is defined by codes or text entries for ascites, bleeding oesophageal varices, hepato-renal syndrome, hepatic encephalopathy, or hepatic failure.
Unlinked Anonymous Monitoring (UAM)
Brief description
The voluntary UAM survey recruits people who have ever injected psychoactive drugs through specialist services (such as needle and syringe programmes and addiction treatment centres) across England, Wales and Northern Ireland. Those who agree to take part self-complete a questionnaire and provide a biological specimen that is tested anonymously for HIV, hepatitis B and hepatitis C.
Technical notes
Regional level data from the UAM survey should be interpreted cautiously as the survey recruits participants through a nationally reflective sample of the services provided to people who inject drugs.
The COVID-19 pandemic, and associated changes in service delivery, impacted on recruitment to the survey in 2020 and 2021. By 2022, the number of services taking part in the survey, and the number of participants was comparable to pre-pandemic levels.
Published regional-level data and more information can be found at People who inject drugs: HIV and viral hepatitis monitoring.
Acknowledgements
We would like to thank the following:
- local laboratories for supplying the hepatitis data
- the UKHSA Blood Safety, Hepatitis, STI and HIV Division for collection, analysis and distribution of data
- the UKHSA Epidemiology Data Science unit (part of the Epidemiology Data Science team) for producing the charts and figures contained in this report
- the Office for National Statistics (ONS), which carried out the original collection and collation of the mid-year population estimates, death registration data and geographic boundary data but bears no responsibility for their future analysis or interpretation)
- the Hospital Episode Statistics (HES), NHS England, produced by UKHSA
About Field Services
Field Services is a division within UKHSA that provides a national service comprising geographically dispersed multi-disciplinary teams integrating expertise in Field Epidemiology, Public Health Microbiology, Rapid Investigation, Real-time Syndromic Surveillance, Field Epidemiology Training, and Data Science to strengthen the surveillance, epidemiological intelligence and response functions of UKHSA.
You can contact your local Field Services team at FES.SEaL@ukhsa.gov.uk
If you have any comments or feedback regarding this report or the Field Services, please contact FS.Central@ukhsa.gov.uk