Hate crimes, England and Wales 2011 to 2012
Published 13 September 2012

© Crown copyright 2012
This publication is licensed under the terms of the Open Government Licence v3.0 except where otherwise stated. To view this licence, visit nationalarchives.gov.uk/doc/open-government-licence/version/3 or write to the Information Policy Team, The National Archives, Kew, London TW9 4DU, or email: psi@nationalarchives.gov.uk.
Where we have identified any third party copyright information you will need to obtain permission from the copyright holders concerned.
This publication is available at https://www.gov.uk/government/statistics/hate-crimes-england-and-wales-2011-to-2012--2/hate-crimes-england-and-wales-2011-to-2012
1. Overview
This release covers hate crimes recorded by the police during 2011 to 2012; this is the first time these figures are being published by the Home Office. ‘Hate crime’ is any notifiable offence committed against a person or property that is motivated by hostility towards someone based on their disability, race, religion, gender-identity or sexual orientation, whether perceived to be so by the victim or any other person. This release focuses on the 5 monitored forms of hate crime classifications used by the criminal justice system.
2. Key findings
There were 43,748 hate crimes recorded by the police in 2011 to 2012.
Note that this figure relates to the 5 monitored strands of hate crime classifications used by the criminal justice system and is not a count of crime as more than one form of hate crime can be assigned to an offence. Indicative data suggest that less than 5% of hate crime offences have more than one monitored strand assigned (this ranged between 1% and 7% of offences for the 17 forces whose data was reviewed).
Of the 43,748 hate crimes recorded by the police:
- 35,816 (82%) were race hate crimes
- 1,621 (4%) were religion hate crimes
- 4,252 (10%) were sexual orientation hate crimes
- 1,744 (4%) were disability hate crimes
- 315 (1%) were transgender hate crimes
Race hate crimes accounted for the majority of hate crimes in all forces.
3. Data tables
Hate crime figures for 2011 to 2012 broken down by police force area can be found in the Hate crimes tables.
4. Hate crimes
In 2007, the police, Crown Prosecution Service, Prison Service (now the National Offender Management Service) and other agencies that make up the criminal justice system agreed a common definition of monitored hate crime to cover 5 ‘strands’, in particular – disability, gender-identity, race, religion and sexual orientation. Primarily, this was to ensure a consistent working definition to allow accurate recording and monitoring.
‘Hate crime’ is any notifiable offence committed against a person or property that is motivated by hostility towards someone based on their disability, race, religion, gender identity or sexual orientation, whether perceived to be so by the victim or any other person. Hence hate crimes are a subset of crimes that are recorded by the police and make up roughly around 1% of all crimes based on police recorded crime figures for 2011 to 2012 (see Crime statistics, period ending March 2012).
There were 43,748 hate crimes recorded by the police in 2011 to 2012, of which:
- 35,816 (82%) were race hate crimes
- 1,621 (4%) were religion hate crimes
- 4,252 (10%) were sexual orientation hate crimes
- 1,744 (4%) were disability hate crimes
- 315 (1%) were transgender hate crimes
Note that these figures relate to the 5 monitored strands of hate crime classifications used by the criminal justice system and are not a count of crime as more than one form of hate crime can be assigned to an offence. Indicative data suggest that less than 5% of hate crime offences have more than one monitored strand assigned (this ranged between 1% and 7% of offences for the 17 forces whose data was reviewed).
5. Hate crimes by police force area
A total of 35,816 race hate crimes were recorded by the police in 2011 to 2012, accounting for 82% of hate crimes overall. Race hate crimes accounted for the majority of hate crimes in all forces, ranging from 58% of the 601 hate crimes recorded by Suffolk to 91% of the 811 hate crimes recorded by Devon and Cornwall.
Religion hate crimes (1,621) accounted for 4% of all hate crimes overall; all forces recorded religion hate crimes equivalent to less than 10% of all hate crimes.
10% of all hate crimes were sexual orientation hate crimes, that is, 4,252. While there was some variation between forces, sexual orientation hate crimes accounted for less than 20% of hate crimes across all forces.
4% of recorded hate crimes were disability hate crimes (1,744), with little variation in the proportion recorded by forces with the exception of Norfolk and Suffolk whose disability hate crimes accounted for 22% of the hate crimes those forces recorded.
The least commonly recorded hate crime was transgender hate crime (315, or 1% of hate crimes) and was recorded at a level below 5% across all forces.
6. Hate crimes by type of offence
The Home Office Data Hub is the primary data collection tool for police recorded crime. In addition to collecting data on the count of recorded crimes, police forces can also submit information identifying whether offences are determined to be hate crimes; hence the Home Office Data Hub contains information on the type of offences hate crimes involve.
However, not all forces are currently providing this information through the Data Hub. The following information is therefore based on a limited number of forces (17) who provided suitable data for 2011/12 and as such these figures are indicative findings and caution should be applied to interpretation of these data across England and Wales.
The available data showed that the majority of all hate crimes (83%) involved violence against the person offences; the highest proportion among the monitored strands was that 85% of race hate crimes were violent offences.
The next most common offence type for hate crimes was criminal damage (for example, 19% of religion hate crimes and 18% of disability hate crimes involved criminal damage); the remainder of hate crimes were accounted for by a range of other notifiable offences, such as theft offences, burglary and sexual offences.
6.1 Proportion of hate crimes by recorded offence type, England and Wales 2011/12
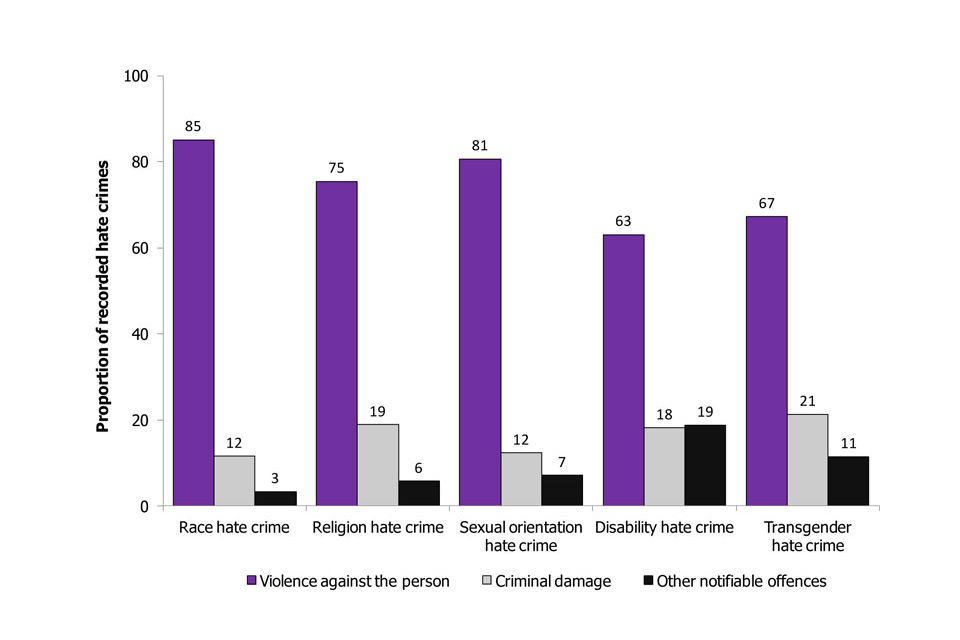
Source: Home Office, Hate crimes tables: Table HC.02
Not all violence against the person offences result in injury; just under a half (44%) of all police recorded violence against the person offences in 2011 to 2012 involved injury (see Crime statistics, period ending March 2012. Compared with violence against the person offences overall, a lower proportion of hate crimes that were violent crimes resulted in injury, for example, 12% of race hate crimes that were recorded as violence against the person resulted in injury. For the remaining monitored strands:
- three-quarters (75%) of religion hate crimes were recorded as violence against the person and of these violent crimes, 8% involved injury
- around 4 in 5 (81%) of sexual orientation hate crimes involved violence against the person and of these violent crimes, a quarter (25%) involved injury
- 63% of disability hate crimes involved violence against the person; of these offences, 1 in 5 (20%) involved injury
- two-thirds (67%) of transgender hate crimes were violence against the person offences, of which 22% involved injury
7. Data quality and interpreting the figures
The Coalition government’s commitment to tackle hate crime: Challenge it, Report it, Stop it: The Government’s Plan to Tackle Hate Crime included a statement that the Home Office would publish police data on recorded hate crimes by Summer 2012.
Hate crime figures from the police have previously been published by ACPO (Recorded hate crime data for 2010 for England, Wales and Northern Ireland) and following the release of 2011 data, the responsibility for publication of police recorded hate crime figures has transferred to the Home Office. Previously published figures by ACPO found similar distributions as shown in this release, with the majority of hate crimes being race hate crimes. However, data are not directly comparable as the time periods for the collections differ as does the recording methodology (forces record solely one form of monitored hate crime for each offence) and geographical coverage.
The ‘monitored hate crime’ agreed definition is:
- any criminal offence which is perceived, by the victim or any other person, to be motivated by a hostility or prejudice based on a person’s race or perceived race (any racial group or ethnic background including countries within the United Kingdom and Gypsy & Traveller groups)
- any criminal offence which is perceived, by the victim or any other person, to be motivated by a hostility or prejudice based on a person’s religion or perceived religion (any religious group including those who have no faith)
- any criminal offence which is perceived, by the victim or any other person, to be motivated by a hostility or prejudice based on a person’s sexual orientation or perceived sexual orientation
- any criminal offence which is perceived, by the victim or any other person, to be motivated by a hostility or prejudice based on a person’s disability or perceived disability (any disability including physical disability, learning disability and mental health)
- any criminal offence which is perceived, by the victim or any other person, to be motivated by a hostility or prejudice against a person who is transgender or perceived to be transgender (including people who are transsexual, transgender, transvestite and those who hold a Gender Recognition Certificate under the Gender Recognition Act 2004)
Data were collected from 44 police forces in England and Wales and cover notifiable offences (see the User Guide to Crime Statistics for England and Wales that were recorded by the police between 1 April 2011 and 31 March 2012. These data have been confirmed with police forces and are correct as at 31 August 2012.
The number of hate crimes will exceed the number of offences as forces were advised to record multiple strands as appropriate for each offence (2 forces provided data where only the primary strand was recorded).
These data are currently Official Statistics. While accreditation for National Statistics has not yet been sought from the UK Statistics Authority, the principles and protocols in the Code of Practice for Official Statistics have been followed where possible to ensure best practice.
8. Other data sources
Racist incidents, England and Wales 2011 to 2012 are published simultaneously with this release by the Home Office. Racist incidents differ from race hate crimes as they also include non-notifiable offences, incidents that were not subsequently recorded as crimes and ‘no crimes’ (see the User Guide to Crime Statistics for England and Wales).
Recorded hate crime data for 2011 for England, Wales and Northern Ireland are published simultaneously with this release by ACPO. These data relate to ‘recordable crimes’ under Home Office Counting Rules include solely one form of monitored hate crime for each offence.
Data from the 2009 to 2010 and 2010 to 2011 Crime Survey for England and Wales on the extent of and perceptions towards hate crime were published in 2012 in Hate crime, cyber security and the experience of crime among children 2010 to 2011.
The biennial Ministry of Justice publication [Statistics on Race and the Criminal Justice System] brings together statistical information on how members of the Black, Asian and Minority Ethnic communities are represented in the CJS as suspects, offenders, victims and employees/practitioners.
True Vision provides information about hate crime and how to report it.
For the latest available police recorded crime figures see Crime statistics, period ending March 2012.