Get Britain Working outcomes
Published 3 April 2025

© Crown copyright 2025
This publication is licensed under the terms of the Open Government Licence v3.0 except where otherwise stated. To view this licence, visit nationalarchives.gov.uk/doc/open-government-licence/version/3 or write to the Information Policy Team, The National Archives, Kew, London TW9 4DU, or email: psi@nationalarchives.gov.uk.
Where we have identified any third party copyright information you will need to obtain permission from the copyright holders concerned.
This publication is available at https://www.gov.uk/government/publications/get-britain-working-outcomes/get-britain-working-outcomes
Background
The government has a clear ambition to raise the employment rate to 80% but recognises that there are many components of a sustained improvement to the workforce. The metrics in this document show some of the key indicators that the government will continue to monitor closely as we carry out our work. These will build on aims set out in the Prime Minister’s Plan for Change[footnote 1] and published in the Get Britain Working White Paper[footnote 2].
About the outcome metrics
Key outcome metrics
Following advice from the Labour Market Advisory Board[footnote 3], chaired by Professor Paul Gregg, all metrics apply to people aged 18 to 66, unless where otherwise stated. The rationale for this is that education or training should continue until age 18 in England[footnote 4] and State Pension age will be 67 by March 2028[footnote 5]. This age range therefore best reflects the ‘working age population’.
1. Employment rate – the number of people aged 18 to 66 in employment divided by the population aged 18 to 66.
2. Real earnings amongst non-retired households (all ages) – a component of real household disposable income (RHDI). We look at wages and salaries, imputed income from benefits-in-kind and self-employment income in households of non-retired individuals. Additional focus will be on households in the bottom half/lower 50% of the income distribution.
Intermediate outcome metrics
1. Local variation in employment rates – employment rates (i.e. the number of people aged 18 to 66 in local authorities, defined as unitary local authorities/local authorities counties in the UK, their distribution and gap between the bottom 10% and median.
2. Health related economic inactivity rate – number of people aged 18 to 66 who are economically inactive due to being long-term sick divided by the 18 to 66 population.
3. Disability employment rate gap – the difference in the employment rate of people, aged 18 to 66, who report they are disabled as defined by the Government Statistical Service (GSS) Harmoniseed Standard[footnote 6], and those who do not.
4. Proportion of 18 to 24 year olds not in education, employment or training[footnote 7], supported by an increase in the proportion of 16 to 21 year olds in education or a job with training[footnote 8].
5. Employment among parents aged 18 to 66:
a. the employment rate gap between lone parents and parents in a couple - the difference in the employment rate of lone parents and parents in a couple. The employment rate of lone parents is calculated as the number of lone parents in employment divided by the number of all lone parents. The employment rate for parents in a couple is calculated as the sum of fathers employed in couple and mothers employed in a couple divided by all parents in a couple. Both are relevant for families with people aged 18 to 66.
b. the percentage of coupled families where at least one parent is out of work – the number of families with parents in a couple, where one or more of the parents are out of work divided by the number of families with coupled parents. Relevant for people aged 18 to 66.
And aim to increase:
6. Female employment rate[footnote 9] – the number of women aged 18 to 66 in employment divided by the number of women in the population, aged 18 to 66.
Key outcome metrics
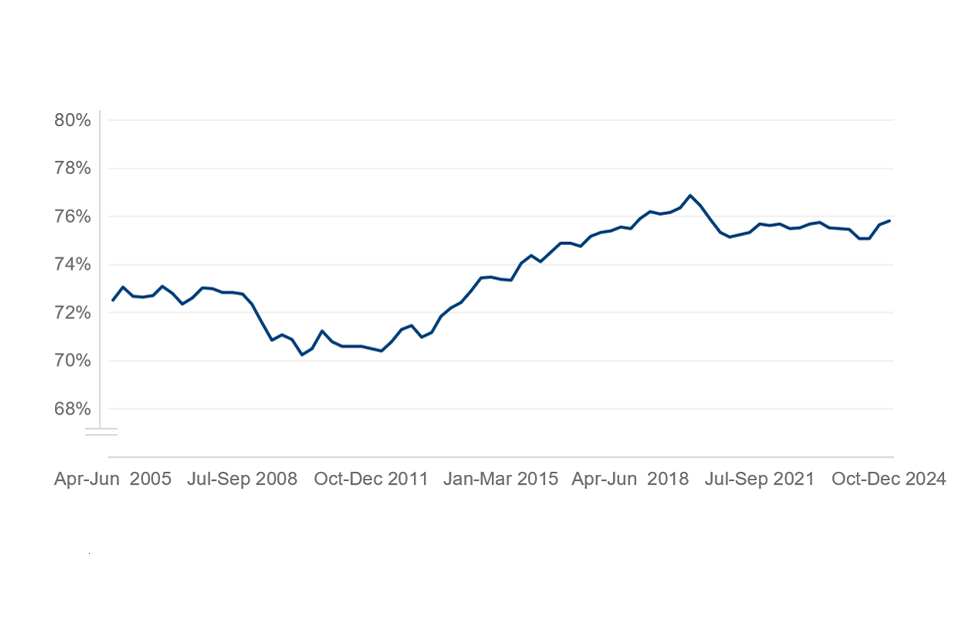
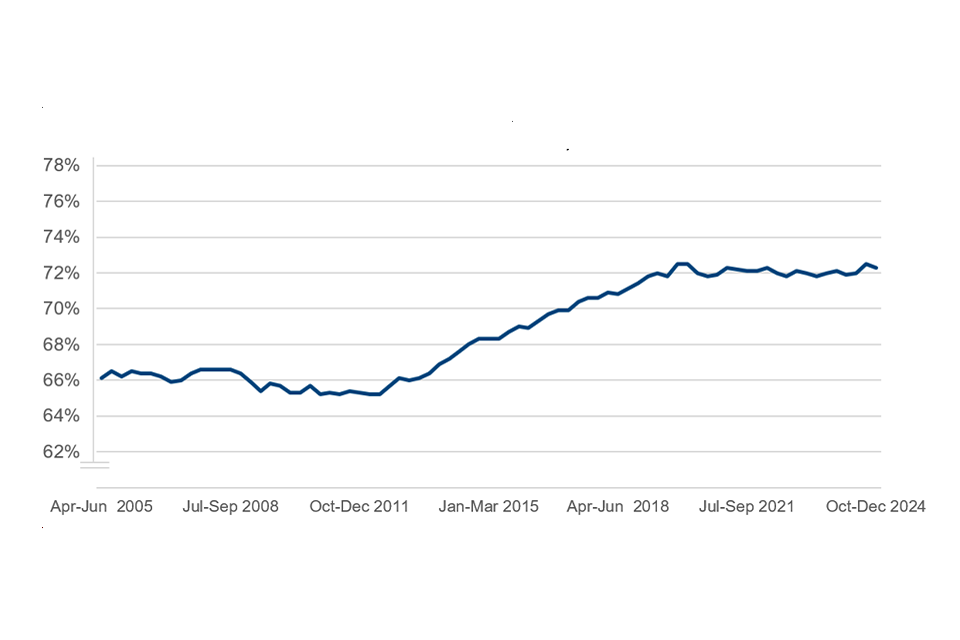
Increase employment rate for people aged 18 to 66 (towards long-term ambition of 80%).
The employment rate of people aged 18 to 66 is 75.8%. This is 0.3% pts up on the year and 1.1% pts down on pre-COVID pandemic.
Figure 1: Employment rate of people aged 18 to 66
| Date | 18 to 66 employment rate % |
|---|---|
| Jan to Mar 2005 | 72.6% |
| Apr to Jun 2008 | 72.8% |
| Jul to Sep 2011 | 70.6% |
| Oct to Dec 2014 | 73.5% |
| Jan to Mar 2018 | 75.6% |
| Apr to Jun 2021 | 75.3% |
| Jul to Sep 2024 | 75.7% |
Source: Internal DWP analysis of the ONS Labour Force Survey[footnote 10]
Increase real earnings[footnote 11] amongst non-retired households, especially in the bottom half of the income distribution.
Real earnings at the bottom half of the income distribution (5th decile and below), has generally been increasing since 2014 to 2015.
Figure 2: Real earnings at the bottom half of income distribution (5th decile and below) (2022 to 2023 prices)
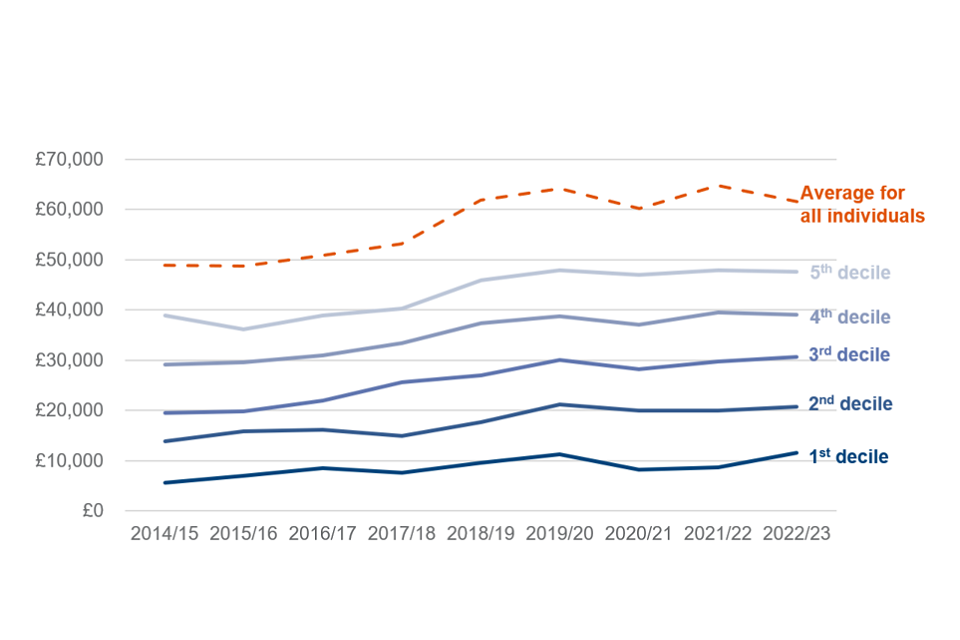
| Deciles | 2014 to 2015 | 2015 to 2016 | 2016 to 2017 | 2017 to 2018 | 2018 to 2019 | 2019 to 2020 | 2020 to 2021 | 2021 to 2022 | 2022 to 2023 |
|---|---|---|---|---|---|---|---|---|---|
| Bottom | £5,568 | £6,955 | £8,516 | £7,582 | £9,569 | £11,304 | £8,233 | £8,607 | £11,496 |
| 2nd | £13,795 | £15,784 | £16,189 | £14,861 | £17,629 | £21,203 | £19,895 | £20,024 | £20,655 |
| 3rd | £19,514 | £19,888 | £21,965 | £25,664 | £26,921 | £30,027 | £28,212 | £29,749 | £30,604 |
| 4th | £29,062 | £29,567 | £31,035 | £33,350 | £37,433 | £38,711 | £37,075 | £39,442 | £39,057 |
| 5th | £38,863 | £36,151 | £38,825 | £40,306 | £45,866 | £47,894 | £47,052 | £47,838 | £47,547 |
| 6th | £47,618 | £45,282 | £47,356 | £50,602 | £57,577 | £56,446 | £55,206 | £57,659 | £55,842 |
| 7th | £56,155 | £55,206 | £58,710 | £57,666 | £65,219 | £67,725 | £65,342 | £68,847 | £66,523 |
| 8th | £65,771 | £68,313 | £67,907 | £69,801 | £79,200 | £80,026 | £74,713 | £78,847 | £78,124 |
| 9th | £80,395 | £77,431 | £82,418 | £89,874 | £95,505 | £95,006 | £88,801 | £97,825 | £94,964 |
| Top | £132,851 | £133,205 | £135,637 | £142,521 | £183,310 | £193,312 | £178,073 | £198,567 | £171,571 |
| All individuals | £48,959 | £48,777 | £50,856 | £53,223 | £61,823 | £64,165 | £60,261 | £64,741 | £61,639 |
Source: DWP analysis of the ONS’ ‘The effects of taxes and benefits on household income, disposable income estimate’
Intermediate outcomes metrics
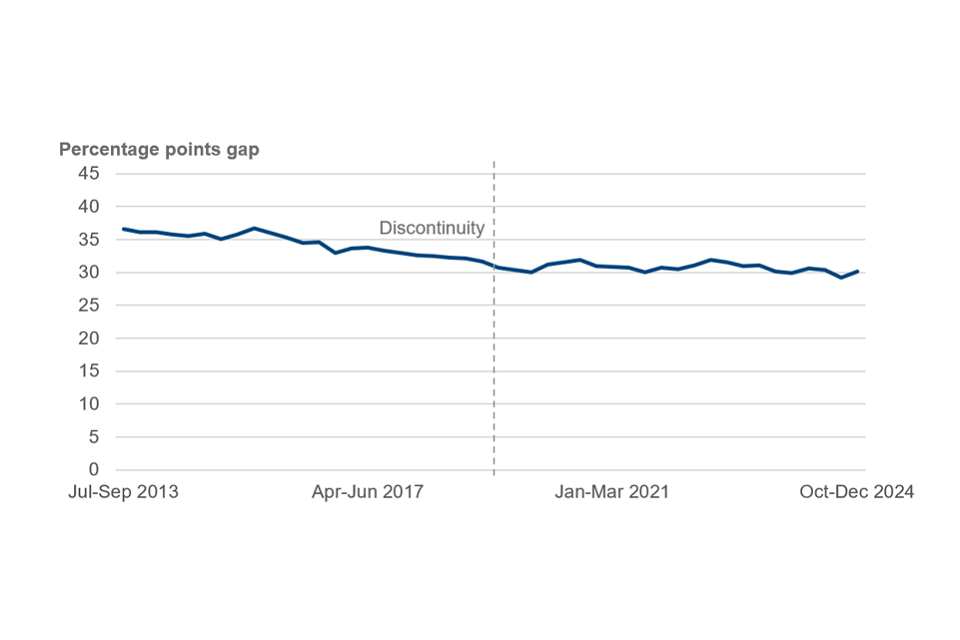
Reduce local variations in employment rates (people aged 18 to 66)
Data from the Annual Population Survey (APS) shows considerable variation in local authority[footnote 12] employment rates. The gap between the bottom decile and the median is currently 7.1% pts. After a noticeable narrowing of the gap in 2019 to 2020 and 2020 to 2021, it started to trend upwards and is back to where it was in 2009 to 2010.
Figure 3: Local authorities employment rate gap between bottom decile and median for people aged 18 to 66.
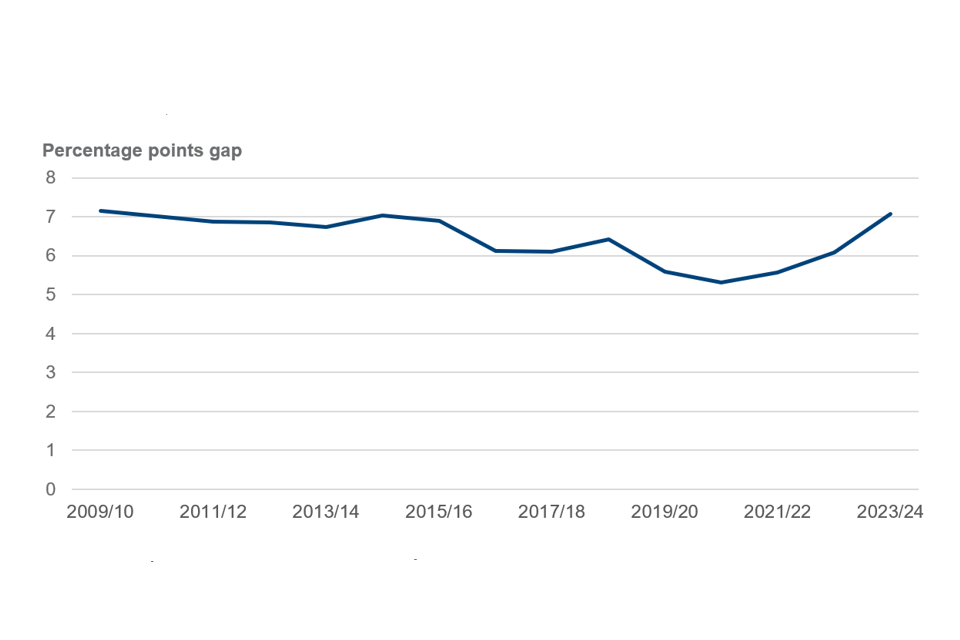
| Year | Percentage points gap |
|---|---|
| 2009 to 2010 | 7.1 |
| 2011 to 2012 | 6.9 |
| 2013 to 2014 | 6.7 |
| 2015 to 2016 | 6.9 |
| 2017 to 2018 | 6.1 |
| 2019 to 2020 | 5.6 |
| 2021 to 2022 | 5.6 |
| 2023 to 2024 | 7.1 |
Source: Internal DWP analysis of the ONS’ Annual Population Survey[footnote 13]
Figure 4: Variation in local authority employment rate - people aged 18 to 66
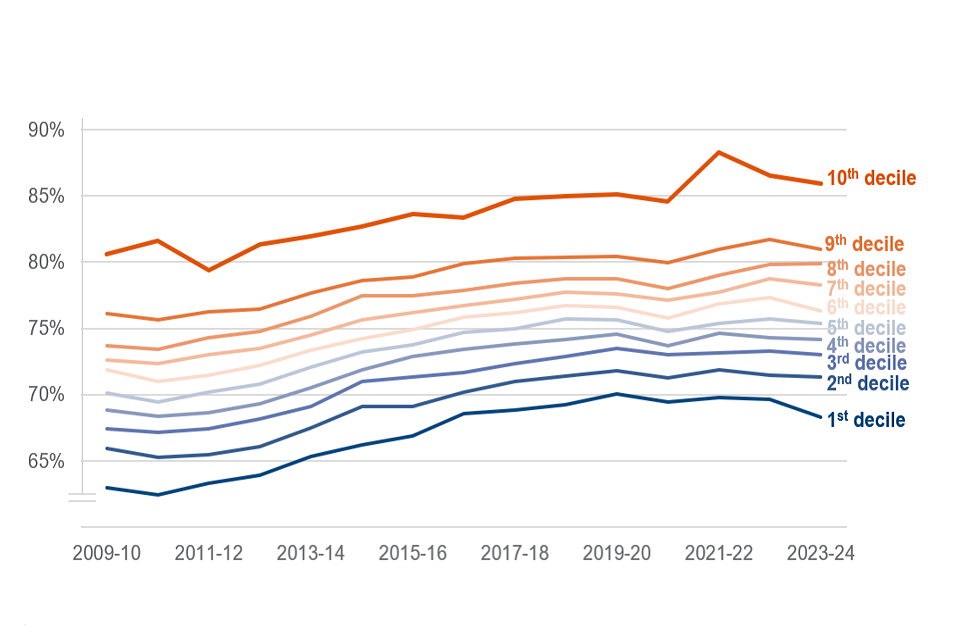
| Decile | 2009 to 2010 | 2011 to 2012 | 2013 to 2014 | 2015 to 2016 | 2017 to 2018 | 2019 to 2020 | 2021 to 2022 | 2023 to 2024 |
|---|---|---|---|---|---|---|---|---|
| 1st decile | 62.9% | 63.3% | 65.4% | 66.9% | 68.9% | 70.0% | 69.8% | 68.3% |
| 2nd decile | 65.9% | 65.4% | 67.5% | 69.1% | 71.0% | 71.8% | 71.8% | 71.3% |
| 3rd decile | 67.4% | 67.4% | 69.1% | 71.3% | 72.3% | 73.5% | 73.2% | 73.0% |
| 4th decile | 68.8% | 68.6% | 70.5% | 72.9% | 73.8% | 74.6% | 74.6% | 74.2% |
| 5th decile | 70.1% | 70.2% | 72.1% | 73.8% | 75.0% | 75.6% | 75.4% | 75.4% |
| 6th decile | 71.9% | 71.5% | 73.4% | 74.9% | 76.2% | 76.6% | 76.9% | 76.3% |
| 7th decile | 72.6% | 73.0% | 74.5% | 76.2% | 77.2% | 77.6% | 77.7% | 78.3% |
| 8th decile | 73.7% | 74.3% | 75.9% | 77.5% | 78.4% | 78.8% | 79.1% | 79.9% |
| 9th decile | 76.1% | 76.2% | 77.7% | 78.9% | 80.3% | 80.4% | 81.0% | 81.0% |
| 10th decile | 80.6% | 79.4% | 82.0% | 83.6% | 84.8% | 85.1% | 88.3% | 86.0% |
Source: Internal DWP analysis of the ONS’ Annual Population Survey
Reduce health-related economic inactivity (people aged 18 to 66).
Economic inactivity due to long-term sickness has been trending upwards among people aged 18 to 66 since 2019[footnote 14]. It is currently at 6.8%, 1.6% pts above pre-covid (5.2%).
Figure 5: Economic inactivity due to long-term sickness, people aged 18 to 66
| Date | LT sick inactive as a percentage of all 18 to 66 |
|---|---|
| Apr to Jun 2005 | 6.1% |
| Jan to Mar 2010 | 5.7% |
| Oct to Dec 2014 | 5.2% |
| Jul to Sep 2019 (Discontinuity) | 5.2 % |
| Apr to Jun 2024 | 7.0% |
Source: Internal DWP analysis of the ONS Labour Force Survey
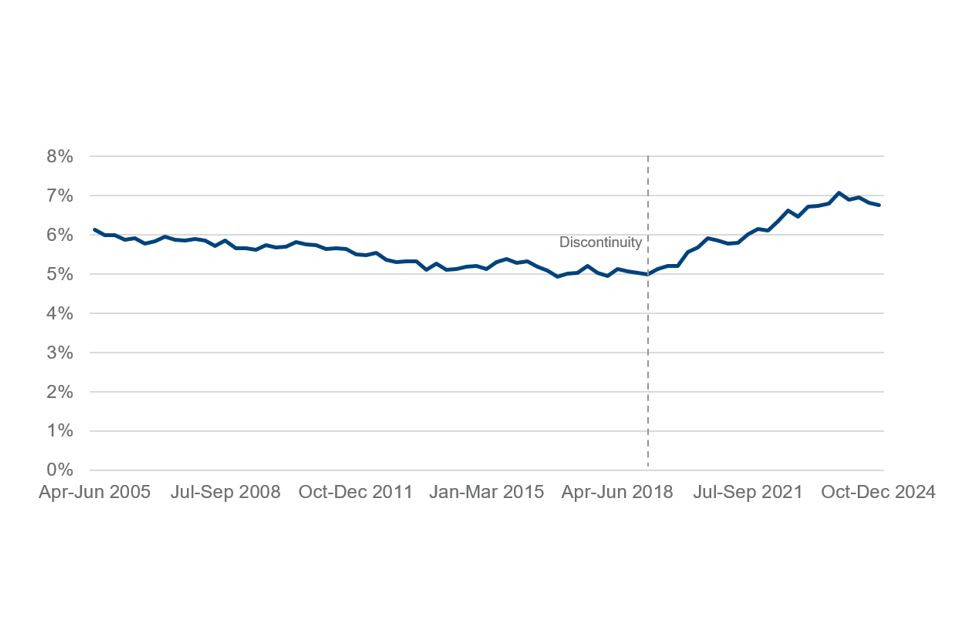
Reduce disability employment gap for people aged 18 to 66
The gap between the employment rates of disabled and non-disabled people, aged 18 to 66, has generally been reducing over time[footnote 15]. It is currently at 30.1% pts, near historic low of 30.0% pts.
Figure 6: Disability employment rate gap, people aged 18 to 66.
| Date | Percentage points gap |
|---|---|
| Apr to Jun 2013 | 35.6 |
| Jan to Mar 2017 | 33.6 |
| Oct to Dec 2018 (Discontinuity) | 32.1 |
| Oct to Dec 2020 | 31.0 |
| Jul to Sep 2024 | 29.2 |
Source: Internal DWP analysis of the ONS Labour Force Survey
Reduce the proportion of young people (18 to 24) not in education, employment or training (NEET).
The NEET rate[footnote 16] for 18 to 24-year-olds has been trending upwards over the last 2 years. It is currently at 15.8%. This comes from publicly available ONS data.
Figure 7: proportion of young people not in education, employment or training (NEET), people aged 18 to 24
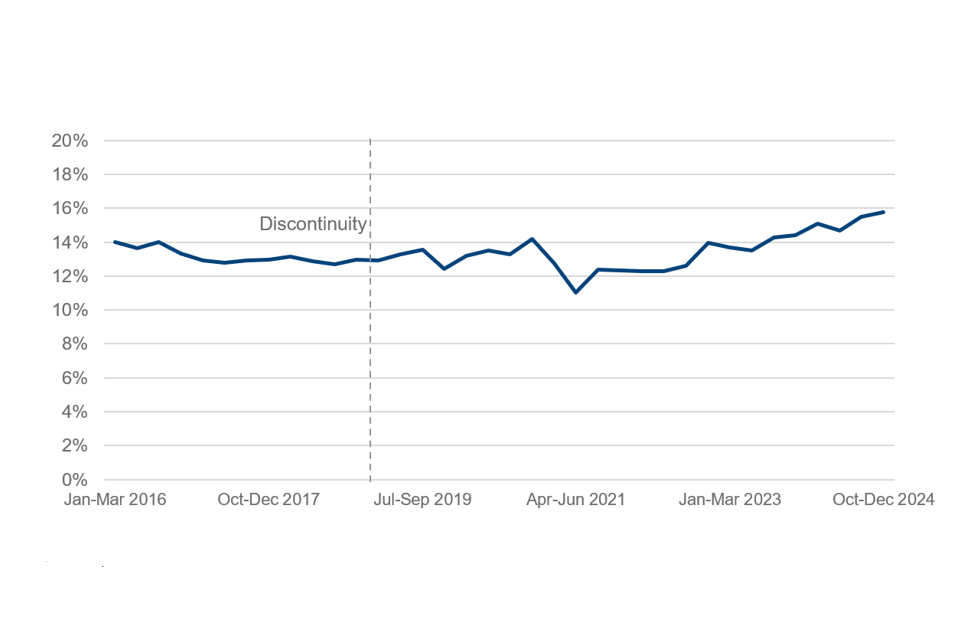
| Date | NEET rate for people aged 18 to 24 |
|---|---|
| Apr to Jun 2018 | 12.9% |
| Jul to Sep 2019 | 13.3% |
| Oct to Dec 2020 | 13.9% |
| Apr to Jun 2022 (Discontinuity) | 12.5% |
| Jan to Mar 2022 | 12.2% |
| Apr to Jun 2023 | 13.5% |
| Jul to Sep 2024 | 15.6% |
Source: Young people not in education, employment or training (NEET) – Office for National Statistics
This outcome metric will be supported by the following metric being monitored as part of the Government’s Opportunity Mission to:
- increase the percentage of 16 to 21 year olds either in classroom-based education and training, or in a job which provides skills training in England
- the proportion of 16 to 21 year olds participating in education or training has gone up since 2000[footnote 17]. There was noticeable increase post-COVID-19 pandemic which subsequently reduced. It was at 70.8% at the end of 2024
Figure 8: proportion of 16 to 21 year olds in education or training (England only)
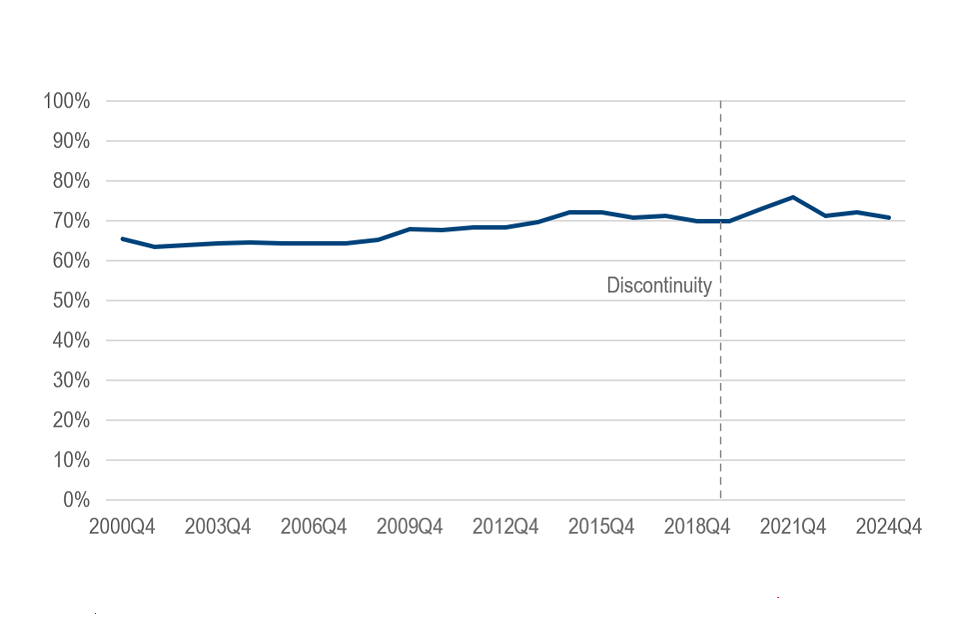
| Quarter | Age 16 to 21 % |
|---|---|
| 2000Q4 | 65.4% |
| 2003Q4 | 64.3% |
| 2006Q4 | 64.3% |
| 2009Q4 | 67.8% |
| 2012Q4 | 68.4% |
| 2015Q4 | 72.0% |
| 2018Q4 | 69.9% |
| 2019Q4 (LFS weighting discontinuity) | 69.8% |
| 2021Q4 | 75.9% |
| 2024Q4 | 70.8% |
Source: DfE analysis of the ONS Labour Force Survey. Available on Explore education statistics - GOV.UK
Reduce the employment rate gap between lone parents and parents who are part of a couple for people aged 18 to 66
The employment rate gap between lone parents and parents in a couple is 21.4%. Lone parents’ employment rate has been consistently lower than coupled parents. This has been on a downward trend since 2006[footnote 18]. Recent data appear to show the gap rising again.
Figure 9: parental employment rate gap between lone parents and parents in a couple – people aged 18 to 66.
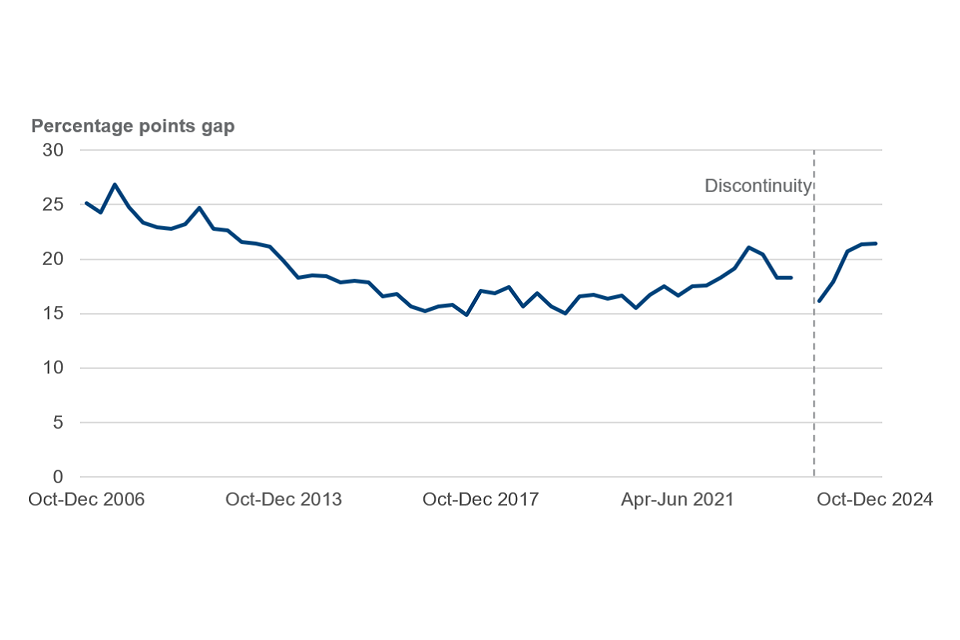
| Date | Percentage points gap |
|---|---|
| Apr to Jun 2006 | 24.5 |
| Apr to Jun 2013 | 21.2 |
| Jul to Sep 2017 | 14.8 |
| Jan to Mar 2021 | 17.5 |
| Jul to Sep 2023 (LFS weighting discontinuity) | * |
| Jul to Sep 2024 | 21.4 |
Source: Internal DWP analysis of the ONS Labour Force Survey
Reduce percentage of coupled households where at least one parent is out of work - people aged 18 to 66.
In July to September 2024, 24.1% of all coupled families had at least one parent out of work. There has been a gradual decline in this figure since 2016[footnote 19]. There is evidence showing that reducing this has significant positive impacts on child poverty, other things being equal.
Figure 10: Percentage of coupled households where at least one parent is out of work - people aged 18 to 66
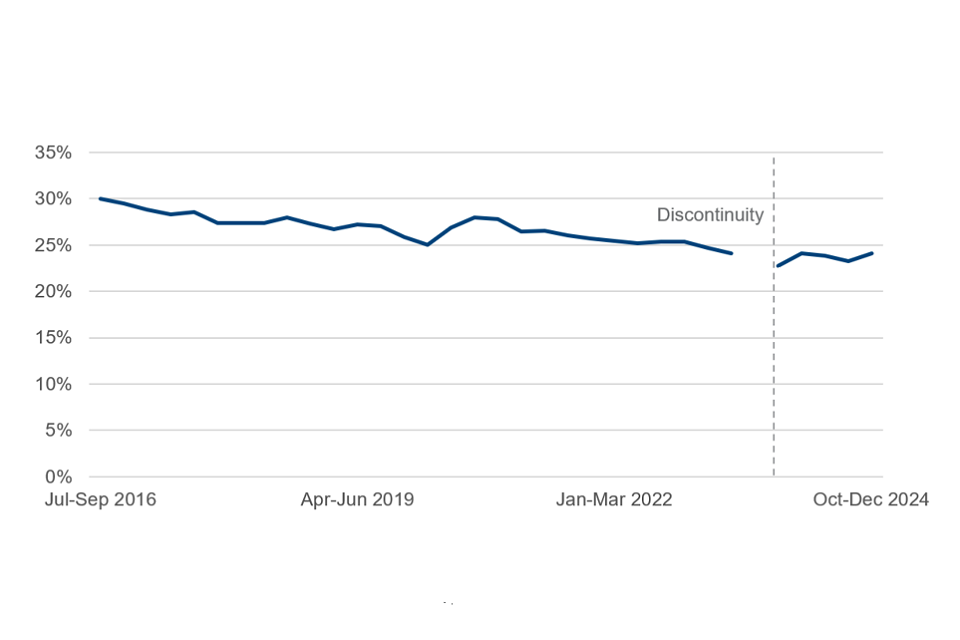
| Date | Percentage |
|---|---|
| Apr to Jun 2016 | 29.8% |
| Jan to Mar 2019 | 26.7% |
| Oct to Dec 2021 | 25.7% |
| Jul to Sep 2023 (LFS data discontinuity) | * |
| Jul to Sep 2024 | 23.2% |
Source: Internal DWP analysis of the ONS Labour Force Survey
Increase employment rate of women aged 18 to 66
The employment rate of women aged 18 to 66 is 72.3%. This is slightly lower pre-COVID (72.5%) and 7.1% pts lower than the employment rate of men at 79.4%.
Figure 11: Employment rate of women aged 18 to 66
| Date | 18 to 66 female employment rate |
|---|---|
| Jan to Mar 2005 | 66.3% |
| Apr to Jun 2008 | 66.6% |
| Jul to Sep 2011 | 65.4% |
| Oct to Dec 2014 | 68.3% |
| Jan to Mar 2018 | 70.8% |
| Apr to Jun 2021 | 72.2% |
| Jul to Sep 2024 | 72.5% |
Future publications
DWP will provide an annual update outlining recent trends in these metrics.
Data sources
Some of the metrics in this publication are estimated from the Labour Force Survey (LFS) or its counterpart the Annual Population Survey (APS), which are large, representative surveys of UK households collected by the independent Office for National Statistics (ONS). The LFS and APS provide detailed, rich information on the characteristics of people in the labour market and are valuable data source to monitor our Get Britain Working reforms on different groups and areas. However, the ONS note that there is ‘increased volatility in LFS estimates, resulting from smaller achieved sample sizes, which means that estimates of change should be treated with additional caution[footnote 20].’
The ONS at the end of 2023 introduced a LFS recovery plan[footnote 21] to mitigate these issues, which has seen sample sizes begin to increase throughout 2024[footnote 22], though the data needs careful interpretation as recovery measures continue to take full effect.
-
See Plan for Change – GOV.UK ↩
-
See Get Britain Working White Paper – GOV.UK ↩
-
See Labour Market Advisory Board – GOV.UK ↩
-
In devolved nations, school leaving age is 16, but participation in education or training remains high. See for example: Annual Participation Measure ↩
-
See State Pension Age timetable – GOV.UK ↩
-
(current) physical or mental health condition(s) or illnesses lasting or expected to last 12 months or more; and the condition(s) or illness(es) reduce their ability to carry out day-to-day activities ↩
-
UK-wide metric. ↩
-
England only metric ↩
-
3.A ‘Women in the economy’, pg. 72 Autumn Budget 2024 – HC 295 ↩
-
See Labour Force Survey (LFS) QMI – Office for National Statistics ↩
-
This measure is adjusted into real terms using: GDP deflators at market prices, and money GDP October 2024 – (Autumn Budget 2024) GOV.UK ↩
-
Local authorities are defined as unitary local authorities / local authorities counties in the UK ↩
-
See Annual population survey (APS) QMI – Office for National Statistics ↩
-
Data from January to March 2019 onward has been ‘reweighted’ by the ONS to reflect newer population estimates, causing a step change discontinuity in estimates before and after this period. ↩
-
Data from January to March 2019 onward has been ‘reweighted’ by the ONS to reflect newer population estimates, causing a step change discontinuity in estimates before and after this period. ↩
-
Data from January to March 2019 onward has been ‘reweighted’ by the ONS to reflect newer population estimates, causing a step change discontinuity in estimates before and after this period. ↩
-
Data from January to March 2019 onward has been ‘reweighted’ by the ONS to reflect newer population estimates, causing a step change discontinuity in estimates before and after this period. ↩
-
Data from October to December 2023 onward has been ‘reweighted’ by the ONS to reflect newer population estimates, causing a step change discontinuity in estimates before and after this period. Estimates for July to September 2023 are unavailable due to quality concerns. ↩
-
Data from October to December 2023 onward has been ‘reweighted’ by the ONS to reflect newer population estimates, causing a step change discontinuity in estimates before and after this period. Estimates for July to September 2023 are unavailable due to quality concerns ↩
-
See Labour market overview, UK – Office for National Statistics ↩
-
See Labour Force Survey: planned improvements and its reintroduction – Office for National Statistics ↩
-
See Labour Force Survey performance and quality monitoring reports – Office for National Statistics ↩