Gender and Ethnicity Pay Gap Report as at 31 March 2023
The Regulator of Social Housing’s data on the difference in employees’ average earnings as at 31 March 2023.
Applies to England
Documents
Details
Contents
Gender pay gap
- Gender identity
- How the Gender Pay Gap is worked out
- Our gender pay gap at 31 March 2023
- Pay quartiles
- Our declaration
- What are we doing about the gap?
Ethnicity pay gap
- What do we mean by ethnicity?
- How the Ethnicity Pay Gap is worked out
- Our ethnicity pay gap at 31 March 2023
- Pay quartiles
- Our ethnicity pay gap journey
- What are we doing about the gap?
Foreword
This report reflects our gender and ethnicity pay gap data as of March 2023, which we annually report in arrears.
Although our staff count falls below the 250-employee threshold for mandatory gender pay gap reporting, we have voluntarily chosen to publish our findings for the fifth year, believing it aligns with best practices and promotes transparency in pay across the public sector.
We continue to strive for an inclusive, welcoming, and fair environment for all members of our team. These plans encompass various aspects of our operations, from recruitment and promotions to training and mentorship, all aimed at eliminating barriers and promoting equal opportunities. The ultimate goal is to ensure that every member of our organisation is provided with a fair and equal path to success to support the regulator in driving change in the social housing sector to deliver more and better social housing.
Gender Identity
In accordance with the current requirements for reporting on the gender pay gap, our approach involves categorising gender into male and female within our data classification.
It is important to note that we define gender in accordance with the classifications provided by His Majesty’s Revenue and Customs (HMRC), which categorise individuals as male or female, in our data.
In the context of this report, we have employed the terms ‘gender,’ ‘male,’ and ‘female,’ understanding that they typically relate to biological sex. However, it’s important to acknowledge that for some individuals, these terms may not fully encapsulate their gender identity.
How the Gender Pay Gap is worked out
In 2017, the government introduced a statutory requirement for organisations with 250 or more employees to report annually on their gender pay gap. Government departments are covered by the Equality Act 2010 (Specific Duties and Public Authorities) Regulations 2017 which came into force on 31 March 2017. These regulations underpin the Public Sector Equality Duty and require the relevant organisations to annually publish their gender pay gap data on:
- Mean and median gender pay gap in hourly pay,
- Mean and median bonus gender pay gap,
- Proportion of men and women receiving a bonus payment; and
- Proportion of men and women in each pay quartile.
The gender pay gap shows the difference in the average pay between all men and women in a workforce. Mean and median gender pay gap figures are based on a comparison of men and women’s hourly pay across the organisation irrespective of grade, which means that the gap shows the difference in the average pay between all men and women in the organisation’s workforce.
-
The mean figure is the percentage difference between the mean average hourly rates of men and women’s pay.
-
The median figure is the percentage difference between the midpoints in the ranges of men and women’s pay.
-
The bonus gap refers to bonus payments paid to men and women employees during the 12 months period prior to the snapshot date.
Our gender pay gap at 31 March 2023
Our figures at 31 March 2023
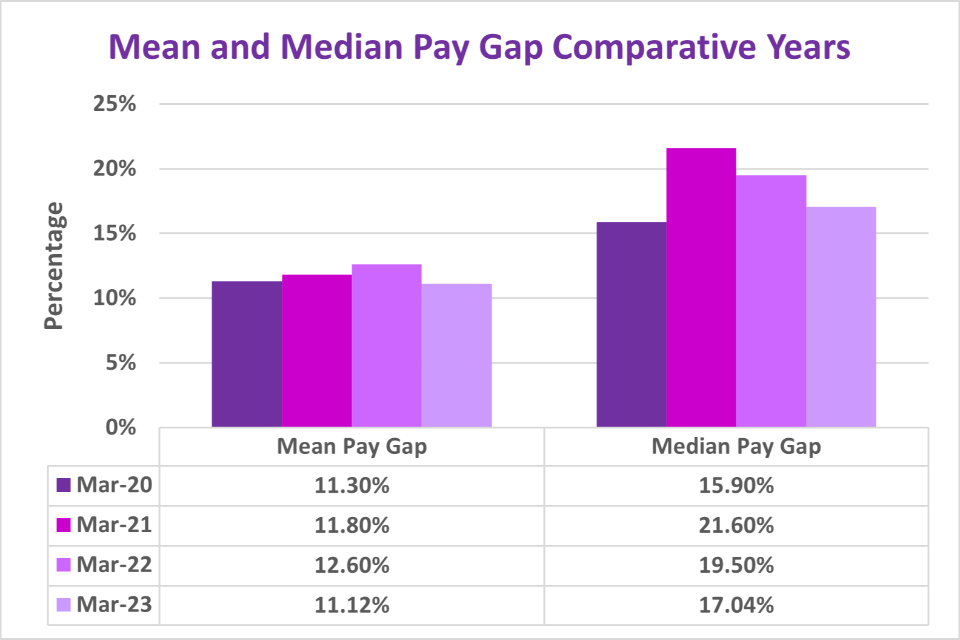
Data table
| Mar-20 | Mar-21 | Mar-22 | Mar-23 | |
|---|---|---|---|---|
| Mean Pay Gap | 11.30% | 11.80% | 12.60% | 11.12% |
| Median Pay Gap | 15.90% | 21.60% | 19.50% | 17.04% |
Pay Gap Analysis:
The examination of both mean and median pay at the regulator reveals a gender pay gap that generally benefits men. It is important to note that these gaps do not signify a significant difference in pay between male and female employees at any specific role grade within the organisation.
The primary drivers behind these gaps are the overall demographics of the organisation and the higher representation of female staff in the lower pay quartiles, as shown later in this report.
Bonus pay gap
RSH operates a modest annual bonus pay scheme on a fixed scale, with awards based on individual staff performance in their role. During the year, bonuses were paid at set values of:
- £0 where individual performance does not meet expectations
- £285 where performance meets expectations, and
- £575 where performance exceeds expectations.
Bonuses are awarded irrespective of gender or any other protected characteristic. To be considered for a bonus, staff must first have successfully completed their six-month probationary period following joining the organisation.
Gender bonus values
| Count | Mean Bonus Pay | Media Bonus Pay | |
|---|---|---|---|
| Male | 82 | £340.38 | £285.00 |
| Female | 135 | £348.84 | £285.00 |
| Difference (£) | N/A | -£8.45 | £0.00 |
| #Difference (%) | N/A | -2.48% | 0.00% |
It is common practice in organisations to proportionally adjust non-consolidated bonus payments based on the number of hours worked by individual employees. Consequently, part-time employees typically receive a lower bonus compared to their full-time counterparts.
In 2022, there was a mean bonus pay gap of 2.9%, favouring men, which contrasts with 2021 when there was a mean bonus gap of 1.6%, favouring women. However, in 2023, there was a mean bonus pay gap of 2.5%, favouring women.
Pay quartiles
The data in the gender pay gap quartiles table provides insights into the distribution of male and female employees across different pay quartiles within the organisation over four years.
| Mar-20 | Mar-21 | Mar-22 | Mar-23 | |||||
|---|---|---|---|---|---|---|---|---|
| Pay Quartile | Female | Male | Female | Male | Female | Male | Female | Male |
| Top Quartile | 55.00% | 45.00% | 54.50% | 45.50% | 51.10% | 48.90% | 50.00% | 50.00% |
| Upper Middle Quartile | 60.00% | 40.00% | 54.50% | 45.50% | 59.60% | 40.40% | 65.40% | 34.60% |
| Lower Middle Quartile | 70.00% | 30.00% | 75.00% | 25.00% | 64.60% | 35.40% | 56.60% | 43.40% |
| Bottom Quartile | 65.00% | 35.00% | 67.40% | 32.60% | 75.00% | 25.00% | 73.60% | 26.40% |
| Total | 63.00% | 37.00% | 62.90% | 37.10% | 62.60% | 37.40% | 61.40% | 38.60% |
It reveals:
Top Quartile:
In March 2020, 55% of employees in the top quartile were female. This has reduced over the intervening years to 50% in 2023.
Upper Middle Quartile:
In the upper middle quartile, the female representation started at 60% in March 2020 and has risen to 65.4% in March 2023.
Lower Middle Quartile:
Female representation in the lower middle quartile started at 70% in March 2020 and has dropped to 56.6% in March 2023.
Bottom Quartile:
In the bottom quartile, female representation began at 65% in March 2020, and had grown to 73.6% in March 2023.
Total Workforce:
The data also provides the overall gender distribution in the organisation. The percentage of female employees decreased slightly over the years, but the gender balance has on the whole has remained stable.
Our Declaration
Our calculations follow the legislative requirements as set out in the Equality Act 2010 (Specific Duties & Public Authorities) Regulations 2017. The data includes all staff who were deemed to be full paid relevant employees at 31 March 2023
What are we doing about the gap?
Over the period 2020 to 2023 we have expanded from 154 staff in March 2020 to 218 staff in March 2023 with significant levels of recruitment and a shift in quartile boundaries resulting in fluctuations in the annual snapshot pay gap information. This makes it more difficult to identify underlying trends. While the gender pay gap has decreased, we are working to reduce this further. We have implemented a number of changes and initiatives directed at ensuring equality and diversity in recruitment.
Our commitment to fostering a more inclusive regulator is detailed in our recently updated equality, diversity and inclusion strategy.
What do we mean by ethnicity?
The Office for National Statistics observes that defining what constitutes an ethnic group lacks consensus, as it is a self-defined and subjectively significant concept for individuals. Given the dynamic and multifaceted nature of ethnicity, there are several approaches for measuring ethnic groups, which have evolved over time. These approaches encompass factors such as shared ancestry, cultural elements, identity, religious beliefs, language, and physical characteristics. What is widely acknowledged, however, is that ethnicity encompasses a combination of all these elements and more.
The ethnicity pay gap reflects the contrast in average earnings between employees from minority ethnic backgrounds and those categorised as ‘White’ (i.e. non-Black, Asian and Minority Ethnic (BAME)) within a workforce.
When the percentage is positive, it signifies that the average pay of a white employee is higher than that of an employee from a minority ethnic group. The greater the positive percentage, the wider the ethnicity pay gap. Conversely, a negative percentage indicates that the average pay of the minority ethnic group surpasses that of the White group.
It’s essential to distinguish the ethnicity pay gap from equal pay. Ethnic pay disparities primarily do not concern individuals from non-BAME and other ethnic backgrounds receiving distinct compensation for the same job. The Equality Act of 2010 prohibits racial discrimination, both direct and indirect, against employees. Therefore, unless there is a violation of existing legal provisions, discrepancies in pay between ethnic groups are typically attributable to factors other than explicit discrimination that impose disadvantages on individuals from ethnic minorities.
How the Ethnicity Pay Gap is worked out
There is currently no guidance on the pay measures that need to be reported as part of Ethnicity Pay Gap reporting nor any guidance on the methodology for calculation. Therefore, RSH continues to take the approach to mirror the legislated pay measures used for Gender Pay Gap reporting, and the methods of calculation, but applied through a lens of ethnicity (where outcomes for ethnic minority groups (BAME) are compared against non-BAME groups).
This approach allows us to assess and report on the ethnicity pay gap with a consistent and structured framework, despite the absence of specific guidance. We remain committed to transparency and the pursuit of fairness, utilising these measures to gauge and address pay disparities based on ethnicity within RSH.
Our ethnicity pay gap at 31 March 2023
In essence, the ethnicity pay gaps at the regulator primarily stem from the organisation’s demographic makeup, particularly the lack of ethnic diversity in higher paid roles. Addressing these gaps involves providing opportunities in recruitment and for career development and advancement within the organisation to shift that demographic balance.
Our pay gap as at March 2023 with comparatives for the preceding three years are as follows:
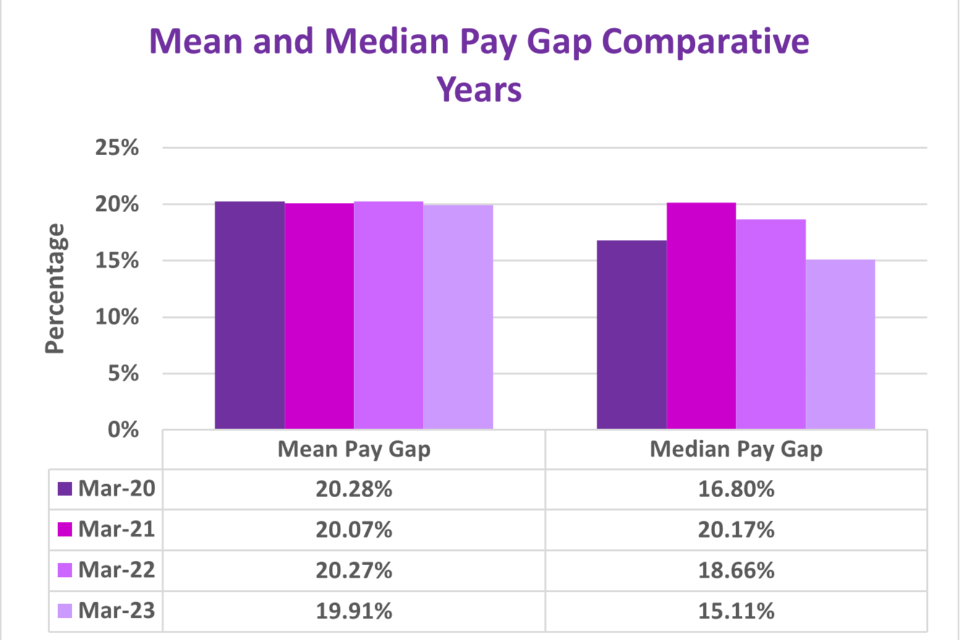
Data table
| March 2020 | March 2021 | March 2022 | Mar 2023 | |
|---|---|---|---|---|
| Mean Pay Gap | 20.28% | 20.07% | 20.27% | 19.91% |
| Median Pay Gap | 16.80% | 20.17% | 18.66% | 15.11% |
Bonus pay gap
Bonuses are awarded irrespective of gender or any other protected characteristic. To be considered for a bonus, staff must first have successfully completed their six-month probationary period following joining the organisation.
Ethnicity bonus values 2023
| Mean bonus pay | Median Bonus pay | ||
|---|---|---|---|
| Non-BAME | £350.37 | Non-BAME | £285.00 |
| BAME | £317.42 | BAME | £285.00 |
| Difference (£) | £32.95 | Difference (£) | £0.00 |
| Difference (%) | 9.40% | Difference (%) | 0.00% |
Bonus pay gap
| March 2020 | March 2021 | March 2022 | March 2023 | |
|---|---|---|---|---|
| Mean bonus gap | 21.18% | 3.81% | -1.35% | 9.4% |
| Median bonus gap | 0 | 0 | 0 | 0 |
It is common practice in organisations to proportionally adjust non-consolidated bonus payments based on the number of hours worked by individual employees. Consequently, part-time employees typically receive a lower bonus compared to their full-time counterparts.
In 2022, there was a mean bonus pay gap of 1.35%, favouring BAME employees, which contrasts with 2021 when there was a mean bonus gap of 3.81% favouring non-BAME employees. In 2023, there was a mean bonus pay gap of 9.4%, favouring non-BAME.
Pay quartiles
| Quartile | Mar-20 | Mar-21 | Mar-22 | Mar-23 | ||||
|---|---|---|---|---|---|---|---|---|
| Pay quartile | White % | BAME % | White % | BAME % | White % | BAME % | White % | BAME % |
| Top quartile | 97.50% | 2.50% | 97.70% | 2.30% | 97.83% | 2.17% | 97.96% | 2.04% |
| Upper middle quartile | 82.10% | 17.90% | 84.10% | 15.90% | 78.26% | 21.74% | 76.92% | 23.08% |
| Lower middle quartile | 80.00% | 20.00% | 79.50% | 20.50% | 89.36% | 10.64% | 90.38% | 9.62% |
| Bottom quartile | 77.50% | 22.50% | 74.40% | 25.60% | 65.96% | 34.04% | 67.31% | 32.69% |
| Total | 84.30% | 15.70% | 84.00% | 16.00% | 82.80% | 17.20% | 82.93% | 17.07% |
In March 2023, BAME employees constitute 17.07% of the total workforce, highlighting RSH’s overall ethnic diversity. However, there are notable variations in BAME representation across different pay quartiles since 2020, notably a significant increase in the proportion of BAME staff in the Upper Middle quartile. As previously noted, we have seen significant levels of recruitment over the period 2020 to 2023 and a shift in quartile boundaries resulting in fluctuations in the annual snapshot pay gap information. This makes it more difficult to identify underlying trends, but we have maintained the overall, diversity of the organisation throughout that growth.
Our ethnicity pay gap journey
Comparing the results of the ethnicity pay gap at The Regulator of Social Housing for the last four years, we continue to strive to close our pay gap. Progress has been modest overall as whilst we have increased diversity in the Upper Middle and Bottom quartiles the net impact has been limited. In particular, we have not seen an increase in diversity in the Top quartile which will be critical to reducing the pay gap.
What are we doing about the gap?
Our commitment to fostering a more inclusive organisation is detailed in our equality, diversity and inclusion strategy. Our overarching diversity and inclusion goals are strategically designed to have a positive influence on our overall diversity which will, when successful, act to close the pay gap. With regards to specific actions, we will direct our efforts toward areas where we anticipate the most significant impact in the year 2023/24.