Football-related arrests and banning orders season 2014 to 2015
Published 26 November 2015
Applies to England and Wales

© Crown copyright 2015
This publication is licensed under the terms of the Open Government Licence v3.0 except where otherwise stated. To view this licence, visit nationalarchives.gov.uk/doc/open-government-licence/version/3 or write to the Information Policy Team, The National Archives, Kew, London TW9 4DU, or email: psi@nationalarchives.gov.uk.
Where we have identified any third party copyright information you will need to obtain permission from the copyright holders concerned.
This publication is available at https://www.gov.uk/government/statistics/football-related-arrests-and-banning-orders-season-2014-to-2015/football-related-arrests-and-banning-orders-season-2014-to-2015
1. Introduction
This release provides statistics on football-related arrests and banning orders in connection with regulated international and domestic football matches[footnote 1] involving teams from, or representing, England and Wales.
Football-related arrests cover all arrests, designated in law under Schedule 1 of the Football Spectators Act 1989[footnote 2] (as amended), reported by police to the United Kingdom Football Policing Unit (UKFPU). This includes football-specific offences (e.g. pitch incursion and throwing missiles inside a stadium) and a range of generic criminal offences committed in connection with a football match (such as arrests at any place within a period of 24 hours either side of a match).
Football banning orders are issued by the courts following a conviction for a football-related offence[footnote 3] , or made on complaint by a local police force[footnote 4] .
This is the third season that information on football-related arrests by the British Transport Police (BTP) have been included in the figures (previously they were published by the BTP). As a result, caution should be taken when comparing football-related arrests prior to the 2012 to 2013 football season. Information on football banning orders has always been included in the figures.
The statistics in this release have been submitted to UKFPU by all relevant police forces (and other sources such as the courts) in England and Wales and the British Transport Police. Information on football-related arrests covers the 2014 to 2015 football season whilst information on football banning orders is reported as at 8 September 2015.
2. Key facts
2.1 Football banning orders
Based on information as at 8 September 2015:
- There were 2,181 football banning orders in force; this represents a decrease of 4% (-92) on the number of banning orders as at 3 September 2014.
- The Premier League accounted for 37% (802) of the total number of banning orders.
- There has been a steady decline in the total number of football banning orders over the last five years, falling by almost a third (31%) from a high of 3,174 as at 29 November 2011.
- Since 4 September 2014, 484 new football banning orders have been issued; a decrease of 29% (-194) when compared with the previous year.
- The number of new football banning orders issued since 2010 to 2011 has decreased overall (from 960 in 2010 to 2011 to 484 in 2014 to 2015) with the exception of 2013 to 2014 where there was an increase of 44% (207) on the previous year.
2.2 Football-related arrests
Based on information for the 2014 to 2015 football season:
- There were 1,873 football-related arrests; a decrease of 18% (-400) from the previous season.
- There has been a steady decrease in football-related arrests over the last five football seasons with the exception of the 2012 to 2013 season, which increased by 4% (93) from the previous season.
- The highest number of football-related arrests occurred within the Premier League, 31% (580); the second highest occurred within the Championship, 29% (538).
- There were 4.9 football-related arrests per 100,000 attendees[footnote 5] .
- The Football Conference had the highest football-related arrest rate, 7.4 arrests per 100,000 attendees. In comparison, the lowest were the European competitions[footnote 6] and the Football League Trophy with 1.8 arrests per 100,000 attendees.
- Of the1,873 football-related arrests, the three most common offence types were public disorder (34%), alcohol offences (22%) and violent disorder (16%).
3. Football banning orders
Banning orders are issued by the courts following a conviction for a football-related offence[footnote 7], or after a complaint by the Crown Prosecution Service or a local police force[footnote 8]. For an order to be made, the court must be satisfied that there are reasonable grounds to believe that making a banning order would help to prevent violence or disorder at or in connection with any regulated football match.
Orders are not imposed on individuals solely on the basis of minor convictions, like alcohol offences or similar misdemeanours. They can last between three and 10 years and can be customised to address individual behaviour patterns. Breach of an order is a criminal offence and is punishable by a maximum sentence of six months in prison or a fine of up to £5,000, or both[footnote 9].
The number of banning orders does not represent the number of individuals with banning orders as one individual could be subject to more than one banning order although in general one banning order translates to one individual. Furthermore, an individual may have a ban which has conditions which apply to more than one football club therefore this would mean that the same ban would appear more than once in the figures.
There is not necessarily a correlation between the number of arrests in a given season and the number of new banning orders for the same year. This is because an individual with a ban can receive the ban one of two ways, either: following a conviction, i.e. the individual was arrested for a football-related offence which led to a ban; or the individual received a ban via the civil route (where the individual was not arrested), for example intelligence had been gathered on a particular individual and this led to a ban via the courts. In addition, the time taken to process a ban can vary in length and could mean that an individual, for example, arrested during the 2013 to 2014 season would be included in the 2013 to 2014 arrest figures but due to the time lag in processing the ban would not be included in the banning order figures until 2014 to 2015.
3.1 Football banning orders by competition
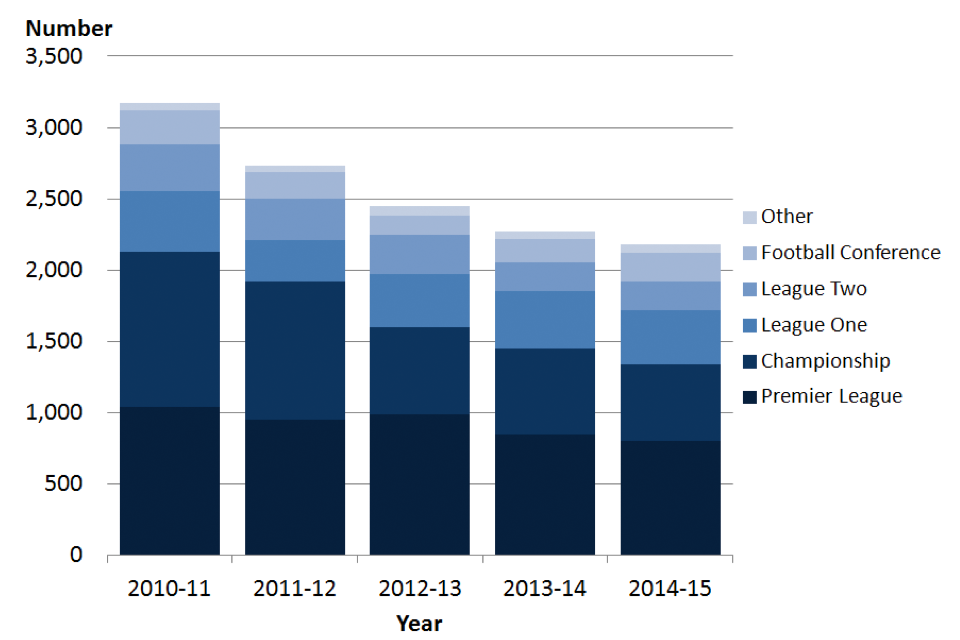
Figure 1 shows that there were 2,181 football banning orders in force as at 8 September 2015 representing a decrease of 4% from 2,273 as at 3 September 2014. This continues the downward trend seen in the number of football banning orders in the last five years, falling by almost a third (31%) from 3,174 as at 29 November 2011.
The Premier League accounted for the largest proportion of banning orders, 37% (802) of the total. The Championship was the second largest, accounting for around a quarter (534) of the total. The Premier League and Championship combined have accounted for the largest proportion of football banning orders in each of the last 5 years.
Figure 1: Number of football banning orders in force in England and Wales by competition, 2010 to 2011 to 2014 to 2015
.
Source: Home Office, Table 2
Notes:
- As of the start of the 2015 to 2016 season, the Football Conference changed its name to the National League.
-
Caution should be taken when making year on year comparisons as there are differences in when the differences in when the banning order data were extracted:
2010 to 2011 is as at 29 November 2011,
2011 to 2012 is as at 09 November 2012,
2012 to 2013 is as at 20 September 2013,
2013 to 2014 is as at 03 September 2014,
2014 to 2015 is as at 08 September 2015 - Previous releases of this publication grouped football clubs according to the league they belonged to as at September of the publication year for information on football banning orders. This release groups football clubs according to the league that clubs played in throughout the season; while it is estimated that this change has made minimal difference to total figures, a degree of caution should be taken when making comparisons prior to 2014 to 2015.
3.2 New football banning orders by competition
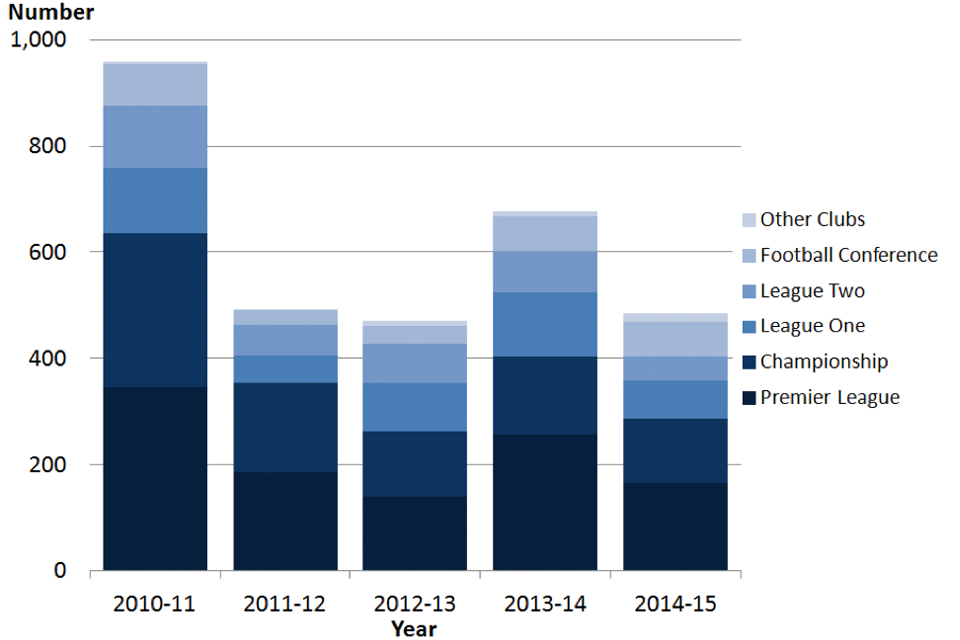
Around one in five (22% or 484) of the 2,181 football banning orders that were in force as at 8 September 2015, were new banning orders imposed since 4 September 2014. This represents a decrease of 29% (-194) from the 678 new banning orders that were imposed in the previous year.
Figure 2 shows the number of new banning orders imposed since 2010 to 2011. Overall, the number of new banning orders has decreased, halving from a 5-year period high of 960 in 2010 to 2011 to 484 in 2014 to 2015. The largest fall was between 2010 to 2011 and 2011 to 2012, down from 960 in 2010 to 2011 to 493 in 2011to 2012. Since then, the number of new banning orders issued each year has remained at around 500, with the exception of 2013 to 2014 where there was a spike in the number of new banning orders issued (a 44% or 207 increase on the 2012 to 2013 figure).
Just over a third (34% or 166) of all new banning orders issued in 2014 to 2015 was accounted for by the Premier League; this was followed by the Championship accounting for a quarter (25% or 121) of new banning orders. The Premier League and Championship combined accounted for the largest proportion of new banning orders issued in each of the last five years.
Figure 2: Number of new football banning orders issued in England and Wales by competition, 2010 to 2011 to 2014 to 2015
.
Source: Home Office, Table 4
Notes:
- As of the start of the 2015 to 2016 season, the Football Conference changed its name to the National League.
- Previous releases of this publication grouped football clubs according to the league they belonged to as at September of the publication year for information on football banning orders. This release groups football clubs according to the league that clubs played in throughout the season; while it is estimated that this change has made minimal difference to total figures, a degree of caution should be taken when making comparisons prior to 2014 to 2015.
4. Football-related arrests
4.1 Football-related arrests by competition
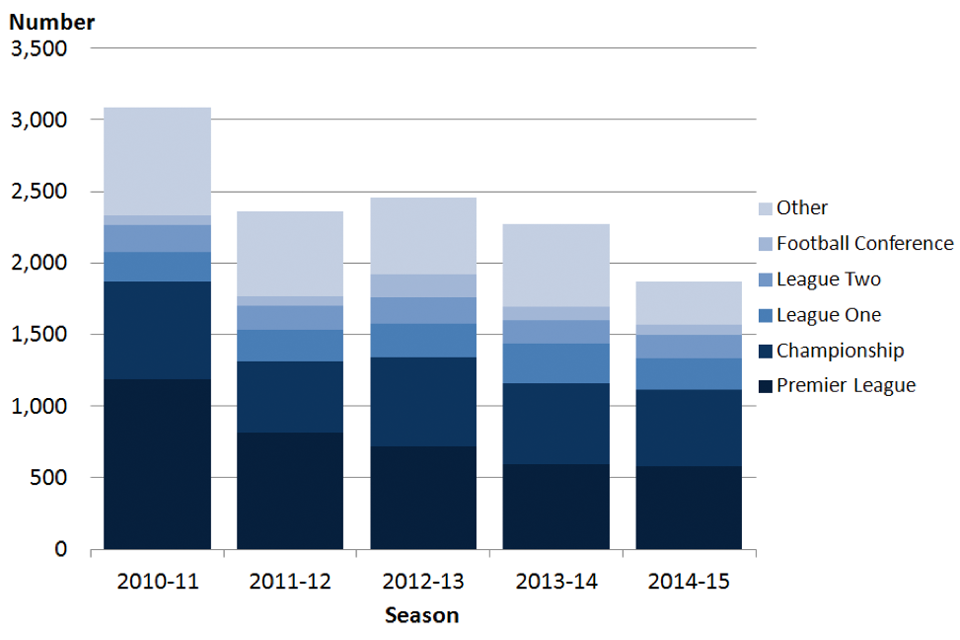
In the 2014 to 2015 football season there were 1,873 football-related arrests by relevant police forces in connection with regulated football matches involving teams from, or representing, England and Wales. This represents a decrease of 18% (-400) from the 2013 to 2014 football season.
Figure 3 shows a steady decline in the number of football-related arrests over the last five seasons with the exception of the 2012 to 2013 season, where there was an increase of 4% (93) when compared with the previous season.
Of the 1,873 football-related arrests, the largest proportion occurred within the Premier League, 31% (580). The second largest occurred within the Championship accounting for 29% (538). The Premier League and Championship combined accounted for the largest proportion of football-related arrests in each of the last five seasons.
Figure 3: Football-related arrests in England and Wales by competition, 2010 to 2011 to 2014 to 2015 football seasons
.
Source: Home Office,Table 12
Notes:
- ‘Other’ includes FA cup, League cup, Football League Trophy, European competitions, Internationals, Under-21 internationals, Pre-season friendlies, Community Shield and UEFA super cup.
- Figures exclude British Transport Police arrests.
- As of the start of the 2015 to 2016 season, the Football Conference changed its name to the National League.
Other competitions include domestic cups, European and International matches. Of the European and International matches played outside of England and Wales, there were 26 football-related arrests, 18 of which occurred in International competitions and the other eight in European competitions.
4.2 Football-related arrest rate per 100,000 attendees by competition
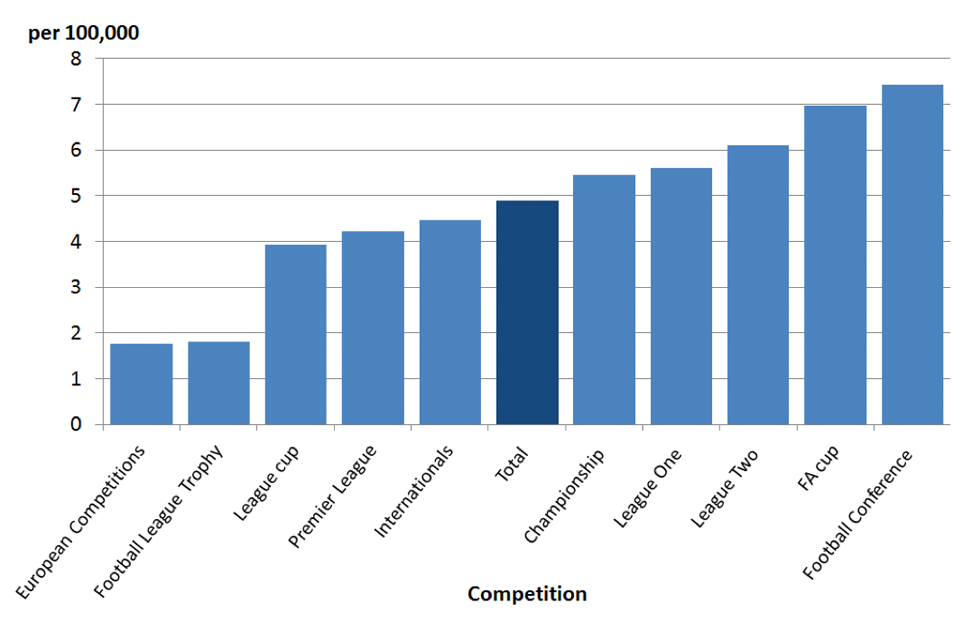
The football-related arrest rate in the 2014 to 2015 season was 4.9 arrests per 100,000 attendees. Although the Premier League accounted for the highest number of football-related arrests, it had an arrest rate of 4.2 arrests per 100,000 attendees. The Football Conference had the highest arrest rate of 7.4 arrests per 100,000 attendees whilst European competitions and the Football League Trophy both had the lowest arrest rate of 1.8 arrests per 100,000 attendees.
Figure 4: Football-related arrest rate per 100,000 attendees in England and Wales by competition, 2014 to 2015 season
.
Source: Arrests per 100,000 figures are derived from two sources: Home Office (Arrest data) and © Sky Sports Football Yearbook 2015-2016 (Attendance figures), Table 17
Notes:
- Excludes ‘other’ competitions which include Community Shield, Under-21 internationals, pre-season friendlies and UEFA super cup
- As of the start of the 2015 to 2016 season, the Football Conference changed its name to the National League
4.3 Football-related arrests by offence type
Of the 1,873 football-related arrests in the 2014 to 2015 football season, the three most common offence types were public disorder (34%), alcohol offences (22%) and violent disorder (16%). These combined, account for the largest proportion of all football-related arrests in each of the last five years (see Table 11).
There has been a general decrease in most offence types in the last five football seasons. As mentioned previously in section 4.1, there was a slight increase in the total number of football-related arrests in the 2012 to 2013 football season, up by 93 arrests (4%) when compared with the 2011to 2012 season. The main driving force for this was an increase in the number of football-related arrests for violent disorder in the 2012 to 2013 season; an increase of 281 arrests (103%) on the previous season. This was the largest increase of all offence types in the 2012 to 2013 season.
Of the ‘Other’ offence types, the number of football-related arrests for racist and indecent chanting has fluctuated over the last five years. However figures have remained low in comparison to other offence types. Football-related arrests for possession of pyrotechnics showed a large increase over a 4-year period rising from eight arrests in the 2010 to 2011 season to 188 arrests in the 2013 to 2014 season. This decreased by 36% to 120 arrests in the 2014 to 2015 season (see Tables 10 and 11).
5. Data quality
5.1 Data coverage and collection
Statistics in this release cover the number of football-related arrests and football banning orders for all regulated football matches (including pre-season friendlies) involving teams from, or representing, England and Wales. The arrests data cover the period of the 2014to 2015 football season which runs from 1 July to 31 May whilst the banning orders data are as at 8 September 2015.
Throughout the football season, football-related arrests and banning order data are collected and submitted to UKFPU from all relevant police forces in England and Wales and the British Transport Police. Banning orders data are also submitted by other sources such as the courts. Following the court’s imposition of a football banning order, the Football Banning Orders Authority, part of UKFPU, continues with the administration of the banning order. The data are then subsequently shared with Home Office statisticians. This statistical release provides additional time series compared with previous years and also includes some new tables. Please see tables 2,4,10,11,12 and 13.
5.2 Quality assurance
Previous releases of the ‘Football-related arrests and banning orders’ publication were prepared and published by Home Office policy officials. The publication process including the preparation of the final accompanying data tables has now been transferred to Home Office statisticians who prepared this publication. However, UKFPU will continue to receive and collate information submitted by police forces.
Once all data have been received and collated by the UKFPU, officials carry out a sense check and query any outliers or anomalies with the respective dedicated football officer (DFO). Following this, the data undergo further scrutiny by Home Office statisticians, including validation and variance checks. Data which still appear to be outliers or anomalies are sent to UKFPU to investigate and follow up with the relevant DFO.
5.3 Comparability with figures pre 2014 to 2015 football season
In previous publications, football banning orders were grouped by football clubs according to the league they belonged to as at September of the publication year (e.g. in the September 2014 publication, the Premier League football banning orders for 2013 to 2014 related to the Premier League composition as at September 2014). In reviewing this 2015 release, Home Office statisticians decided in future to present the banning orders data so that clubs were grouped according to the league that they were playing in during the 2014 to 2015 football season. Whilst the numerical totals are little changed, by year, a degree of caution should be made when making comparisons between the latest year and years prior to 2014 to 2015.
Additionally, when considering any time series of arrests or football banning orders, by league, it should be noted that the changing levels are likely to be affected by the composition of the leagues (i.e. due to teams being promoted and relegated each year between the individual leagues or well known specific rivalries) rather than reflect the changing behaviour of supporters in the actual leagues themselves.
5.4 Developing the football-related arrests and banning orders statistical release
Home Office statisticians will continue to improve the quality of the outputs in this release so that they are more aligned with National Statistics publications. For example, developing a comprehensive user guide which will document definitions, processes and uses made of the statistics. In addition, statisticians will:
- assess the feedback gained from the user survey to ensure users’ needs are met and improvements are made where possible; authors will document the findings in the next release;
- review the publication schedule to ensure more timely and regular statistics are provided
- review the coverage of the statistics to ensure a more consistent approach is taken for the time periods covered by the data
- review the quality assurance processes involved at all stages
6. Corrections/Revisions
Corrections and revisions follow the Home Office’s statement of compliance with the Code of Practice for Official Statistics (page 6).
7. Feedback and enquiries
The Home Office is seeking feedback on this publication so that we can assess how well it meets our users’ needs and make improvements where possible. If you have not already done so, please could you complete a short 5-minute survey.
If you have any comments, suggestions or enquiries, please email them to the Chief Statistician’s Unit, the Home Office Unit which produced the statistics, at: CSU.Statistics@homeoffice.gov.uk.
8. Acknowledgements
This publication and the accompanying tables were prepared by staff in the Chief Statistician’s Unit, part of the Home Office Science Group.
We would like to thank UK Football Policing Unit for collating the data and dedicated football officers within police forces for collecting and submitting the data.
-
Article 3 of the Football Spectators (Prescription) Order 2004 (as amended) describes a regulated match. ↩
-
Section 14a (Schedule 1) of the Football (Disorder) Act 2000 ↩
-
Section 14b (Schedule 1) of the Football (Disorder) Act 2000 ↩
-
Football-related arrest rate excludes ‘other’ competitions which include Community Shield, Under-21 internationals, pre-season friendlies and UEFA super cup ↩
-
European competitions comprises of the Champions League and Europa League ↩
-
Section 14a (Schedule 1) of the Football (Disorder) Act 2000 ↩
-
Section 14b (Schedule 1) of the Football (Disorder) Act 2000 ↩
-
The Criminal Justice Act 1982 sets out The standard scale of fines for summary offences ↩