Football-related arrests and banning orders, England and Wales: season 2015 to 2016
Published 24 November 2016
Applies to England and Wales

© Crown copyright 2016
This publication is licensed under the terms of the Open Government Licence v3.0 except where otherwise stated. To view this licence, visit nationalarchives.gov.uk/doc/open-government-licence/version/3 or write to the Information Policy Team, The National Archives, Kew, London TW9 4DU, or email: psi@nationalarchives.gov.uk.
Where we have identified any third party copyright information you will need to obtain permission from the copyright holders concerned.
This publication is available at https://www.gov.uk/government/statistics/football-related-arrests-and-banning-orders-england-and-wales-season-2015-to-2016/football-related-arrests-and-banning-orders-england-and-wales-season-2015-to-2016
1. Introduction
This release provides statistics on football-related arrests and banning orders in connection with regulated international and domestic football matches[footnote 1] involving English and Welsh clubs and the national teams.
Football-related arrests are those to which Schedule 1 of the Football Spectators Act 1989[footnote 2] (as amended) applies, reported by police to the United Kingdom Football Policing Unit (UKFPU). This includes football-specific offences (such as pitch incursion and throwing missiles inside a stadium) and a range of generic criminal offences committed in connection with a football match (at any place within a period of 24 hours either side of a match).
This is the fourth season that information on football-related arrests by the British Transport Police (BTP) have been included in the accompanying data tables, ‘Football-related arrests and banning order statistics, England and Wales, season 2015 to 2016’ data tables, previously they were published separately by BTP. Therefore caution should be taken when comparing football-related arrests prior to the 2012 to 2013 season.
Football banning orders are preventative measures issued by the courts either following a conviction for a football-related offence[footnote 3], or following complaint by a local police force including BTP, or the Crown Prosecution Service[footnote 4].
Caution should be taken when making season-on-season comparisons with regards to statistics on new banning orders, as the time period covering each data extraction varied from year to year.
- 2011 to 2012 (data reference dates: 30 Nov 2011 to 09 Nov 2012)
- 2012 to 2013 (data reference dates: 10 Nov 2012 to 20 Sep 2013)
- 2013 to 2014 (data reference dates: 21 Sep 2013 to 03 Sep 2014)
- 2014 to 2015 (data reference dates: 04 Sep 2014 to 08 Sep 2015)
- 2015 to 2016 (data reference dates: 31 Jul 2015 to 01 Aug 2016)[footnote 5]
The statistics in this release are based on information provided by UKFPU. The statistics on football-related arrests were submitted by all 43 police forces in England and Wales and BTP whilst information on banning orders was taken from the Football Banning Order Authority’s (part of UKFPU) records[footnote 6].
Statistics on football-related arrests cover the 2015 to 2016 season (1 July 2015 to 10 July 2016 to incorporate Euro 2016) and are presented by competition, offence type, location and arrest rate per 100,000 population. Information on the total number of football banning orders in force is reported as at 1 August 2016 (data reference dates for new banning orders issued in the 2015 to 2016 season was 31 July 2015 to 1 August 2016). Banning orders are presented by competition, club and trends over the last five seasons.
The user guide to ‘Football-related arrests and banning order statistics, England and Wales, 2015 to 2016 season’ provides additional information on this release. It includes the coverage of the data, quality and methodology, and information on the conventions used in the statistics, legislation and regulations.
The ‘Football-related arrests and banning order statistics, England and Wales, 2015 to 2016 season’ data tables provide supplementary data to those used in this release.
2. Headline figures
2.1 Football banning orders
Based on information as at 1 August 2016:
- there were 2,085 football banning orders in force, a decrease of 4% (-96) from the number of banning orders as at 8 September 2015
- supporters of Premier League clubs accounted for 30% (617) of the total number of banning orders
- there has been a steady decline in the total number of football banning orders in the last four seasons, falling by almost a quarter (-646) from a high of 2,731 on 9 November 2012
- the number of new banning orders issued between 31 July 2015 to 1 August 2016 was 542, an increase of 58 (12%) banning orders when compared with the previous season
- the number of new football banning orders issued in the last five seasons ranged from 471 to 678. There has been an overall increase of 49 (10%) new banning orders when compared with the 2011 to 2012 season
2.2 Football-related arrests
Based on information for the 2015 to 2016 season (1 July 2015 to 10 July 2016):
- there were 1,895 football-related arrests, an increase of 1% (22) on the previous season
- the highest number of football-related arrests were in connection with Championship matches, 25% (470)
- the number of football-related arrests over the last five seasons ranged from 1,873 to 2,456; however, there has been an overall decrease of 20% (-468) in football-related arrests since the 2011 to 2012 season
- there were 4.8 football-related arrests per 100,000 attendees[footnote 7]
- of the 1,895 football-related arrests, the three most common offence types were public disorder (31%), alcohol offences (20%) and violent disorder (19%)
3. Football banning orders
The statutory duration of a football banning order is a minimum period of three years and no more than five years. In cases where a custodial sentence was imposed for the original offence a minimum period of six years and no more than 10 years applies.
3.1 Football banning orders by club supported
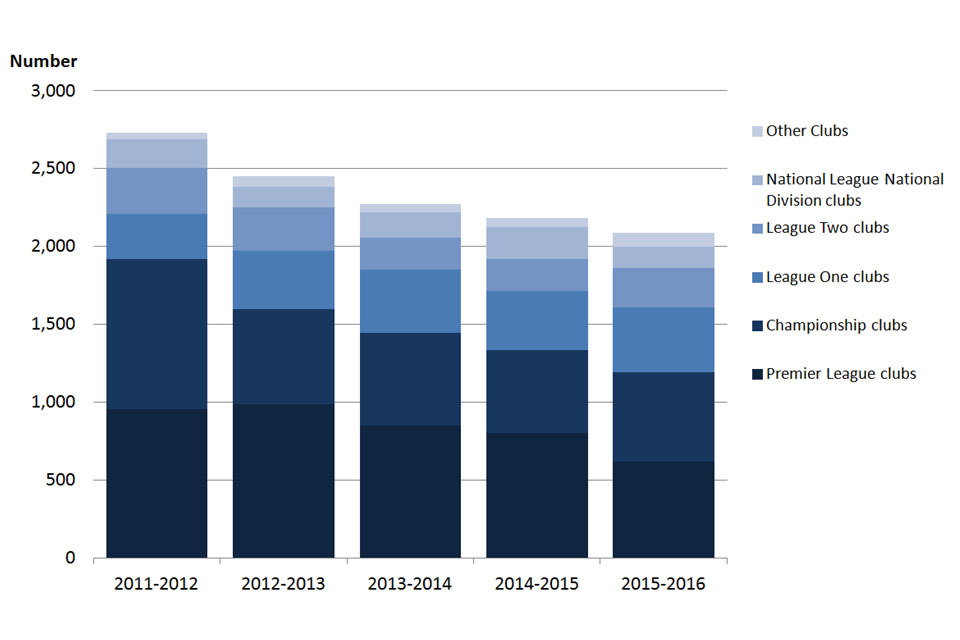
Figure 1 shows that there were 2,085 football banning orders in force as at 1 August 2016, representing a decrease of 4% from 2,181 as at 8 September 2015. This continues the downward trend seen in the number of football banning orders in the last four seasons, falling by almost a quarter from 2,731 on 9 November 2012.
Supporters of Premier League clubs accounted for the largest proportion of banning orders, 30% (617) of the total. Supporters of Championship clubs were the second largest, accounting for 28% (575) of the total. Supporters of Premier League and Championship clubs combined have accounted for the majority of football banning orders in each of the last five seasons.
Compared to last season, the largest numeric decrease in football banning orders was seen by supporters of Premier League clubs, falling by 185 (-23%). However, supporters of National League National Division clubs saw the largest proportional decrease of 31% (-64). Caution should be taken when comparing season-on-season changes by leagues as the composition of the leagues and divisions change every season following promotion and relegation of teams.
Figure 1: Number of football banning orders in force in England and Wales by club supported, from 2011 to 2012 season to 2015 to 2016 season
Not supplied by author.
Source: Home Office, Table 2.
Notes:
- Caution should be taken when making season-on-season comparisons as the date the banning order data were extracted varied from year to year:
2011 to 2012 is as at 09 Nov 2012
2012 to 2013 is as at 20 Sep 2013
2013 to 2014 is as at 03 Sep 2014
2014 to 2015 is as at 08 Sep 2015
2015 to 2016 is as at 01 Aug 2016 - From the 2014 to 2015 season, clubs have been presented in the league they played in throughout that season. Prior to this, clubs were grouped in the league they were in as at the time of publication (i.e. the current season). Therefore, caution should be taken when comparing figures prior to the 2014 to 2015 season.
- ‘Other clubs’ include supporters of clubs from outside of England and Wales involved in regulated football matches played in England and Wales who have received a football banning order. It also includes supporters of clubs playing below National League National Division level.
3.2 New football banning orders by club supported
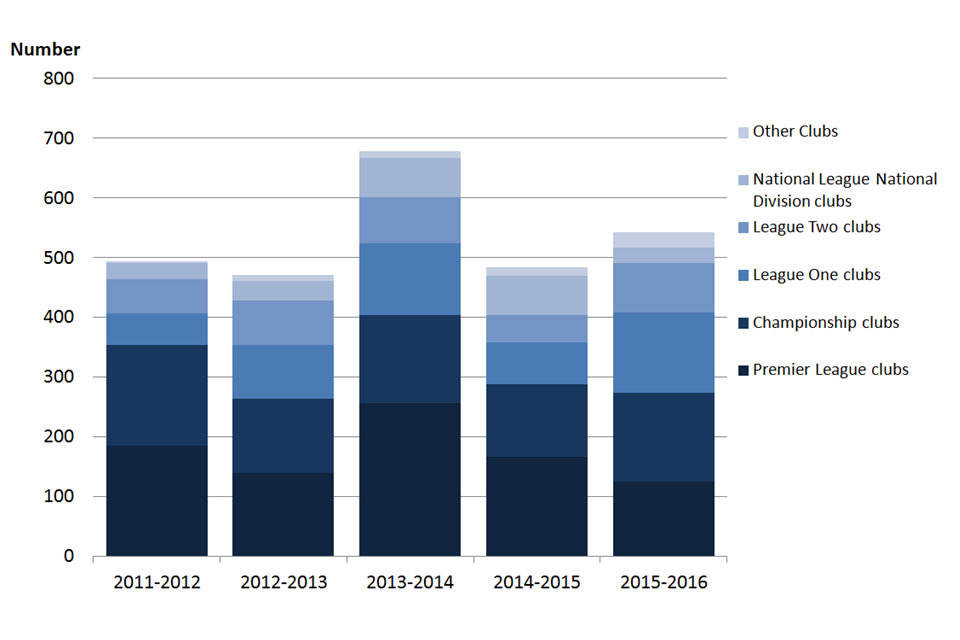
Of the 2,085 football banning orders that were in force as at 1 August 2016, around a quarter were new banning orders issued in the 2015 to 2016 season (31 July 2015 to 1 August 2016). This represents an increase of 58 (12%) when compared with the number of new banning orders issued as at 8 September 2015.
Figure 2 shows the number of new banning orders issued in each season since the 2011 to 2012 season. The number of new football banning orders issued in the last five years ranged from 471 to 678. Overall, there has been an increase of 49 (10%) new banning orders in this season compared with the number of new banning orders issued in the 2011 to 2012 season.
The highest proportion of new football banning orders issued in the 2015 to 2016 season were issued to supporters of Championship clubs, 28% (150) of new football banning orders. The second highest were issued to supporters of League One clubs, accounting for 25% (134) of new football banning orders. This is the first time in the last five seasons where supporters of Premier League clubs were not issued the highest proportion of new banning orders, 23% (124) of new football banning orders.
Clubs in League One experienced the largest numeric increase, 64 new football banning orders, while clubs in the Premier League experienced the largest numeric decrease, (-42) in the 2015 to 2016 season.
Figure 2: Number of new football banning orders issued each season in England and Wales by club supported, from 2011 to 2012 season to 2015 to 2016 season
Not supplied by author.
Source: Home Office, Table 4.
Notes:
- Caution should be taken when making season-on-season comparisons as the date the new banning order data were extracted varied from year to year:
2011 to 2012 time period: 30 Nov 2011 to 09 Nov 2012
2012 to 2013 time period: 10 Nov 2012 to 20 Sep 2013
2013 to 2014 time period: 21 Sep 2013 to 03 Sep 2014
2014 to 2015 time period: 04 Sep 2014 to 08 Sep 2015
2015 to 2016 time period: 31 Jul 2015 to 01 Aug 2016 - From the 2014 to 2015 season, clubs have been presented in the league they played in throughout that season. Prior to this, clubs were grouped in the league they were in as at the time of publication (i.e. the current season). Therefore, caution should be taken when comparing figures prior to the 2014 to 2015 season.
- ‘Other clubs’ include supporters of clubs from outside of England and Wales involved in regulated football matches played in England and Wales who have received football banning order. It also includes supporters of clubs playing below National League National Division level.
4. Football-related arrests
4.1 Football-related arrests by competition
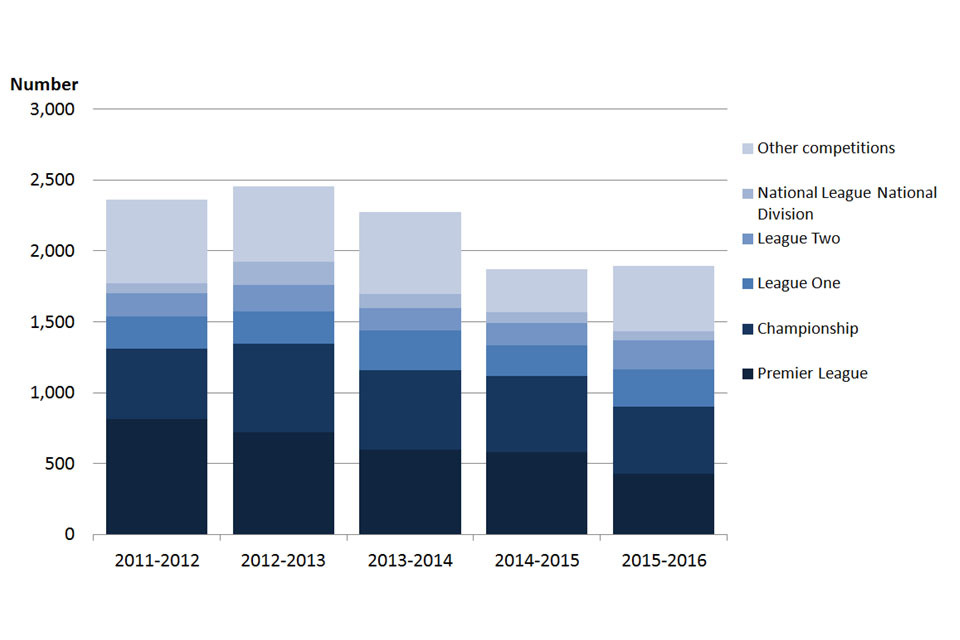
During the 2015 to 2016 season there were 1,895 football-related arrests by all 43 police forces in connection with regulated international and domestic football matches involving English and Welsh clubs and the national teams. This represents an increase of 1% (22) on the 2014 to 2015 season.
Figure 3 shows the number of football-related arrests over the last five seasons ranging from 1,873 to 2,456. There has been an overall decrease of 20% (-468) since the 2011 to 2012 season.
Of the 1,895 football-related arrests, the largest proportion occurred in connection with Championship matches, 25% (470). This season is the first time (over the last five seasons) that Premier League matches did not experience the highest proportion of football-related arrests, 23% (431) of football-related arrests.
Figure 3: Football-related arrests in England and Wales by competition, from 2011 to 2012 season to 2015 to 2016 season
Not supplied by author.
Source: Home Office, Table 11.
Notes:
- ‘Other competitions’ include FA Cup, League Cup, Football League Trophy, European competitions, Internationals, Under-21 internationals, Pre-season friendlies, Community Shield and UEFA Super Cup.
- Figures exclude BTP arrests.
Other competitions include domestic cups, European cups and international matches. In England and Wales there were 75 football-related arrests in international matches and 61 in European matches.
There were 55 football-related arrests in matches played outside of England and Wales; 35 in International matches and 20 in European matches.
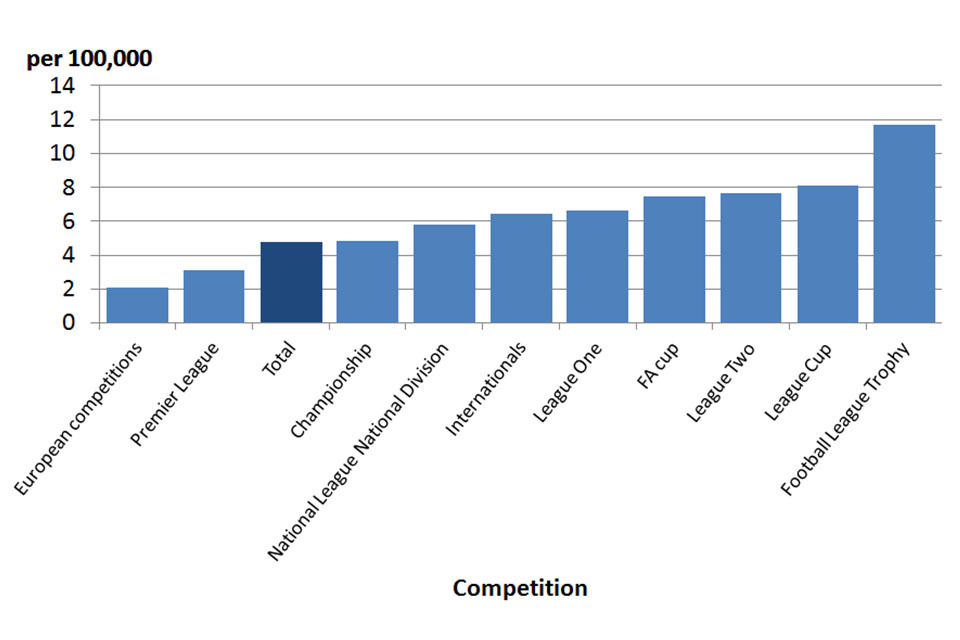
4.2 Football-related arrest rate per 100,000 attendees by competition
The football-related arrest rate in the 2015 to 2016 season was 4.8 arrests per 100,000 attendees. Of all competitions with 50 arrests or more, the League Cup had the highest arrest rate of 8.1 per 100,000 attendees whilst European competitions had the lowest arrest rate of 2.1 arrests per 100,000 attendees. Although the matches played in the Championship accounted for the highest number of football-related arrests, the arrest rate was 4.8 arrests per 100,000 attendees.
Figure 4: Football-related arrest rate per 100,000 attendees in England and Wales by competition, 2015 to 2016 season
Not supplied by author.
Source: Arrests per 100,000 figures are derived from two sources:
Home Office (Arrest data) and © Sky Sports Football Yearbook 2015 to 2016 (Attendance figures), Table 15.
Notes:
- Excludes ‘other’ competitions which include Community Shield, Under-21 internationals, Pre-season friendlies.
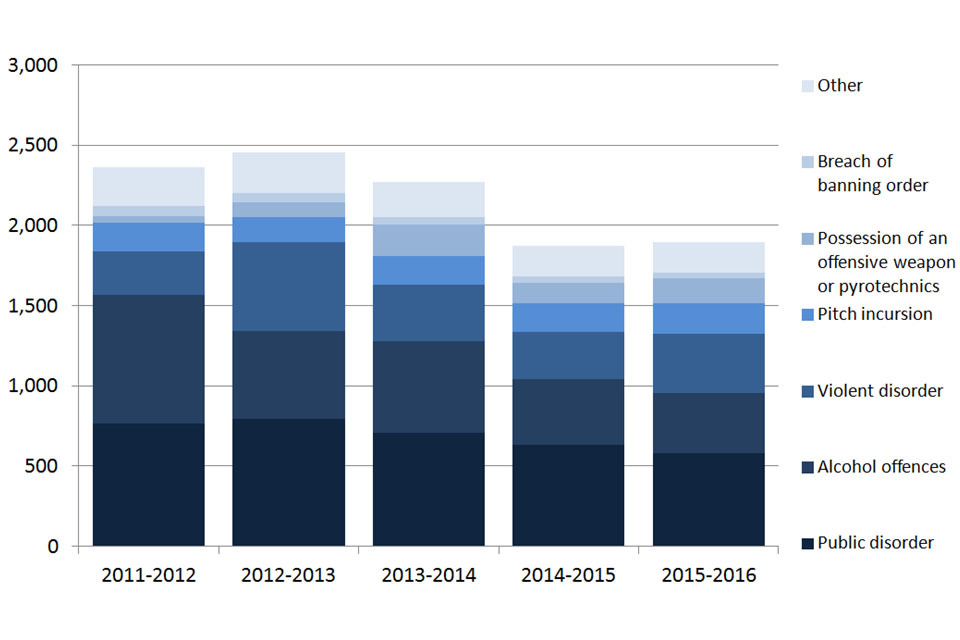
4.3 Football-related arrests by offence type
Of the 1,895 football-related arrests in the 2015 to 2016 season, the three most common offence types were public disorder (31%), alcohol offences (20%) and violent disorder (19%). Combined, these have accounted for the majority all football-related arrests in each of the last five seasons.
There has been a general decrease in some offence type over the last four seasons. However, there was a slight increase in the total number of football-related arrests in the 2012 to 2013 season, up by 93 arrests (4%) when compared with the 2011 to 2012 season. The main driving force for this was an increase in the number of football-related arrests for violent disorder in the 2012 to 2013 season, an increase of 281 arrests (103%) on 2011 to 2012. This was the largest numerical increase of all offence types in the 2012 to 2013 season.
Of the other offence types, the number of football-related arrests for racist and indecent chanting has fluctuated over the last five seasons, although figures have remained low in comparison to most other offence types. Football-related arrests for possession of pyrotechnics showed a large increase over the last five seasons, rising from 32 arrests in 2011 to 2012 to 141 arrests this season. The highest number of arrests for possession of pyrotechnics, over the last five seasons, occurred in 2013 to 2014 with 188 arrests.
Figure 5: Football-related arrests in England and Wales by offence type, from 2011 to 2012 season to 2015 to 2016 season
Not supplied by author.
Source: Home Office, Table 10.
Notes:
- ‘Other offences’ include throwing missiles, racist and indecent chanting, ticket touting and criminal damage.
- Figures exclude BTP arrests.
5. Corrections/revisions
Corrections and revisions follow the Home Office’s statement of compliance with the Code of Practice for Official Statistics.
5.1 Feedback and enquiries
The Home Office is seeking feedback on this publication so that we can assess how well it meets our users’ needs and make improvements where possible. If you have not already done so, please could you complete a short 5-minute survey.
If you have any comments, suggestions or enquiries, please email them to the Chief Statistician’s Unit, the Home Office Unit which produced the statistics at: CSU.Statistics@homeoffice.gov.uk.
-
Article 3 of the Football Spectators (Prescription) Order 2004 (as amended) describes a regulated match for the purposes of the Football Spectators Act 1989. ↩
-
Section 14A of the Football (Disorder) Act 2000. ↩
-
Section 14B of the Football (Disorder) Act 2000. ↩
-
The overlap between the years 2014 to 2015 and 2015 to 2016 may have resulted in some double counting. The dates of extraction for this season have been adjusted to standardise data reference dates for future publications. ↩
-
See page 6 of the user guide for more information. ↩
-
Football-related arrests rate excludes ‘other’ competitions which include Community Shield, Under-21 internationals, pre-season friendlies. ↩